Abstract
We present a systematic methodology to develop highly coarse-grained (CG) lipid models for large scale bio-membrane simulations, in which we derive CG interactions using a powerful combination of the multiscale coarse-graining (MS-CG) method, and an analytical form of the CG potential to model interactions at short range. The resulting hybrid coarse-graining (HCG) methodology is used to develop a three-site solvent-free model for 1,2-dilauroyl-sn-glycero-3-phosphocholine (DLPC), 1,2-dioleoyl-sn-glycero-3-phosphocholine (DOPC), and a 1:1 mixture of 1,2-dioleoyl-sn-glycero-3-phospho-L-serine (DOPS) and DOPC. In addition, we developed a four-site model of DOPC, demonstrating the capability of the HCG methodology in designing model lipid systems of a desired resolution. We carried out microsecond-scale molecular dynamics (MD) simulations of large vesicles, highlighting the ability of the model to study systems at mesoscopic length and time scales. The models of DLPC, DOPC and DOPC-DOPS have elastic properties consistent with experiment and structural properties such as the radial distribution functions (RDF), bond and angle distributions, and the z-density distributions that compare well with reference all-atom systems.
1. Introduction
Cells are the building blocks of multicellular organisms and lipid bilayers serve as the membrane boundary that surrounds the cell and its organelles.1–3 The membrane selectively controls the diffusion of ions, proteins and other molecules into and out of the cell based on the cell’s biological requirements.4 Besides having a critical role in mechanical protection and compartmentalization, lipids also play a major role in cellular signaling used to trigger a host of activities in the living organism. An example of a biological signaling process is a synaptic transmission where neurotransmitters in synaptic vesicles mediate the communication across neurons.5–6 Recently, a deeper understanding of the sensitivity of lipids to their surroundings and the signaling mechanisms of systems such as the G-protein coupled receptors7 has led to important breakthroughs in drug design. Advanced experimental techniques like neutron diffraction, electron microscopy and atomic force microscopy8–11 are frequently used to study lipid systems. Experiments have revealed a range of biological functions that lipids support and regulate and have also given insights into the mechanism involved during these processes.12–14,11 Nonetheless, numerous membrane behaviors and the mechanisms underlying the biological functions are currently beyond experimental reach, especially in studies involving in vivo processes where it becomes increasingly difficult to control experimental conditions.15–16
Computational modeling and simulation techniques17–20 are increasingly being used as an additional research tool to study biological membrane systems and enhance our understanding of the mechanisms involved at the atomic and cellular level. Modeling real biological membrane systems, made up of numerous types of lipids (including cholesterol) with variable compositions, is still challenging.21–22 The time and length scales of membrane processes may range from nanoseconds23–24 to seconds for vesicle formation and fusion. Some processes like pore formation25–26 and ion permeation27–28 through membranes can be studied by simulating small bilayer patches while others like cellular vesiculation, endocytosis and similar cellular processes require modeling of very large systems, including whole liposomes.29–30 Mechanisms that involve computationally tractable length and time scales and that might require interpretation for results of atomistic resolution are usually modeled using the all-atom representation. However, it is computationally infeasible to simulate membrane processes, such as synaptic transmission and formation and fusion of cells,31,1,32,7,33 with an all-atom representation since the time and length scales extend to seconds and micrometers respectively. For example, modeling a liposome 200 nm in diameter with an all-atom representation may entail propagating equations of motion for many millions of atoms. It would take months for such simulations to obtain a microsecond of sampling required to harvest statistically significant data with currently available computing resources. As such, coarse-grained (CG) simulations are increasingly being explored as viable alternatives for computational studies of membrane systems at experimentally relevant length and time scales.34–36
Coarse-graining of molecular systems is mostly done by defining CG sites that are made up of chemically connected atoms.35 The objective is to have as many atoms as is feasible in a given reduced unit to obtain a coarser representation of the system, thus minimizing the degrees of freedom considered. High frequency internal degrees of freedom, that are assumed not to greatly affect the physical properties of interest, are averaged out in the process. Several CG lipid models of lipids have been successfully developed in the recent years. The united atom models were the earliest versions of CG lipids where hydrogen atoms were merged with their backbone atoms.37 Less resolved CG models, such as those involving four to six carbon atoms per CG site,38–39 are known to give satisfactory global properties while maintaining local chemical specificity to a certain extent. However, the application of such models to study large time and length scale membrane phenomena is hindered due to an explicit CG representation of solvent molecules. Solvent-free models of lipid systems provide a significant leap in accessing large length and time scales. Based on the extent of the reduced representation, the solvent-free models may be categorized into “regular” CG models38,40,39,41–44 and very “aggressive” CG models.45–46,34,47,41,48–49 The earliest version of solvent-free lipid models50–51 were represented with empirical pair potentials designed to mimic the hydrophobic interactions and maintain cohesion for a consistent bilayer morphology.
Due to the limitations of the traditional pair-potentials, a broad fluid bilayer phase is not always found in a solvent-free model.46 Very aggressive solvent-free CG lipid models with three to ten sites per lipid have been recently developed, allowing the control of the properties of the fluid phase via tunable parameters.45–46,48–49 In such models, membrane properties such as bending rigidity, area compression modulus, lateral diffusion coefficient, and flip-flop rate can be varied over relevant ranges by a careful selection of parameters. However, since the modeling schemes for these models are based on designing interaction parameters that can reproduce experimental observations, a systematic protocol to develop aggressive CG models for individual lipids from the underlying atomistic forces, with limited fitting of parameters to match experimental results, was not the focus of that work.
In this paper, we develop a hybrid approach to aggressively coarse-grain lipid systems. The method is based on the MS-CG methodology,52–54 a variational method in which the data from all-atom simulations is used to determine the optimal CG force field for a chosen CG representation. The CG force field parameterization depends on a set of MD configurations and a predefined basis set for the CG force field. Lipid models with various degrees of coarse-graining have been successfully developed in the past with MS-CG using a cubic spline basis set55,42 or a more accurate and flexible B-spline basis set.43 The MS-CG method was also used to develop a single-site solvent-free hybrid analytical systematic (HAS) ellipsoidal lipid model41 where anisotropic interactions were modeled with an enhanced Gay-Berne potential.56 In this later work, the MS-CG approach was used to model the in-plane lipid center of mass interactions to maintain bilayer integrity.41
The hybrid coarse-grained (HCG) model presented here are instead full CG “bead” based models. They can reproduce the atomic-level RDFs and the z-density distributions and have elastic properties consistent with experimental data. Due to the aggressive level of coarse-graining inherent in the present work, however, limited atomistic-level sampling is obtained for the short-range (SR) interactions, a feature that gives rise to poor statistics for the MS-CG force-matching process in those regions. To surmount this challenge, a hybrid scheme is proposed in this work where the MS-CG method is supplemented with an analytical force field in the sparsely sampled SR configurational space in order to give the highly CG sites a proper repulsion and excluded volume. This methodology can then be used to systematically develop CG models with user-defined resolution, for individual and mixed lipid systems. We apply here the method to develop three-site solvent free models for lipid bilayers of DLPC, DOPC, and a 1:1 mixture of DOPC/DOPS. In addition, we develop a four-site DOPC model that illustrates the adjustable resolution capability of the model.
The remainder of this article is organized as follows: Section 2 briefly introduces the HCG scheme and explains the CG representations for DLPC, DOPC and DOPS used in this work, while also reviewing briefly the theory behind the MS-CG method. The details about the SR analytical functional form and bonded interactions are also discussed. The features of the all-atom reference systems used in this work to obtain the MS-CG interactions parameters are covered in section 3 while results including the validation and application of the model for large flat bilayer and liposomes are discussed in section 4. Section 5 presents conclusions and future directions.
2. The HCG method
2.1 CG representation
The DLPC, DOPC and DOPS lipid molecules are reduced to three-site highly CG models as shown in Figure 1. The solvent effects are effectively embedded in the CG force field interactions. We name the CG sites of the lipid molecule, head, mid and tail respectively, based on their topological location. The atoms from all-atom representation that constitute each CG site for the different lipids are listed in Table 1a. The individual mass of each CG site is equal to the sum of masses of all the atoms constituting that CG site and they are listed in Table 1b.
Figure 1.
Coarse-grained representation of the HCG models of DLPC, DOPC and DOPS lipid molecules described in this study
Table 1.
| a: The following table lists the atoms from all-atom representation that are associated with each CG site. The number representing individual atom in all-atom representation can be obtained from ref.64 | ||||
|---|---|---|---|---|
| CG Site | DOPC atoms | DLPC atoms | DOPS atoms | DOPC atoms (2 tails) |
| Head | 1–44 (44) | 1–27 (27) | 1–37 (37) | 1–37 (37) |
| Mid | 45–66, 92–113 (44) | 28–53, 76–84 (35) | 38–59, 85–106 (44) | 38–57, 85–104 (40) |
| Tail | 67–91, 114–138 (50) | 54–75, 85–106 (44) | 60–84, 107–131 (50) | 58–84 (27), 105–131 (27) |
| b: Mass of the CG sites used in the HCG models. Mass of each CG site is equal to the sum of masses of atoms that constitute the CG site as given in Table 1a. | |||
|---|---|---|---|
| CG Site | mass DOPC sites (amu) | mass DLPC sites (amu) | mass DOPS sites (amu) |
| Head | 196.160 | 182.137 | 185.134 |
| Mid | 311.440 | 157.147 | 311.440 |
| Tail | 278.524 | 140.270 | 278.524 |
While using the MS-CG procedure to develop highly CG models for lipid systems, a minimum number of CG sites were sought that could faithfully reproduce the structural and elastic properties. A cut-off of 4–5 Å was chosen for analytical form beyond which the CG interaction parameters were obtained completely from the MS-CG force-matching method. The lipids molecules could be successfully reduced to three-site models using this cutoff. The HCG model, while significantly reducing the number of degrees of freedom, thus retains the effective chain disorder. This is because the MS-CG force field represents the many-body potential of mean force between CG sites and hence its entropic components.53–54,57
Nevertheless, it is noteworthy that in the three-site CG model, the two tails are combined as a single CG site. Lipid tails have a large amount of disorder and representing the two tails with a single CG site can lead to loss of accuracy in structural features like tail-tail RDFs function and may compromise the bilayer stability. To explore this, we also developed a four-site CG model of DOPC where each tail is represented with a CG site. A comparison between tail-tail RDF between three-site and four-site models highlights this issue and is described in the Results section. It is also shown later that careful selection of the SR analytical interaction parameters can lead to a stable bilayer with acceptable elastic properties even with a mismatched tail-tail RDF. The current scheme can be easily extended to four or more CG site models and for other lipids.
The three-site mapping of pure DLPC and DOPC bilayers resulted in six pair-wise non-bonded, two bonded and one angular interactions. For the mixed DOPC-DOPS bilayer system, the DOPC and DOPS are represented as separate head groups whereas the mid and tail groups are modeled with the same CG parameters. This results in four additional non-bonded interactions with a total of ten non-bonded pairs of interactions. For the four-site model of DOPC, there are two tails, modeled with the same interactions, leaving six pairs of non-bonded, two bonded interactions and one angular interaction.
2.2 MS-CG interaction parameters
The details of the MS-CG method are provided elsewhere.52–54,42–43 In short, the MS-CG method is based on a variational principle where the CG force field is represented as a linear combination of arbitrary functions of unknown variables. The forces obtained from this CG force field are matched in a least-squared sense to the all-atom MD simulation (or other sources) to arrive at a final set of MS-CG force field parameters. The matching between CG and atomistic forces minimizes the residual52,47,53–54,42–43
| (1) |
where f(rn) are the reference “atomistic forces” projected on the CG sites calculated from the atomistic MD simulations and F(RN ; ϕ) are the CG forces calculated based on the assumed arbitrary function. Here rn ={r1, r2 … rn} and RN ={R1,R2 …RN} denote Cartesian spatial coordinates for the all-atom and CG representations, respectively. The pre-defined CG force field (called a basis set53) contains Nd parameters, ϕ={ϕ1,ϕ2….ϕNd}, that are determined using the variational minimization of the residual shown above.
The CG potential U(RN;ϕ) is obtained by integrating the CG force results from the MS-CG calculations, which is relatively straight forward if the non-bonded CG interactions are defined to be pair wise decomposable. It has been shown theoretically that the minimum value of the residual is obtained when F(RN ; ϕ) is the gradient of the exact many-body potential of mean force, U(RN), governing the CG variables RN .58–59,53–54,60–61 However, in practice, the optimal U(RN; ϕ) function is only an approximation to the exact U(RN) because the basis set for the assumed force-field is incomplete. The degree of sampling in the underlying atomistic MD simulation can also affect the quality of the result, especially in an aggressive CG model like the one developed in this work. As a result, as is discussed in the next section, an analytical component in the interaction potential can be incorporated to overcome the incomplete MS-CG sampling in the short range.
2.3 Analytical form for less sampled short range interactions
While using the MS-CG methodology, we found that statistically insufficient CG force field parameters were obtained in the short range, usually for RIJ < 5 Å. Figure 2 illustrates this point, as the MS-CG derived non-bonded interactions for all the pairs in the three-sites DOPC lipid model are shown. As is evident in Figure 2, the MS-CG interactions have rather poor sampling in the SR region.
Figure 2.
MS-CG-derived pair-wise interaction between CG sites in the DOPC 3-site model. MS-CG provides an accurate set of CG interactions for well-sampled regions of phase space. Due to poor sampling in the short range, the MS-CG method does not guarantee accurate interactions at close range. This is particularly true for highly CG models with a large number of atoms coarse-grained into a single site as shown in figure 1. An analytical interaction potential with user-selected parameters is used to represent the short-ranged interaction.
An analytical form was thus used to obtain the interactions in the sparsely sampled SR domain. The analytical function selected for the short-range interaction was of the form,
| (2) |
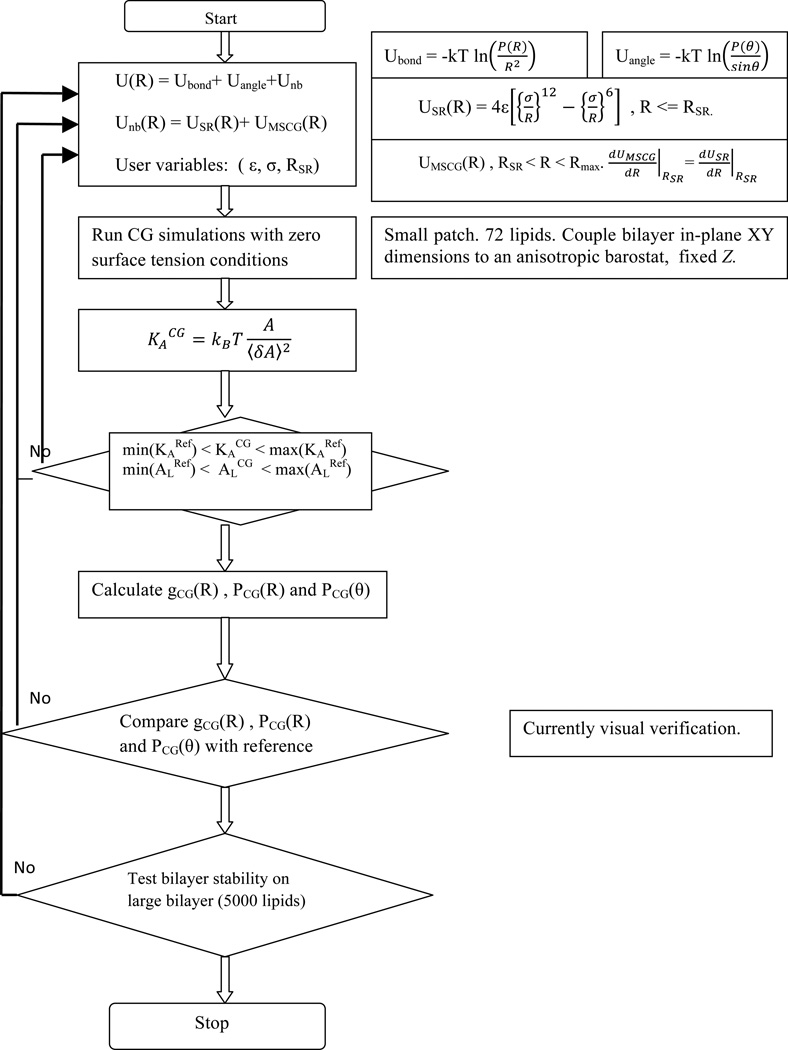
where ε, σ and RSR are the three parameters that define the short-range interaction analytically. The constants ε and σ are the standard Lennard-Jones parameters and RSR is the higher cutoff for the analytical part and it is kept to the minimum permissible value (generally < 5 Å) such that the bulk of the interaction space is defined by the MS-CG interactions. An informed set of values are chosen as initial guess for the fitting parameters for equation 2 to make the process of obtaining the analytical form more systematic. The ε and σ parameters are chosen such that the interactions obtained from analytical form and the MS-CG are C1 continuous around the lowest available range of MS-CG interaction data. Once all the interactions are defined (including the bonded interactions explained in next section), the three parameters are adjusted by running CG simulations on a small bilayer patch (~50 Å × 50 Å). A zero-surface tension boundary condition is maintained by coupling the CG bilayer with an anisotropic barostat in the x and y dimensions and keeping the z-dimension of the simulation box fixed. The area per lipid (AL), fluctuations in the area per lipid and the thickness of the CG bilayer patch are monitored for 20 million time steps with an integration time step of 50 fs. No external constraint with respect to AL or KA is applied to the CG system. However, if a stable bilayer is not formed or physical properties like AL and KA of the CG system are not comparable to AA data, the user defined parameter RSR is varied and the other two parameters (σ and ε) are recalculated by fitting the MS-CG data to equation 2, starting from the new RSR. The final RSR parameters are listed in Table S4 in SI. The preliminary estimates on the elastic properties such as the area compressibility modulus and bending modulus can be made from the knowledge of the above observables. If the AL, fluctuations in AL, bilayer thickness, and the RDFs are within the range of values observed in the all-atom simulations, the new HCG parameters are tested on large bilayer patch (40 nm × 40 nm) and liposome systems. The parameters are finalized once the large flat bilayer and liposomes are found stable for very long simulations (~ 40 million CG time steps). The steps involved in the obtaining the full HCG parameters are elucidated using a flowchart diagram in Figure 3.
Figure 3.
Flowchart showing the steps involved in the HCG modeling protocol.
2.4 Bonded interactions
The Inverse Boltzmann (IB) method62–63 was used to obtain the CG force field for the bonded interactions. The bond and angle probability distributions were sampled from the atomistic MD trajectory. Given the probability distributions, the CG bond potentials and the angular potential are derived from the IB relations as,
| (3) |
where R and θ are bond-length and bong angle respectively, kB is the Boltzmann’s constant, and T is the absolute temperature. The bond and angle probability distributions are represented as , respectively and are normalized by R2 for the bond length and sin(θ) for the angles. Since the reference probability distributions were not Gaussian, the bonded and angular interactions were represented as tabulated potentials instead of the harmonic approximation.
The force-field parameters (both bonded and non-bonded) for the HCG models of all the lipids are provided as tables in the Supporting Material (SM).
3. Building the solvent-free HCG model
Broadly speaking, the steps involved in the construction of a HCG model for a given lipid system are enumerated below:
Generate an all-atom reference trajectory for the given lipid system. The details of the reference all-atom MD simulations used in this work are discussed in section 3.1 below.
Choose the CG representation of the lipids (three sites, four sites etc) and obtain the effective reference CG coordinates and forces for each configuration from the reference all-atom trajectory.
Find the probability distribution for the CG bonds and angles from the reference CG coordinates and obtain the bond and angle-bending interaction parameters using the IB method as discussed in section 2.4
Apply the MS-CG based force-matching algorithm on the reference CG coordinates and forces to obtain the MS-CG non-bonded parameters for all possible pair interactions. The details of the MS-CG parameterization are discussed in section 3.2 below.
The portion of each SR non-bonded interaction that is not available from MS-CG is next supplemented with an analytical function using the adjustable parameters ε, σ and RSR as discussed in section 2.3. These parameters are then tested for large bilayer patches (~ 40 nm × 40 nm) and liposomes to ensure the stability of large bilayer systems over long time scales (~ 100 ns).
It should be noted that fitting the MS-CG data to simple potential functions like Lennard-Jones or Morse potential without going through the above mentioned protocol does not guarantee a stable bilayer. Such a simpler protocol would be desirable but was seen to fail. The MS-CG derived data for the DOPC lipid system was fitted to a Morse potential and CG simulations were carried out for a 5000 lipid bilayer system. MS-CG non-bonded pair interaction data for 3-sites DOPC lipid fitted to Morse-potential is shown in Figure S1. The fitted Morse potential parameters values are provided in Table S5. The bilayer structure is lost within few nanoseconds of simulation time. This shows that a simple parameterization of a global non-bonded function like Morse potential to the forces in the force matching does not work well. Carefully designed HCG parameters are needed that uniquely define the interactions that keep the bilayer morphology intact and reproduce the structural and physical properties well.
3.1. Reference all-atom MD simulations
The reference all-atom MD system for DLPC consisted of a bilayer with 50 DLPC lipid molecules and 1500 water molecules. A total of 72 DOPC lipid with 2100 water molecules were used to generate the all-atom trajectory for the HCG modeling of DOPC. The mixed DOPC-DOPS system consisted of 36 DOPC and 36 DOPS lipid with 2100 water molecules and the system was neutralized using Na+ and Cl−counter ions. The physiological salt concentration of 0.3M was used for all systems. All three systems had equal composition in each layer. It should be noted that the parameterization process is composition dependent and has to be repeated if the type of lipid or ratio of lipids in case of a mixed lipid system is changed. The goal of the present work is to develop highly coarse-grained models that can be great scaled up in system size for a given system.
The initial coordinates for the lipid bilayer for DLPC and DOPC were obtained from an existing all-atom simulation.64 For the mixed DOPC-DOPS system, half of the DOPC molecules in each layer were replaced with DOPS molecules. The bilayer systems were then solvated before placing in a periodic cell. The ratio of number of water molecules to number of lipid molecules was chosen to be around 30:1.65 CHARMM36 force field parameters64 were used for lipid molecules while water molecules and counter ions were simulated using the TIP3P force-field66. The cutoff for non-bonded van der Waals interactions was 12 Å and no long-range correction was imposed. A LJ switching function over 8 to 12 Å was used in the MD simulations and the long range electrostatic interactions were calculated via the particle mesh Ewald summation.67 An integration time step of 2 fs was used and the SHAKE algorithm68 was applied to constrain all C-H bonds. After an initial energy minimization, each bilayer system was run for about 40 ns in the constant NPT ensemble using the Nose-Hoover thermostat and Langevin piston at 1.01 bar and 310 K.
The average cell dimension in the last 20 ns of NPT run for DLPC was 39.72 Å × 39.72 Å × 58.84 Å. The average value of AL was 63.12 Å2 for the DLPC lipid bilayer system. The average AL for DOPC was found to be 68.20 Å2. These data are consistent with previous results from the CHARMM36 force field and experimental data.69 The average AL for mixed DOPC-DOPS lipid from all atom system was found to be 65.8 Å2. The AL for the mixed lipid system is less than the pure DOPC lipid system. This may appear counterintuitive due to the high probability of electrostatic repulsion taking place between the anionic phosphoserine (PS) head groups present in the system. However, recent all-atom simulations and experiments70–71 have provided conflicting evidence with respect to AL for mixed anionic lipids. The presence of anionic head groups in mixed lipid systems can lead to increased intra- and inter-molecular hydrogen bonding and strong ion-lipid interactions which may reduce the effective AL of the system.70 The AL may also depend on the salt concentration as shown in Ref.72 In absence of any definitive reference data for area per lipid of DOPC-DOPS system, the converged data from the all-atom simulations was used for all future studies. Once AL for an individual system converged in the NPT simulations, the different systems were run under the constant NVT ensemble for the next 60 ns. The last 40 ns of the constant NVT ensemble trajectory was used to sample reference forces and coordinates for the MS-CG calculations.
All the simulations were performed with the parallel MD program LAMMPS.73 Visualizations of the trajectory were performed with VMD74 and analysis was performed using LAMMPS and GROMACS.75
3.2 Details of the force-matching
The effective reference CG coordinates and forces for each configuration were calculated from the all-atom trajectory. The forces due to water molecules were incorporated into the effective force calculation of the CG sites. Atomic coordinates and forces were sampled every 1 ps for a total of 40,000 MD frames collected as input for the MS-CG procedure. B-Spline basis functions were used to interpolate the MS-CG forces. For B-Spline-based parameterization details, the reader is referred to the Methods section in Ref.43 The final CG force-table results were then interpolated and integrated to obtain tabular pair potential interactions for each different lipid model. The SR non-bonded interaction parameters were obtained as discussed in section 2.3. The full interactions parameters (including the SR interactions) for all the three lipid models are given in the Supplementary Information.
4. Simulation results and discussion
Three sets of CG simulations results are presented for each lipid system in this section. In the first set of CG simulations results, individual models for DLPC, DOPC and mixed DOPC-DOPS are validated against the corresponding reference systems by comparing RDFs, bond and angle distribution, and the z-density profile. Mean squared displacement (MSD) for DLPC is calculated and compared with the all-atom system to show the fluid nature of the HCG model. The second set of results is obtained by simulating a large flat membrane of 5000 lipids (~ 40 nm × 40 nm in area) and used primarily to measure important elastic properties like the area compressibility modulus and the bending modulus. Undulation spectra and the lateral pressure distribution are also calculated and shown for the DLPC HCG model. Lastly, the HCG models are tested with large liposome simulations (~120 nm). The liposome’s resilience to deformation is also tested to confirm model’s viability for large-scale simulations.
4.1 Model validation
The CG systems were created based on the reference systems discussed in section 3.1. The CG systems for DLPC and DOPC consisted of 50 and 72 lipids respectively. The mixed DOPC-DOPS system had 72 lipids with 1:1 composition. All CG simulations were carried out for up to 200 ns CG simulation time in the constant NVT ensemble for direct comparison with the reference system All simulation conditions were the same as those described in section 3.1 for the all-atom reference system. The structural properties were calculated for the CG simulation and validated with corresponding data from all-atom simulation.
4.1.1 RDFs
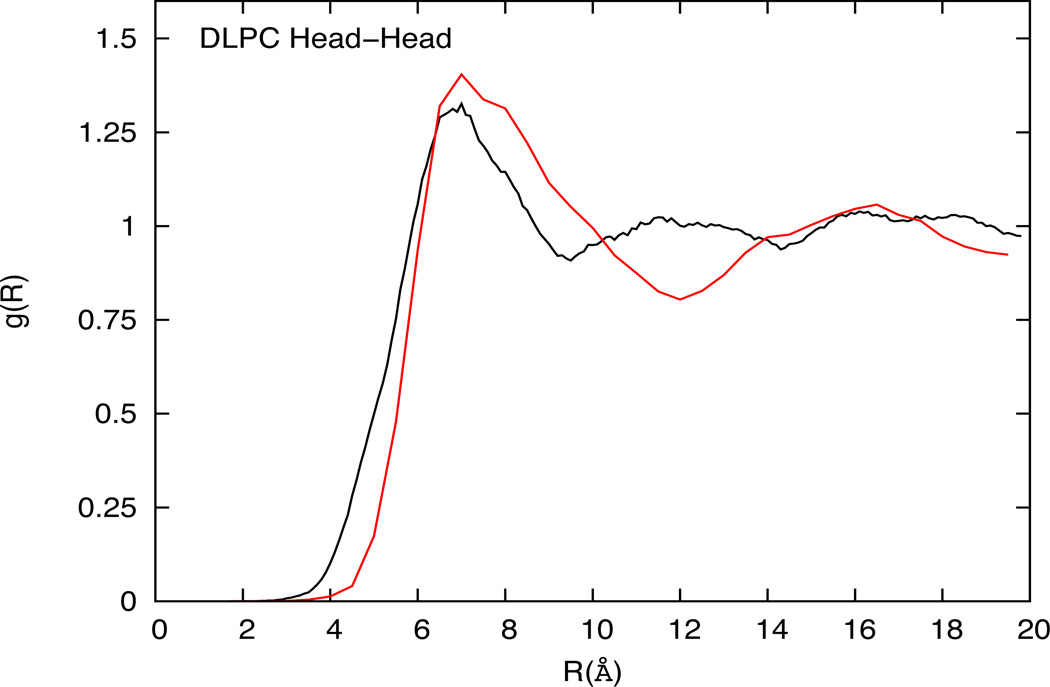
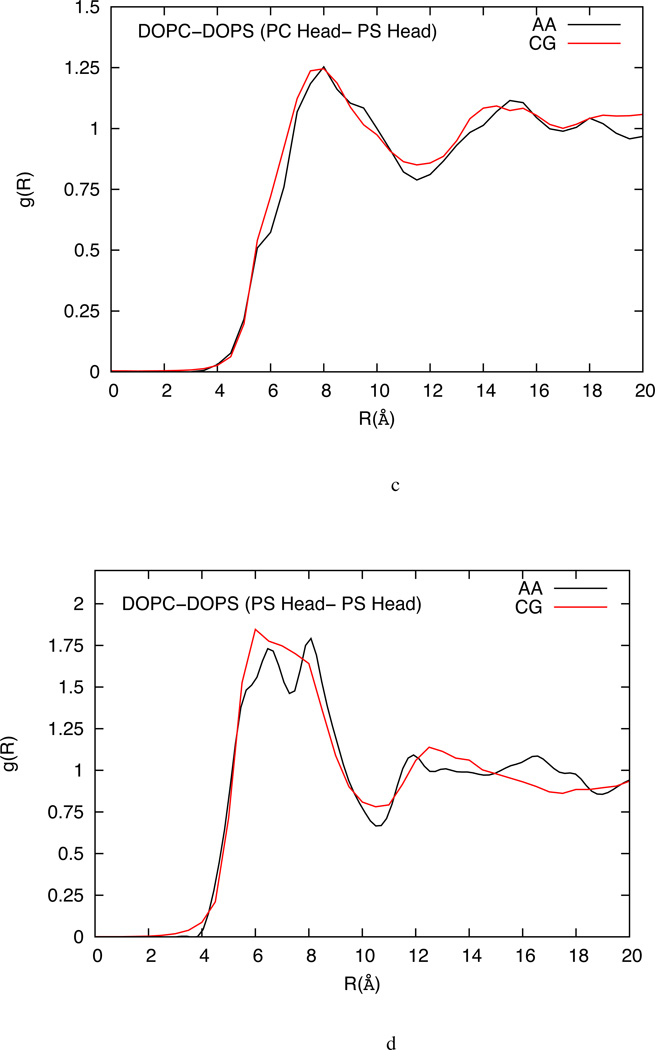
The two-dimensional RDF plots for the selected sites for DOPC, DLPC and mixed DOPC-DOPS are shown in figure 4, 5 and 6 respectively. Considering the ultra low-resolution of the CG models in this work, the RDF plots compare reasonably well with the all-atom MD results for the chosen site-site interactions. The HCG model is based on the MS-CG method that can in principle capture the many-body free-energy landscape accurately,53–54,57 and the agreements in RDFs indicate the underlying atomistic origin of the HCG model. The RDFs, particularly for the head-head pairs, have good agreement with the all-atom RDFs as shown in figure 4a, 5 and 6 for DOPC, DLPC and mixed DOPC-DOPS lipid bilayers, respectively. Unlike the DOPC and DLPC HCG model, there are two types of head groups in mixed DOPC-DOPS HCG model and the RDF plots between the different types of the head group (PC-PC, PC-PS and PS-PS) are shown in figures 6b, 6b and 6d respectively. RDF plots for all the head pairs compare well with the all-atom MD reference results. It is worth noting that the RDF for the PS-PS head groups is more structured (and has a higher peak value) than all other head-head distribution in this study. This suggests that the DOPC and DOPS lipids are not homogeneously distributed, and the DOPS lipids tend to aggregate more than the DOPC although there is no evidence of isolated clusters being formed. This may also explain the slightly reduced AL observed in mixed lipid system which may be caused due to the presence of anionic head groups giving rise to increased hydrogen bonding, strong ion-lipid interactions and higher possibility of salt bridges.72,70
Figure 4.
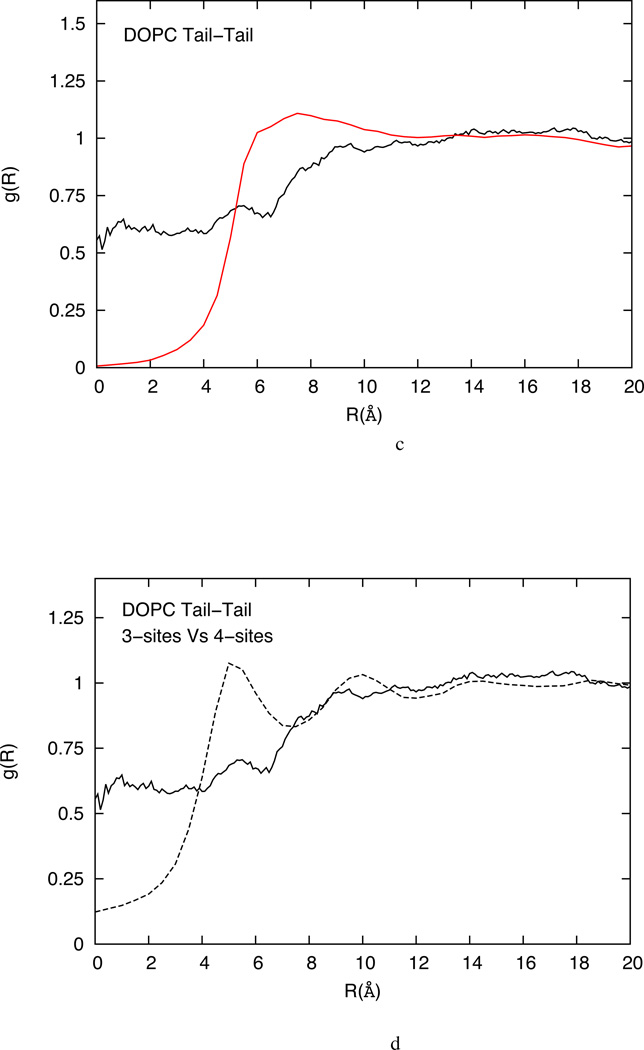
(a) Comparison of head-head RDFs from atomistic simulation (black) and solvent-free HCG simulation (red) for DOPC lipid system (b) Mid-mid RDFs from atomistic simulation (black) and solvent-free HCG simulation (red) for DOPC lipid system (c) Tail-tail RDFs from atomistic simulation (black) and solvent-free HCG simulation (red) for DOPC lipid system (d) Tail-tail RDFs from atomistic simulation with one tail CG representation (solid line) and two tails CG representation (dashed line) for the DOPC lipid system.
Figure 5.
Comparison of head-head RDFs from atomistic simulation (black) and solvent-free HCG simulation (red) for DLPC lipid system
Figure 6.
(a) Comparison of head-head RDFs from atomistic simulation (black) and solvent-free HCG simulation (red) for DOPC-DOPS lipid system (b) Head (PC)-head (PC) RDFs from atomistic simulation (black) and solvent-free HCG simulation (red) for DOPC-DOPS lipid system (c) Head (PC) – head (PS) RDFs from atomistic simulation (black) and solvent-free HCG simulation (red) for DOPC-DOPS lipid system (d) Head (PS)-head (PS) RDFs from atomistic simulation (black) and solvent-free HCG simulation (red) for DOPC-DOPS lipid system
The HCG model predictions for the mid and tail sites, that represent the more disordered region of the bilayer, are found to differ more greatly from the corresponding all-atom pair correlation function. This is due to the high lipid chain-packing irregularities and increased chain flexibility away from the head groups. While a limited deviation is found in the RDF plots for mid-mid pair in DOPC as shown in figure 4b, there are particularly large discrepancies for the tail-tail pair-correlation as shown in figure 3c. This discrepancy is especially pronounced in the SR region.
It is to be expected that the native structural correlation will be lost to a certain extent in an aggressively CG model especially for the sites that represent sections of two different tails with a single CG site. As shown in figure 4c, the tail-tail all-atom 2 dimensional RDF function has non-zero values (~ 0.5–0.6) in the SR of 0–6 Å. This is clearly an artifact of representing two distinct tails, which are highly flexible and sometimes intertwining, with a single CG site. This causes the centroid positions of two CG tail sites from different lipids in the same layer to overlap with each other, especially when projected on the two dimensional xy plane, as was done to calculate the two-dimensional RDF. Figure 4d highlights this effect where the all-atom RDF plots for tail-tail pair in three-site HCG model for DOPC is compared with the tail-tail pair of four-site DOPC model with two CG tail sites. The overlap reduces with four-site models and adding more sites could improve this further, although at the cost of overall computational efficiency.
In the three-site HCG model, accuracy in the tail-tail RDF is traded for bilayer stability. We found that when the interaction for the SR was kept very soft, to better reproduce the reference all-atom RDF data, the stability of the bilayer is compromised and the bilayer tends to aggregate in a micelle like structure due to strong effective interaction between tail groups. In order to have a stable bilayer, the range of repulsive interaction for tail-tail interaction must be expanded to avoid strong artificial cohesion at short ranges that leads to micelle like structure.
The aggressive nature of the HCG model is a primary reason for the mismatch in pair-correlation between the all-atom MD simulation and the CG simulation data. Additionally, certain features of the MS-CG method may also influence the RDFs. Since the MS-CG uses the pair wise interaction approximation, many body interactions are usually omitted in the parameterization process although this is not always the case.61 This assumption especially affects solvent-free CG models. Moreover, the minimization process in the MS-CG procedure is based on a least-squares method that is dependent on the available sampling.43
4.1.2 z-Density distribution
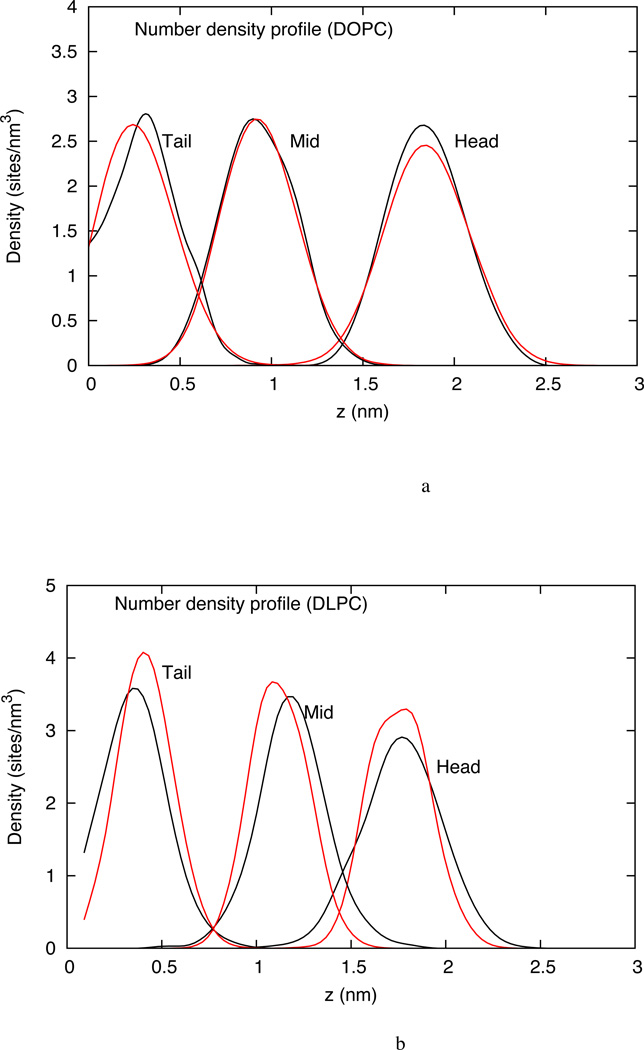
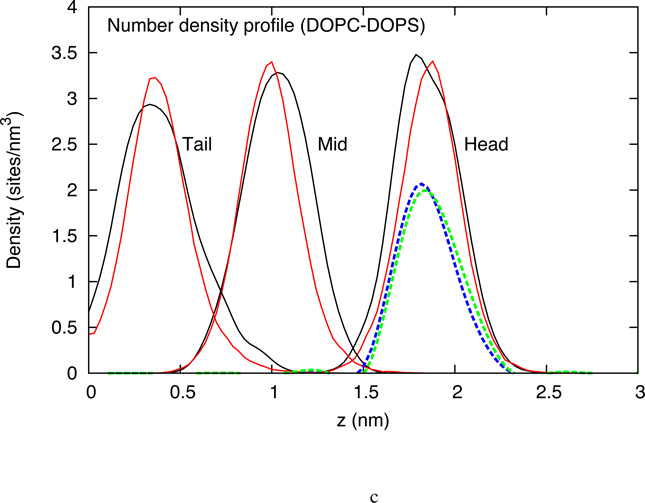
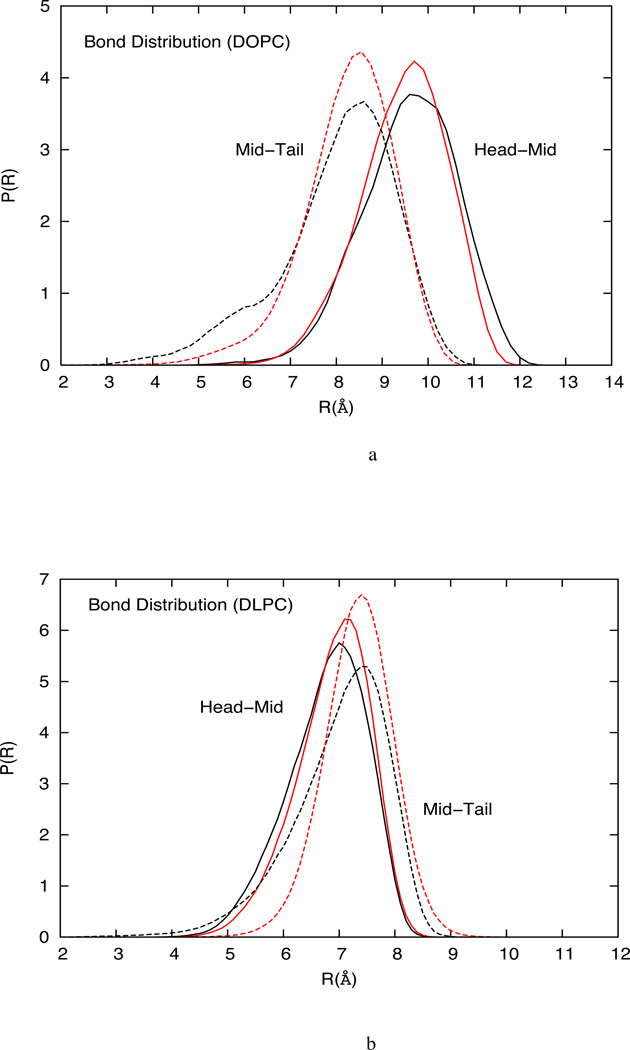
The number density distribution of individual sites in DOPC, DLPC and DOPC-DOPS are shown in figure 7a, 7b and 7c respectively as a function of the coordinates normal to the bilayer. This z-density profile shows good agreement with the all-atom trajectory. The z-density profile can also be used to estimate the bilayer thickness. It is seen that DOPC, which has longer tails (18-carbons per tail), is slightly thicker than DLPC (12-carbons per tail). The agreement with all-atom data implies that the bilayer thickness for the CG system is in the same range as that observed in the all-atom simulations.
Figure 7.
(a) z-density profile for three CG sites from the atomistic simulation (black) and the CG simulation (red) of DOPC HCG model (b) z-density profile for three CG sites from the atomistic simulation (black) and the CG simulation (red) of DLPC HCG model (c) z-density profile for three CG sites from the atomistic simulation (black) and the CG simulation (red) of DOPC-DOPS HCG model. The blue and green dashed lines represent the z-density profile of the DOPC and DOPS head group respectively. No heterogeneity with respect to distribution in z-dimension is observed.
4.1.3 Bond probability distribution
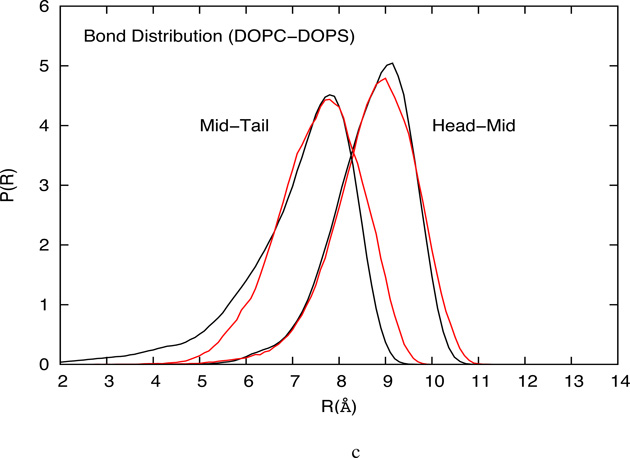
The CG bond length probability distributions for HCG DOPC, DLPC and mixed DOPC-DOPS lipid models are compared with the corresponding all-atom MD system in figure 8 and show good agreement with the reference all-atom distributions. It is observed that the longer tailed DOPC have a higher mean bond length than the DLPC lipid model. In addition, the DOPC lipids have broader bond distribution due to the presence of unsaturated bonds. In general, the mid-tail bond length distribution for the all-atom system is broader than the distribution obtained from the HCG model, which may be attributed to the strong cohesion between tail groups from the two leaflets. This cohesive force is critical in the formation of the condensed fluid phase for the HCG lipid model, especially in the absence of water that is a known source of cohesion for lipid systems. In this work, an imperfect bond length and angle distribution is acceptable in exchange for a stable fluid bilayer. To form a fluid phase bilayer system, the interaction potential must allow sufficient cohesion while retaining enough disorder to prevent gelation or solidification. The advantage of the HCG model is that such interactions arise naturally out of the MS-CG methodology.
Figure 8.
(a) Comparison of bond probability distributions from the atomistic simulation and the CG simulation of DOPC HCG model (b) Bond probability distributions from the atomistic simulation and the CG simulation of DLPC HCG model (c) Bond probability distributions from the atomistic simulation and the CG simulation of DOPC-DOPS HCG model.
4.1.4 Two-dimensional MSD
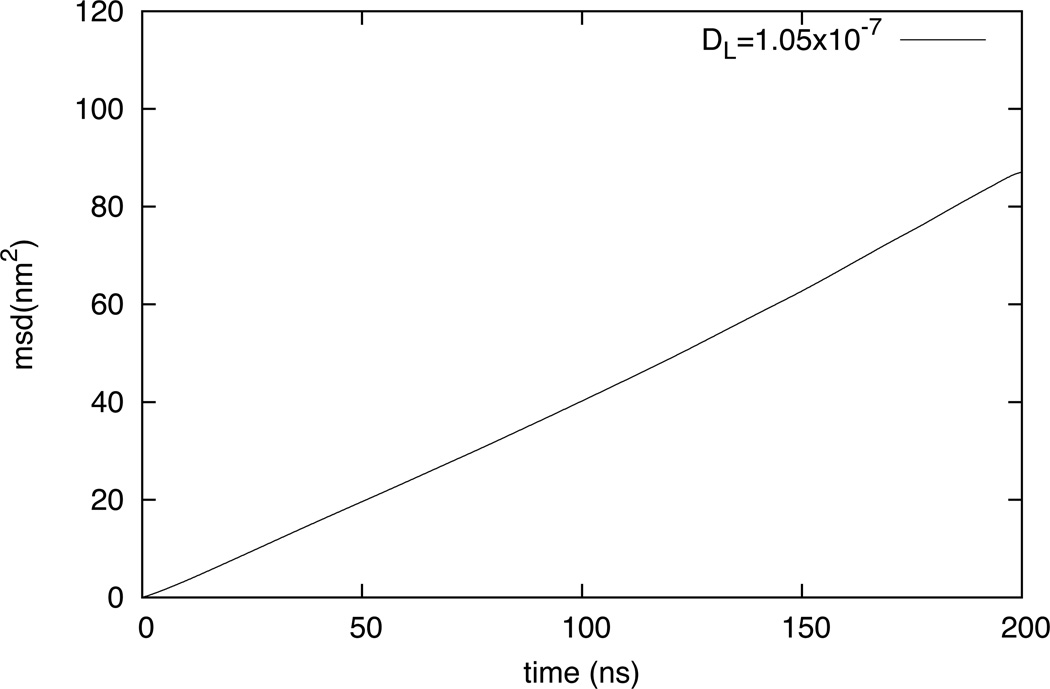
The two-dimensional MSD vs. time plot for the center of mass for the DLPC HCG model is shown in figure 9. Although this CG model is not designed to reproduce the exact dynamics, MSD calculations are carried out to show the fluid nature of the HCG model. The MSD plot represents the mobility of the lipid molecules in the plane of the lipid bilayer sheet. The lateral diffusion constant of the lipid is measured to be 1.05×10⁻⁷ cm2/s for DLPC from the MSD data. The linearity of MSD is tested up to 200 ns to verify that the CG system acts as a fluid over long time scales. The experimental value of the two-dimensional diffusion constant for the DLPC is (3.0 ±0.6) ×10−8 cm2/s.69,76 Clearly, the dynamics in the CG system is much faster than experimental value and the all-atom MD results as expected55. This is consistent behavior in a CG system where the increased diffusion is attributed to the loss of degree of freedom leading to a smoother free energy landscape. Accurate diffusion in CG models is not expected without either rescaling time or using a more general dynamics with proper frictional terms.77–80
Figure 9.
Mean-squared displacement of DLPC molecules calculated using center of mass diffusion. The experimental value of lateral diffusion constant DL for DLPC is 3×10⁻⁸ (+/− 20%) cm2/s.
4.2 Large flat bilayer (5000 lipids, 38nm × 38nm system)
The second set of CG simulations was carried out with 5000 lipids, consisting of 15,000 total CG sites for DLPC, DOPC and DOPC-DOPS membranes. The scale of the coarse-graining can be gauged by comparing the system size with respect to an equivalent all-atom system. For example, an equivalent membrane system with DLPC lipids would consist of 530,000 DLPC atoms and a total of approximately one million atoms including the water molecules. Figures 10a and 10b show the top and side view respectively of the DLPC flat bilayer after 2 µs of CG simulation. The CG simulations were performed for 40 million 50 fs time steps at 310 K and zero surface tension.
Figure 10.
Snapshot of the DLPC membrane simulated using solvent-free HCG methodology. The system size is 38 nm × 38 nm consisting of 5000 lipid molecules simulated for 200 ns (a) Top view. No structural correlation is visible (b) Side view. Thermal undulations modes are clearly visible.
4.2.1 Area compressibility modulus
The value of AL for DLPC, DOPC and mixed DOPC-DOPS HCG models was found to be 57.63 Å2, 66.2 Å2 and 61.4 Å2,, respectively. The values are slightly less than that observed in the all-atom systems, which are 58.20 Å2 and 67.4 Å2 for DLPC and DOPC respectively. CG systems tend toward a smaller AL than the corresponding all-atom system because of the softer effective potential energy landscape. Moreover, the AL in CG simulation is calculated by taking the average area of the simulation box with respect to lipids in one leaflet rather than the actual surface area of the lipid. Some decrease in AL can also be attributed to the undulation modes observed in large systems.81
The area compressibility KA for the CG lipid system was calculated using the fluctuation formula:
| (4) |
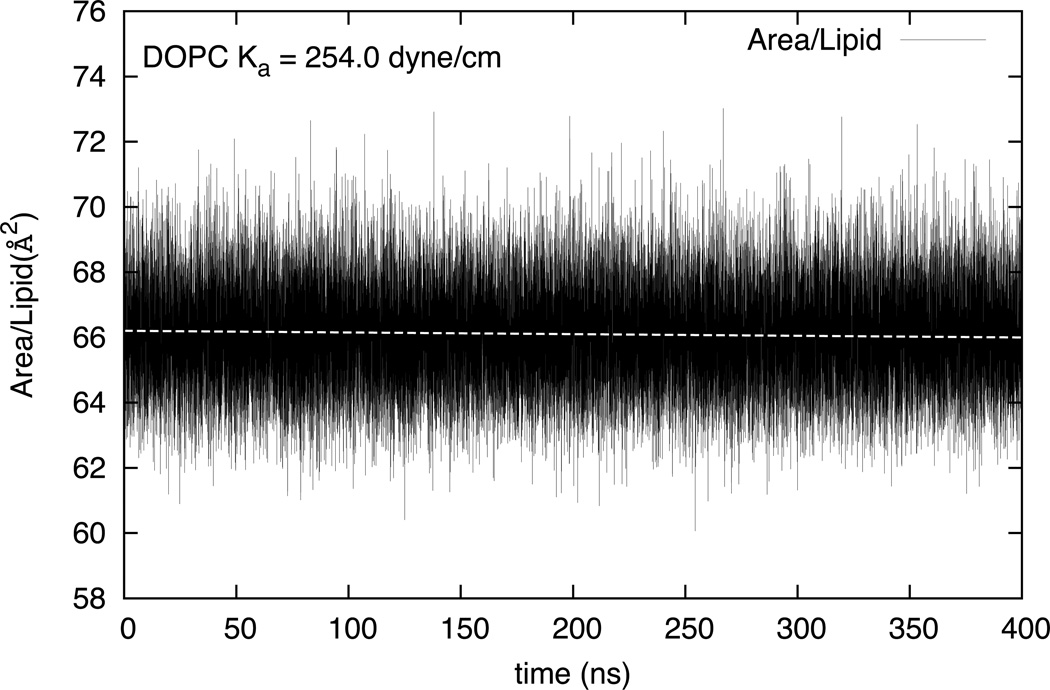
where A̅L is the average AL obtained under zero surface tension conditions and nL is the number of lipids in the system. Figure 11 shows the fluctuations in AL in the three-site DOPC HCG model for 400 ns. The area compressibility moduli for the three lipid systems studied in this paper are reported in Table 2. A comparison with reference experimental and all-atom simulation data is also made. The DOPC HCG model compares very well the experimental data.82–83 The area compressibility modulus of DLPC has a value of 310.42 dyne/cm for the HCG model and is comparable to the DOPC model. This can be assumed to be a reasonable value since KA is known to be very weakly dependent on membrane thickness and does not change much with chain length and level of saturation.83 In absence of any definitive experimental data, it is compared with a recent all-atom simulation result (461 (±92) dyne/cm)84 that is known to over estimate the KA.64 A much different value of KA (165.0 dyne/cm) is calculated for the mixed DOPC-DOPS lipid system. The reduction in KA is consistent with a recent experimental calculation that determines the mechanical properties (including KA) of DOPC-DOPS liposomes using a micropipette-aspiration techniques85 where the area compressibility modulus was found to be around 67 dyne/cm. The AL in mixed DOPC-DOPS HCG system has higher fluctuations than observed in pure DOPC or DLPC HCG model, which results in a large reduction in area compressibility even though AL is approximately similar to that seen in pure lipids. Bilayers with multiple lipid types have a higher propensity for spontaneous curvature due to compositional heterogeneities86 which may explain the higher flexibility of the mixed DOPC-DOPS HCG model.
Figure 11.
Area per lipid variation with time in CG simulations with DOPC HCG model. The compressibility modulus is calculated using the average area per lipid and its fluctuations.
Table 2.
Area compressibility modulus of the three HCG models and comparison with reference data.
4.2.2 Bending modulus
The bending modulus is a critical membrane material property that can be defined as the resistance of a membrane deforming from its existing curvature to some other curvature. This rigidity is very important in studies involving cellular level mechanisms like curvature inducing protein-membrane interactions, curvature mediated vesiculations, cell division and fusion.87,6,88–89 In this work, the bending modulus is calculated from membrane undulation spectrum using the Helfrich model.90–91 The bilayer is assumed to be a surface u(x,y) given as:91
| (5) |
where r = (x,y) is the two-dimensional real space vector and ztop and zbot are z-position of top and bottom leaflet respectively at any given r. The Fourier mode of the undulations height at any given time is denoted as u(q) where q = (qx, qy) are the two-dimensional reciprocal space vectors and have the following relationship with u (r).
| (6) |
Based on the Helfrich model, the fluctuation spectra Su(q) can be expressed in the Fourier space as:92,91
| (7) |
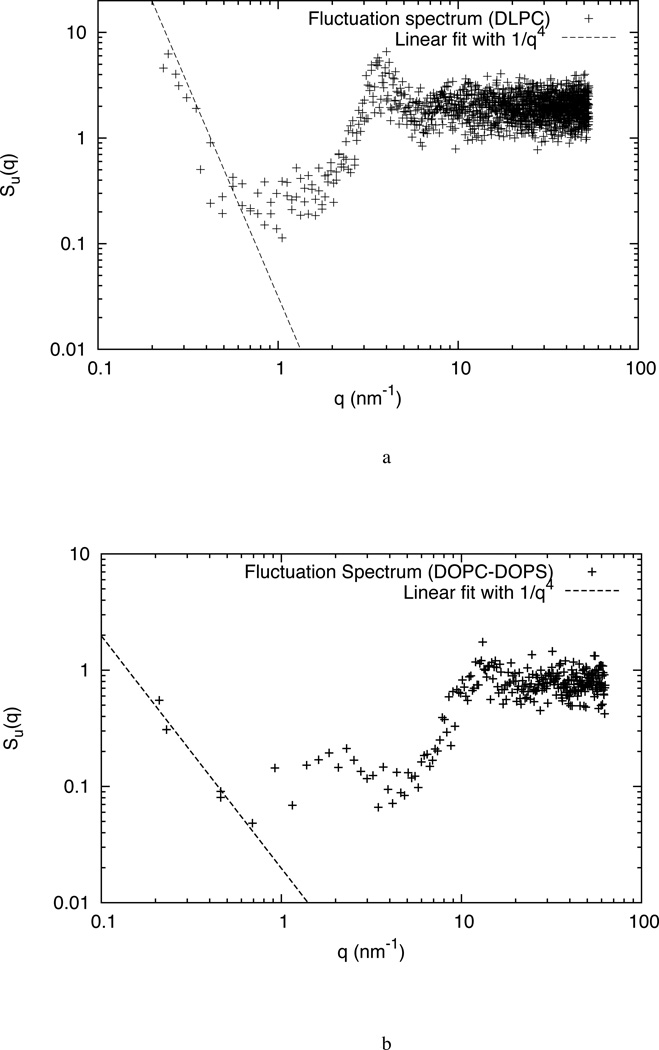
where N is the number of lipids, kc is the bending modulus and γ is the surface tension. Figure 12a shows the full fluctuation spectra of the HCG DLPC system in the large wavelength regime. The bending modulus is calculated by fitting the data to q−4. The value of bending modulus for the DLPC HCG model was found to be 6.65(±0.317) ×10−20 J that is approximately equal to 15 kBT. In general, the bending modulus of bilayer range89 from a few kBT to tens of kBT and the predicted modulus for the model is within the range of the experimental value of 5.5×10⁻²⁰ J.69,76,84 The bending modulus for DOPC HCG model was estimated to be around (7.64±0.671) ×10−20 (or ~18–19 kBT). This is in good agreement with the experimental data for DOPC where a value of 18.8 kBT was reported using x-ray scattering93 and a value of 21 kBT was obtained from pipette aspirations.83
Figure 12.
Full fluctuation spectra Su(q) for the (a) DLPC and (b) DOPC:DOPS HCG system versus wave vector q. The long wavelength undulation spectrum is used to calculate the bending modulus. The fitting is done to the theoretical q−4 line and is denoted as dashed line.
The bending modulus for a mixed DOPC-DOPS HCG model is calculated to be approximately equal to 7 kBT based on the Helfrich model. This calculated bending modulus is comparable to estimates provided by experiments on similar lipid system.86,85 Experiments86,85 on DOPG-DOPS calculations estimated the bending modulus to be around 5 kBT and was found to be heavily dependent on the composition.
The fluctuation spectrum for the mixed system is shown in Figure 12b. The fluctuation spectra profile is different from the spectra observed in pure lipid systems. A larger undulation (and extended protrusion)91 zone is observed. The bending modulus for DOPC:DOPS lipids is lower that that of pure lipid systems. The inclination for spontaneous curvature formation in the DOPC:DOPS system can be attributed to the significantly lower bending modulus as compared to pure lipid systems like DOPC and DLPC.
4.2.3 Lateral pressure distribution
Pressure in a lipid bilayer model is usually characterized using the 'lateral' pressure profile across the bilayer thickness. It is defined as the difference between the lateral and normal component of the pressure tensor in the lipid system.94–95,92,96 Given that the diagonal elements of the pressure tensor are Pxx, Pyy and Pzz where z direction is normal to the plane of the lipid surface, the lateral pressure across the thickness of the lipid bilayer is given as Plat(z) = Pzz(z)− 0.5[Pxx(z) + Pyy(z)]. Lateral pressure can be directly related to the surface tension and the bending modulus of the bilayer systems.92,96–97
In this work, the algorithm for generating pressure profile is based on per-atom stress tensor calculation. The atomic-stress tensor siαβ for a given atom is computed based on the virial formulation as:
| (8) |
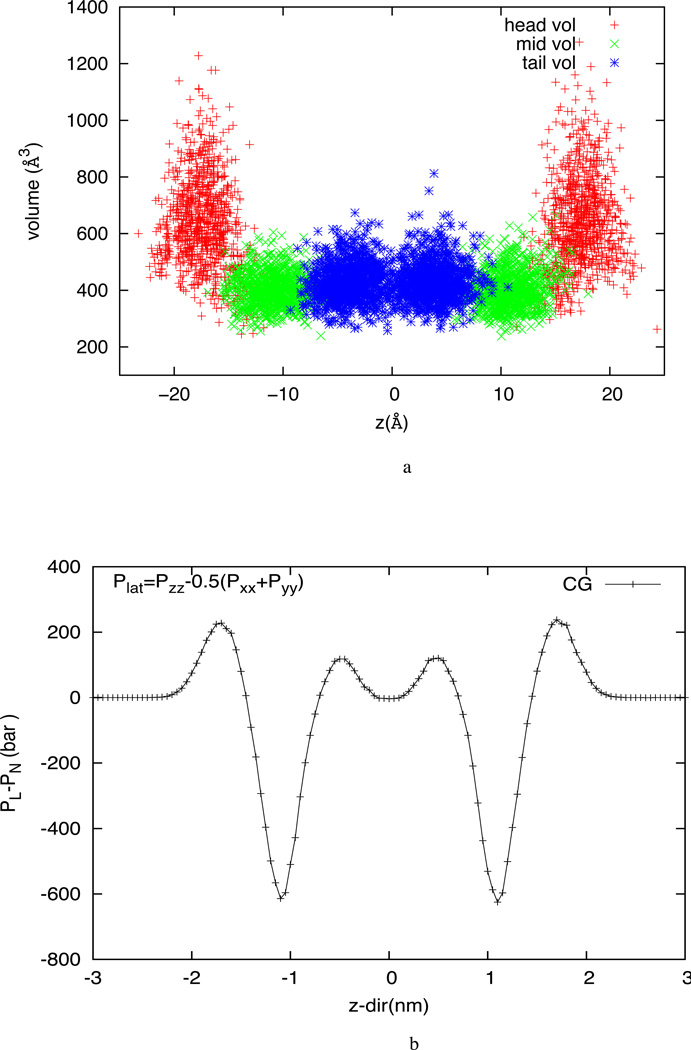
where α and β take on values x,y,z to generate the 6 components of the symmetric stress tensor. Here, rij is the vector from the position of the i-th atom to the position of the j-th atom. The velocity vi is the velocity vector of the i-th atom and mi is the atomic mass of i-th atom. The stress for each atom is due to its interaction with all other atoms in the simulation. Vi is the individual atomic volume. In this work, the atomic volume is calculated through Voronoi tessellation using the Voro++ tool.98 Figure 13a shows the “atomic volume” for each CG site calculated using Voronoi tessellation. To measure the z-dependent pressure profile, the simulation box is divided into 1 Å thick layers perpendicular to the bilayer normal direction. The total stress in a given layer is calculated from average stress of atoms belonging to the layer. The average over time is used as the final stress tensor value at the mean z-location for that layer. The pressure tensor is obtained by taking the negative of the stress tensor.
Figure 13.
(a) Circumscribing volume of individual CG site calculated using Voronoi tessellation (b) Lateral pressure profile for the HCG DOPC membrane
The lateral pressure profile obtained from the CG simulation of DOPC HCG model is shown in figure 13b. It is worth mentioning the lateral pressure profile calculated in this work using the virial formulation for the CG system gives an estimate of the relative lateral pressure across the thickness of the bilayer and in no way should the pressure values be taken to be exact because of the shortcomings of using a virial pressure formulation for coarse-grained systems. The profile shows positive pressures near the water-lipid interface and in the tail interior and a negative lateral pressure in the middle of the leaflet. This profile is qualitatively consistent with other lipid models.92,96,40,45,48,44 The lateral pressure profile can be broadly divided into three distinct zones for analysis. The first zone marks the extreme left and right of the profile and represents the head group and solvent interface region of the all-atom lipid system. The lateral pressure is zero for isotropic water and sharply rises to about 250 bar in the region representative of the water-lipid interface. The positive lateral pressure in this zone reflects the repulsive interactions between head-group sites that prevent the head groups from aggregating into a reverse-micelle like structure thereby disrupting the bilayer morphology. The second zone marks the middle of the leaflet where the lateral pressure steeply drops to as much as −600 bar indicating a strong compression zone. This is the region in the lipid system where the hydrocarbon atoms past the hydrophilic head groups compete to reduce contact with water. The third zone is the center of the bilayer where lateral pressures rises up to 100 bars and settles to a nominally positive value in the middle. The positive values of lateral pressure in the core suggest that tails at the center of the bilayer tend to expand the system laterally. This tail-tail repulsion can be attributed to entropic resistance to compression at the center of the bilayer.
4.3 Liposome simulation
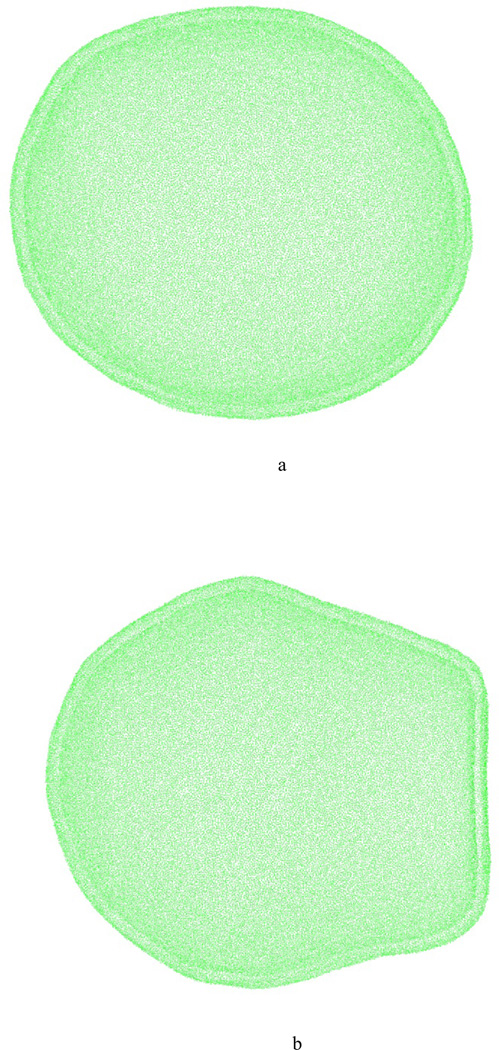
HCG models for DOPC, DLPC and mixed DOPC-DOPS lipid systems were tested with large liposome simulations (~120 nm diameter) for at least 20 million time steps with a time step of 50 fs. Two snapshots from liposome simulations performed for pure DLPC HCG lipid models are shown in figure 14a and 14b. In both sets, the size of the liposome is 120 nm in diameter and it consists of 172316 lipids (516948 CG sites). This CG system effectively represents the full liposome including the water atoms. In the first simulation, the liposome system was run for 20 million steps (time step of 50 fs). The liposome was stable for the duration of the simulation as shown in figure 14a. A second set of simulation on liposome was done with initially distorted structure to test the resilience of the model to distortions. The initial distorted liposome was prepared by bringing together two liposomes in close proximity with each other and simulating for 4 million CG time steps. At the end of the simulation, both liposomes were distorted at the interface. One of them was selected for the resilience test and the initial structure is shown in figure 14(b). The spherical shape was recovered from the distorted liposome within 10 million CG time steps. On a 512-processer machine, 150–200 ns of simulation time could be achieved in 24 hours with the current model while running on LAMMPS MD software. Additional CG simulations were carried out to test the fidelity of the HC model for high curvature systems (smaller liposomes). The four smaller liposomes that were simulated had diameters of 10nm, 20 nm, 40 nm and 80 nm. The liposomes with diameters greater than 10 nm were found to be stable for 20 million time steps. It must be noted that these HCG models are not intended for small systems, which should presumably require a more highly resolved CG model to model accurately. However, the present simulations reflect the considerable advantage in terms of computational efficiency and the range of mesoscopic time and length scales that can be accessed by the current MS-CG based aggressive HCG lipid models.
Figure 14.
(a) A CG simulation of liposome (DLPC), 120 nm in diameter, after 1 µs of CG simulation run with time step of 50 fs (b) A distorted liposome modeled which converged to spherical geometry after 20 ns of simulation time. The test was done to test the resilience of the model to deformation.
5. Conclusion
A new HCG protocol based on the MS-CG methodology is presented in this paper to systematically develop solvent-free highly CG models for lipids. CG interaction parameters are obtained using the MS-CG method in the range where atomistic configurations are well sampled. In this hybrid approach, analytical functions are used for CG interactions in the sparsely sampled SR configuration space at atomic-level. This HCG methodology was applied to develop three-site CG models for DLPC, DOPC and DOPC-DOPS lipid systems in this work. A four-site DOPC HCG model with two tails was also developed to show the flexibility of the modeling approach in terms of user defined CG resolution. The HCG model shows good agreement with atomic-level structural properties like RDF and z-density despite the very aggressive nature of the coarse-graining. The model is also shown to reproduce critical biophysical membrane properties, including area compressibility, bending modulus, and lateral stress profile.
This model provides significant advantages in the simulation length and time scales that can be explored for important membrane-protein related biophysical studies. The scope of this model is demonstrated by successfully simulating a 120 nm diameter liposome for 1 µs (20 million steps with 50 fs time step). The protocol developed in this paper can be used to develop similar CG models of other lipids and lipid-mixture systems that can be used in the study of large membrane-protein systems in the future. As a part of future work, further modifications to the HCG model will also be made to explicitly represent the screened electrostatic interactions, especially for anionic lipids like DOPS, DOPG and PIP2/PIP3.
Supplementary Material
Acknowledgement
This research was supported by the National Institutes of Health (NIH grant number R01-GM063796). The authors thank Mijo Simunovic and Dr. Gerrick Lindberg for their critical reading of the manuscript. Chun-Liang Lai and Dr. Frank Vazquez are acknowledged for insightful discussions. Computational resources were provided by the National Science Foundation through XSEDE computing resources (Grant Number TG-MCA94P017) specifically, the Texas Advanced Computing Center.
Footnotes
Supporting Information: Interaction parameters in form of tables for all the four systems studied in this work are provided as supplemental information. The tables for pair-wise non-bonded interactions for DLPC, DOPC (3 sites), DOPC-DOPS and DOPC (4 sites) models are provided in Table 1a, 1b, 1c and 1d respectively. The bonded and angle potential are also provided and labeled accordingly. Figure S1, S2 and Table S5 are provided to show the limits of developing the HCG model by fitting the MS-CG data to simple non-bonded analytical form. Table S6 lists the user-defined parameter RSR for various systems. This material is available free of charge via the Internet at http://pubs.acs.org/.
References
- 1.Lipowsky R, Sackmann E, Hoff AJ, editors. Handbook of Biological Physics. 1st ed. Vol. 1A. North Holland: Elsevier; 1995. Structure and Dynamics of Membranes I. From Cells to Vesicles; p. 1052. [Google Scholar]
- 2.Alberts B, Johnson A, Lewis L, Raff M, Roberts K, Walter P. Molecular Biology of the Cell. 4th ed. New York: Garland Science; 2002. p. 1616. [Google Scholar]
- 3.Karp G. Cell and Molecular Biology: Concepts and Experiments. 5th ed. Hoboken, NJ: John Wiley & Sons; 2007. p. 864. [Google Scholar]
- 4.Brown HA, Marnett LJ. Introduction to Lipid Biochemistry, Metabolism, and Signaling. Chem. Rev. 2011;111:5817–5820. doi: 10.1021/cr200363s. [DOI] [PubMed] [Google Scholar]
- 5.Heuser JE, Reese TS, Dennis MJ, Jan Y, Jan L, Evans L. Synaptic vesicle exocytosis captured by quick freezing and correlated with quantal transmitter release. J. Cell Biol. 1979;81:275–300. doi: 10.1083/jcb.81.2.275. [DOI] [PMC free article] [PubMed] [Google Scholar]
- 6.McMahon HT, Gallop JL. Membrane curvature and mechanisms of dynamic cell membrane remodelling. Nature. 2005;438:590–596. doi: 10.1038/nature04396. [DOI] [PubMed] [Google Scholar]
- 7.Filmore D. It's a GPCR world. Mod. Drug Discovery. 2004;7:24–28. [Google Scholar]
- 8.Nagle JF, Tristram-Nagle S. Structure of Lipid Bilayers. Biochim. Biophys. Acta. 2000;1469:159–195. doi: 10.1016/s0304-4157(00)00016-2. [DOI] [PMC free article] [PubMed] [Google Scholar]
- 9.Petrache H, Dodd S, Brown M. Area per Lipid and Acyl Length Distributions in Fluid Phosphatidylcholines Determined by 2H NMR Spectroscopy. Biophys. J. 2000;79:3172–3192. doi: 10.1016/S0006-3495(00)76551-9. [DOI] [PMC free article] [PubMed] [Google Scholar]
- 10.Yeagle P, editor. The Structure of Biological Membranes. 2nd ed. Boca Raton, FL: CRC Press; 2004. p. 552. [Google Scholar]
- 11.McGillivray DJ, Valincius G, Vanderah DJ, Febo-Ayala W, Woodward JT, Heinrich F, Kasianowicz JJ, Lösche M. Molecular-scale structural and functional characterization of sparsely tethered bilayer lipid membranes. Biointerphases. 2007;2:21–33. doi: 10.1116/1.2709308. [DOI] [PubMed] [Google Scholar]
- 12.Petrache H, Salmon A, Brown M. Structural Properties of Docosahexaenoyl Phospholipid Bilayers Investigated by Solid-State 2H NMR Spectroscopy. J. Am. Chem. Soc. 2001;123:12611–12622. doi: 10.1021/ja011745n. [DOI] [PubMed] [Google Scholar]
- 13.Veatch SL, Polozov IV, Gawrisch K, Keller SL. Liquid Domains in Vesicles Investigated by NMR and Fluorescence Microscopy. Biophys. J. 2004;86:2910–2922. doi: 10.1016/S0006-3495(04)74342-8. [DOI] [PMC free article] [PubMed] [Google Scholar]
- 14.Kučerka N, Tristram-Nagle S, Nagle J. Structure of Fully Hydrated Fluid Phase Lipid Bilayers with Monounsaturated Chains. J. Membr. Biol. 2006;208:193–202. doi: 10.1007/s00232-005-7006-8. [DOI] [PubMed] [Google Scholar]
- 15.Peter BJ, Kent HM, Mills IG, Vallis Y, Butler PJG, Evans PR, McMahon HT. BAR domains as sensors of membrane curvature: The amphiphysin BAR structure. Science. 2004;303:495–499. doi: 10.1126/science.1092586. [DOI] [PubMed] [Google Scholar]
- 16.Gallop JL, Jao CC, Kent HM, Butler PJ, Evans PR, Langen R, McMahon HT. Mechanism of endophilin N-BAR domain-mediated membrane curvature. EMBO J. 2006;25:2898–2910. doi: 10.1038/sj.emboj.7601174. [DOI] [PMC free article] [PubMed] [Google Scholar]
- 17.Allen M, Tildesley D. Computer Simulation of Liquids. New York: Clarendon Press; 1989. p. 385. [Google Scholar]
- 18.Binder K, editor. Monte Carlo and Molecular Dynamics Simulations in Polymer Science. New York: Oxford University Press; 1995. p. 587. [Google Scholar]
- 19.Frenkel D, Smit B. Understanding Molecular Simulation: From Algorithms to Applications. San Diego, CA: Academic Press; 2002. [Google Scholar]
- 20.Feller S, Simon SA, Benos DJ, editors. Current Topics in Membranes, Vol. 60. 1st ed. Vol. 60. Burlington, Mass: Academic Press; 2008. Computational Modeling of Membrane Bilayers; p. 448. [Google Scholar]
- 21.Ayton GS, Voth GA. Systematic multiscale simulation of membrane protein systems. Curr. Opin. Struct. Biol. 2009;19:138–144. doi: 10.1016/j.sbi.2009.03.001. [DOI] [PMC free article] [PubMed] [Google Scholar]
- 22.Marrink SJ, de Vries AH, Tieleman DP. Lipids on the move: Simulations of membrane pores, domains, stalks and curves. Biochim. Biophys. Acta, Biomembr. 2009;1788:149–168. doi: 10.1016/j.bbamem.2008.10.006. [DOI] [PubMed] [Google Scholar]
- 23.Tieleman D, Marrink SJ. Lipids Out of Equilibrium: Energetics of Desorption and Pore Mediated Flip-Flop. J. Am. Chem. Soc. 2006;128:12462–12467. doi: 10.1021/ja0624321. [DOI] [PubMed] [Google Scholar]
- 24.Gurtovenko AA, Vattulainen I. Molecular Mechanism for Lipid Flip-Flops. J. Phys. Chem. B. 2007;111:13554–13559. doi: 10.1021/jp077094k. [DOI] [PubMed] [Google Scholar]
- 25.Leontiadou H, Mark AE, Marrink SJ. Molecular Dynamics Simulations of Hydrophilic Pores in Lipid Bilayers. Biophys. J. 2004;86:2156–2164. doi: 10.1016/S0006-3495(04)74275-7. [DOI] [PMC free article] [PubMed] [Google Scholar]
- 26.Sengupta D, Leontiadou H, Mark AE, Marrink SJ. Toroidal pores formed by antimicrobial peptides show significant disorder. Biochim. Biophys. Acta. 2008;1778:2308–2317. doi: 10.1016/j.bbamem.2008.06.007. [DOI] [PubMed] [Google Scholar]
- 27.Vernier PT, Ziegler MJ, Sun Y, Chang WV, Gundersen MA, Tieleman DP. Nanopore Formation and Phosphatidylserine Externalization in a Phospholipid Bilayer at High Transmembrane Potential. J. Am. Chem. Soc. 2006;128:6288–6289. doi: 10.1021/ja0588306. [DOI] [PubMed] [Google Scholar]
- 28.Khavrutskii IV, Gorfe AA, Lu B, McCammon JA. Free Energy for the Permeation of Na+ and Cl− Ions and Their Ion-Pair through a Zwitterionic Dimyristoyl Phosphatidylcholine Lipid Bilayer by Umbrella Integration with Harmonic Fourier Beads. J. Am. Chem. Soc. 2009;131:1706–1716. doi: 10.1021/ja8081704. [DOI] [PMC free article] [PubMed] [Google Scholar]
- 29.Ayton GS, Lyman E, Voth GA. Hierarchical coarse-graining strategy for protein-membrane systems to access mesoscopic scales. Faraday Discuss. 2010;144:347–357. doi: 10.1039/b901996k. [DOI] [PMC free article] [PubMed] [Google Scholar]
- 30.Ayton GS, Voth GA. Multiscale Computer Simulation of the Immature HIV-1 Virion. Biophys. J. 2010;99:2757–2765. doi: 10.1016/j.bpj.2010.08.018. [DOI] [PMC free article] [PubMed] [Google Scholar]
- 31.Heuser JE, Reese TS, Dennis MJ, Jan Y, Jan L, Evans L. Synaptic vesicle exocytosis captured by quick freezing and correlated with quantal transmitter release. The Journal of Cell Biology. 1979;81:275–300. doi: 10.1083/jcb.81.2.275. [DOI] [PMC free article] [PubMed] [Google Scholar]
- 32.Lee E, Marcucci M, Daniell L, Pypaert M, Weisz OA, Ochoa GC, Farsad K, Wenk MR, De Camilli P. Amphiphysin 2 (Bin1) and T-tubule biogenesis in muscle. Science. 2002;297:1193–1196. doi: 10.1126/science.1071362. [DOI] [PubMed] [Google Scholar]
- 33.Sato K, Nakano A. Dissection of COPII subunit-cargo assembly and disassembly kinetics during Sar1p-GTP hydrolysis. Nat. Struct. Mol. Biol. 2005;12:167–174. doi: 10.1038/nsmb893. [DOI] [PubMed] [Google Scholar]
- 34.Brannigan G, Lin L, Brown F. Implicit solvent simulation models for biomembranes. Eur. Biophys. J. 2006;35:104–124. doi: 10.1007/s00249-005-0013-y. [DOI] [PubMed] [Google Scholar]
- 35.Voth G. Coarse-Graining of Condensed Phase and Biomolecular Systems. Boca Raton: Taylor & Francis; 2008. [Google Scholar]
- 36.Murtola T, Bunker A, Vattulainen I, Deserno M, Karttunen M. Multiscale modeling of emergent materials: biological and soft matter. Phys. Chem. Chem. Phys. 2009;11:1869–1892. doi: 10.1039/b818051b. [DOI] [PubMed] [Google Scholar]
- 37.Berger O, Edholm O, Jahnig F. Molecular dynamics simulations of a fluid bilayer of dipalmitoylphosphatidylcholine at full hydration, constant pressure, and constant temperature. Biophys. J. 1997;72:2002–2013. doi: 10.1016/S0006-3495(97)78845-3. [DOI] [PMC free article] [PubMed] [Google Scholar]
- 38.Shelley JC, Shelley MY, Reeder RC, Bandyopadhyay S, Klein ML. A Coarse Grain Model for Phospholipid Simulations. J. Phys. Chem. B. 2001;105:4464–4470. [Google Scholar]
- 39.Marrink SJ, Risselada HJ, Yefimov S, Tieleman DP, de Vries AH. The MARTINI Force Field: A Coarse Grained Model for Biomolecular Simulations. J. Phys. Chem. B. 2007;111:7812–7824. doi: 10.1021/jp071097f. [DOI] [PubMed] [Google Scholar]
- 40.Marrink SJ, de Vries AH, Mark AE. Coarse grained model for semiquantitative lipid simulations. J. Phys. Chem. B. 2004;108:750–760. [Google Scholar]
- 41.Ayton GS, Voth GA. Hybrid Coarse-Graining Approach for Lipid Bilayers at Large Length and Time Scales. J. Phys. Chem. B. 2009;113:4413–4424. doi: 10.1021/jp8087868. [DOI] [PMC free article] [PubMed] [Google Scholar]
- 42.Izvekov S, Voth GA. Solvent-Free Lipid Bilayer Model Using Multiscale Coarse-Graining. J. Phys. Chem. B. 2009;113:4443–4455. doi: 10.1021/jp810440c. [DOI] [PMC free article] [PubMed] [Google Scholar]
- 43.Lu L, Voth GA. Systematic Coarse-graining of a Multicomponent Lipid Bilayer. J. Phys. Chem. B. 2009;113:1501–1510. doi: 10.1021/jp809604k. [DOI] [PMC free article] [PubMed] [Google Scholar]
- 44.Wang Z-J, Deserno M. A Systematically Coarse-Grained Solvent-Free Model for Quantitative Phospholipid Bilayer Simulations. J. Phys. Chem. B. 2010;114:11207–11220. doi: 10.1021/jp102543j. [DOI] [PMC free article] [PubMed] [Google Scholar]
- 45.Brannigan G, Philips P, Brown F. Flexible lipid bilayers in implicit solvent. Phys. Rev. E. 2005;72 doi: 10.1103/PhysRevE.72.011915. 011915(1–4). [DOI] [PubMed] [Google Scholar]
- 46.Cooke I, Kremer K, Deserno M. Tunable generic model for fluid bilayer membranes. Phys. Rev. E. 2005;72 doi: 10.1103/PhysRevE.72.011506. 011506(1𠄴). [DOI] [PubMed] [Google Scholar]
- 47.Shih AY, Arkhipov A, Freddolino PL, Schulten K. Coarse Grained Protein-Lipid Model with Application to Lipoprotein Particles. J. Phys. Chem. B. 2006;110:3674–3684. doi: 10.1021/jp0550816. [DOI] [PMC free article] [PubMed] [Google Scholar]
- 48.Sodt AJ, Head-Gordon T. An implicit solvent coarse-grained lipid model with correct stress profile. J. Chem. Phys. 2010;132 doi: 10.1063/1.3408285. 205103(1–8). [DOI] [PMC free article] [PubMed] [Google Scholar]
- 49.Noguchi H. Solvent-free coarse-grained lipid model for large-scale simulations. J. Chem. Phys. 2011;134 doi: 10.1063/1.3541246. 055101(1–12). [DOI] [PubMed] [Google Scholar]
- 50.Drouffe J, Maggs A, Leibler S. Computer simulations of self-assembled membranes. Science. 1991;254:1353–1356. doi: 10.1126/science.1962193. [DOI] [PubMed] [Google Scholar]
- 51.Farago O. ``Water-free" computer model for fluid bilayer membranes. J. Chem. Phys. 2003;119:596–605. [Google Scholar]
- 52.Izvekov S, Voth GA. A multiscale coarse-graining method for biomolecular systems. J. Phys. Chem. B. 2005;109:2469–2473. doi: 10.1021/jp044629q. [DOI] [PubMed] [Google Scholar]
- 53.Noid WG, Chu J-W, Ayton GS, Krishna V, Izvekov S, Voth GA, Das A, Andersen HC. The multiscale coarse-graining method. I. A rigorous bridge between atomistic and coarse-grained models. J. Chem. Phys. 2008;128 doi: 10.1063/1.2938860. 244114(1–11). [DOI] [PMC free article] [PubMed] [Google Scholar]
- 54.Noid WG, Liu P, Wang Y, Chu J-W, Ayton GS, Izvekov S, Andersen HC, Voth GA. The multiscale coarse-graining method. II. Numerical implementation for coarse-grained molecular models. J. Chem. Phys. 2008;128 doi: 10.1063/1.2938857. 244115(1–20). [DOI] [PMC free article] [PubMed] [Google Scholar]
- 55.Izvekov S, Voth GA. Multiscale coarse-graining of mixed phospholipid/cholesterol bilayers. J. Chem. Theory Comput. 2006;2:637–648. doi: 10.1021/ct050300c. [DOI] [PubMed] [Google Scholar]
- 56.Gay JG, Berne BJ. Modification of the overlap potential to mimic a linear site--site potential. J. Chem. Phys. 1981;74:3316–3319. [Google Scholar]
- 57.Lu L, Voth GA. The multiscale coarse-graining method. VII. Free energy decomposition of coarse-grained effective potentials. J. Chem. Phys. 2011;134 doi: 10.1063/1.3599049. 224107(1–10). [DOI] [PubMed] [Google Scholar]
- 58.Izvekov S, Voth GA. Multiscale coarse graining of liquid-state systems. J. Chem. Phys. 2005;123 doi: 10.1063/1.2038787. 134105(1–13). [DOI] [PubMed] [Google Scholar]
- 59.Noid WG, Chu JW, Ayton GS, Voth GA. Multiscale coarse-graining and structural correlations: Connections to liquid-state theory. J. Phys. Chem. B. 2007;111:4116–4127. doi: 10.1021/jp068549t. [DOI] [PMC free article] [PubMed] [Google Scholar]
- 60.Das A, Andersen HC. The multiscale coarse-graining method. III. A test of pairwise additivity of the coarse-grained potential and of new basis functions for the variational calculation. J. Chem. Phys. 2009;131 doi: 10.1063/1.3173812. 034102(1–11). [DOI] [PubMed] [Google Scholar]
- 61.Larini L, Lu L, Voth GA. The multiscale coarse-graining method. VI. Implementation of three-body coarse-grained potentials. J. Chem. Phys. 2010;132 doi: 10.1063/1.3394863. 164107(1–10). [DOI] [PubMed] [Google Scholar]
- 62.Tschöp W, Kremer K, Batoulis J, Bürger T, Hahn O. Simulation of polymer melts. I. Coarse-graining procedure for polycarbonates. Acta Polym. 1998;49:61–74. [Google Scholar]
- 63.Reith D, Meyer H, Muller-Plathe F. CG-OPT: A software package for automatic force field design. Comput. Phys. Commun. 2002;148:299–313. [Google Scholar]
- 64.Klauda JB, Venable RM, Freites JA, O'Connor JW, Tobias DJ, Mondragon-Ramirez C, Vorobyov I, MacKerell AD, Pastor RW. Update of the CHARMM All-Atom Additive Force Field for Lipids: Validation on Six Lipid Types. J. Phys. Chem. B. 2010;114:7830–7843. doi: 10.1021/jp101759q. [DOI] [PMC free article] [PubMed] [Google Scholar]
- 65.Ulrich AS, Watts A. Molecular response of the lipid headgroup to bilayer hydration monitored by 2H-NMR. Biophys. J. 1994;66:1441–1449. doi: 10.1016/S0006-3495(94)80934-8. [DOI] [PMC free article] [PubMed] [Google Scholar]
- 66.Jorgensen WL, Chandrasekhar J, Madura JD. Comparison of simple potential functions for simulating liquid water. J. Chem. Phys. 1983;79:926–935. [Google Scholar]
- 67.Essmann U, Perera L, Berkowitz ML, Darden T, Lee H, Pedersen LG. A Smooth Particle Mesh Ewald Method. J. Chem. Phys. 1995;103:8577–8593. [Google Scholar]
- 68.Ryckaert J-P, Ciccotti G, Berendsen HJC. Numerical integration of the cartesian equations of motion of a system with constraints: molecular dynamics of n-alkanes. J. Comput. Phys. 1977;23:327–341. [Google Scholar]
- 69.Kučerka N, Liu Y, Chu N, Petrache HI, Tristram-Nagle S, Nagle JF. Structure of Fully Hydrated Fluid Phase DMPC and DLPC Lipid Bilayers Using X-Ray Scattering from Oriented Multilamellar Arrays and from Unilamellar Vesicles. Biophys. J. 2005;88:2626–2637. doi: 10.1529/biophysj.104.056606. [DOI] [PMC free article] [PubMed] [Google Scholar]
- 70.Zhao W, Rug T, Gurtovenko AA, Vattulainen I, Karttunen M. Atomic-Scale Structure and Electrostatics of Anionic Palmitoyloleoylphosphatidylglycerol Lipid Bilayers with Na+ Counterions. Biophys. J. 2007;92:1114–1124. doi: 10.1529/biophysj.106.086272. [DOI] [PMC free article] [PubMed] [Google Scholar]
- 71.Pan J, Heberle FA, Tristram-Nagle S, Szymanski M, Koepfinger M, Katsaras J, Kučerka N. Molecular structures of fluid phase phosphatidylglycerol bilayers as determined by small angle neutron and X-ray scattering. Biochim. Biophys. Acta, Biomembr. 2012;1818:2135–2148. doi: 10.1016/j.bbamem.2012.05.007. [DOI] [PMC free article] [PubMed] [Google Scholar]
- 72.Nagle JF, Tristram-Nagle S. Structure of lipid bilayers. Biochim. Biophys. Acta, Rev. Biomembr. 2000;1469:159–195. doi: 10.1016/s0304-4157(00)00016-2. [DOI] [PMC free article] [PubMed] [Google Scholar]
- 73.Steve P. Fast Parallel Algorithms for Short-Range Molecular Dynamics. J. Comput. Phys. 1995;117:1–19. [Google Scholar]
- 74.Humphrey W, Dalke A, Schulten K. VMD: visual molecular dynamics. J. Mol. Graph. 1996;14:33–38. 27–28. doi: 10.1016/0263-7855(96)00018-5. [DOI] [PubMed] [Google Scholar]
- 75.Hess B, Kutzner C, van der Spoel D, Lindahl E. GROMACS 4: Algorithms for highly efficient, load-balanced, and scalable molecular simulation. J. Chem. Theory Comput. 2008;4:435–447. doi: 10.1021/ct700301q. [DOI] [PubMed] [Google Scholar]
- 76.Kučerka N, Nagle JF, Sachs JN, Feller SE, Pencer J, Jackson A, Katsaras J. Lipid Bilayer Structure Determined by the Simultaneous Analysis of Neutron and X-Ray Scattering Data. Biophys. J. 2008;95:2356–2367. doi: 10.1529/biophysj.108.132662. [DOI] [PMC free article] [PubMed] [Google Scholar]
- 77.Izvekov S, Voth GA. Modeling real dynamics in the coarse-grained representation of condensed phase systems. J. Chem. Phys. 2006;125 doi: 10.1063/1.2360580. 151101(1–4). [DOI] [PubMed] [Google Scholar]
- 78.Murarka RK, Liwo A, Scheraga HA. Separation of time scale and coupling in the motion governed by the coarse-grained and fine degrees of freedom in a polypeptide backbone. J. Chem. Phys. 2007;127 doi: 10.1063/1.2784200. 155103(1–16). [DOI] [PubMed] [Google Scholar]
- 79.Izvekov S, Chung PW, Rice BM. The multiscale coarse-graining method: Assessing its accuracy and introducing density dependent coarse-grain potentials. J. Chem. Phys. 2010;133 doi: 10.1063/1.3464776. 064109(1–16). [DOI] [PubMed] [Google Scholar]
- 80.Soheilifard R, Makarov DE, Rodin GJ. Rigorous coarse-graining for the dynamics of linear systems with applications to relaxation dynamics in proteins. J. Chem. Phys. 2011;135 doi: 10.1063/1.3613678. 054107(1–10). [DOI] [PubMed] [Google Scholar]
- 81.Braun AR, Brandt EG, Edholm O, Nagle JF, Sachs JN. Determination of Electron Density Profiles and Area from Simulations of Undulating Membranes. Biophys. J. 2011;100:2112–2120. doi: 10.1016/j.bpj.2011.03.009. [DOI] [PMC free article] [PubMed] [Google Scholar]
- 82.Tristram-Nagle S, Petrache HI, Nagle JF. Structure and Interactions of Fully Hydrated Dioleoylphosphatidylcholine Bilayers. Biophys. J. 1998;75:917–925. doi: 10.1016/S0006-3495(98)77580-0. [DOI] [PMC free article] [PubMed] [Google Scholar]
- 83.Rawicz W, Olbrich KC, McIntosh T, Needham D, Evans E. Effect of Chain Length and Unsaturation on Elasticity of Lipid Bilayers. Biophys. J. 2000;79:328–339. doi: 10.1016/S0006-3495(00)76295-3. [DOI] [PMC free article] [PubMed] [Google Scholar]
- 84.Poger D, Mark AE. On the Validation of Molecular Dynamics Simulations of Saturated and cis-Monounsaturated Phosphatidylcholine Lipid Bilayers: A Comparison with Experiment. J. Chem. Theory Comput. 2009;6:325–336. doi: 10.1021/ct900487a. [DOI] [PubMed] [Google Scholar]
- 85.Allen-Rodowicz K, Francisco H, Layton B. Determination of the mechanical properties of DOPC:DOPS liposomes using an image procession algorithm and micropipette-aspiration techniques. Chem. Phys. Lipids. 2010;163:787–793. doi: 10.1016/j.chemphyslip.2010.09.004. [DOI] [PubMed] [Google Scholar]
- 86.Claessens MMAE, van Oort BF, Leermakers FAM, Hoekstra FA, Cohen Stuart MA. Bending rigidity of mixed phospholipid bilayers and the equilibrium radius of corresponding vesicles. Phys. Rev. E. 2007;76 doi: 10.1103/PhysRevE.76.011903. 011903(1–6). [DOI] [PubMed] [Google Scholar]
- 87.Marrink SJ, Mark AE. The Mechanism of Vesicle Fusion as Revealed by Molecular Dynamics Simulations. J. Am. Chem. Soc. 2003;125:11144–11145. doi: 10.1021/ja036138+. [DOI] [PubMed] [Google Scholar]
- 88.Zimmerberg J, Kozlov MM. How proteins produce cellular membrane curvature. Nat. Rev. Mol. Cell Biol. 2006;7:9–19. doi: 10.1038/nrm1784. [DOI] [PubMed] [Google Scholar]
- 89.Derek M. Lateral Pressure Profile, Spontaneous Curvature Frustration, and the Incorporation and Conformation of Proteins in Membranes. Biophys. J. 2007;93:3884–3899. doi: 10.1529/biophysj.107.107938. [DOI] [PMC free article] [PubMed] [Google Scholar]
- 90.Helfrich W. Elasticity and Thermal Undulations of Fluid Films of Amphiphiles. In: Charvolin J, Joanny JF, Zinn-Justin J, editors. Liquids and Interfaces. Amsterdam: Elsevier; 1990. p. 680. Les Houches XLVIII 1988. [Google Scholar]
- 91.Brandt EG, Braun AR, Sachs JN, Nagle JF, Edholm O. Interpretation of Fluctuation Spectra in Lipid Bilayer Simulations. Biophys. J. 2011;100:2104–2111. doi: 10.1016/j.bpj.2011.03.010. [DOI] [PMC free article] [PubMed] [Google Scholar]
- 92.Lindahl E, Edholm O. Mesoscopic undulations and thickness fluctuations in lipid bilayers from molecular dynamics simulations. Biophys. J. 2000;79:426–433. doi: 10.1016/S0006-3495(00)76304-1. [DOI] [PMC free article] [PubMed] [Google Scholar]
- 93.Pan J, Tristram-Nagle S, Kučerka N, Nagle JF. Temperature Dependence of Structure, Bending Rigidity, and Bilayer Interactions of Dioleoylphosphatidylcholine Bilayers. Biophys. J. 2008;94:117–124. doi: 10.1529/biophysj.107.115691. [DOI] [PMC free article] [PubMed] [Google Scholar]
- 94.Marsh D. Lateral pressure in membranes. Biochim. Biophys. Acta, Rev. Biomembr. 1996;1286:183–223. doi: 10.1016/s0304-4157(96)00009-3. [DOI] [PubMed] [Google Scholar]
- 95.Cantor RS. Lateral Pressures in Cell Membranes:,Äâ A Mechanism for Modulation of Protein Function. J. Phys. Chem. B. 1997;101:1723–1725. [Google Scholar]
- 96.Lindahl E, Edholm O. Spatial and energetic-entropic decomposition of surface tension in lipid bilayers from molecular dynamics simulations. J. Chem. Phys. 2000;113 3882(1–12). [Google Scholar]
- 97.Marrink SJ, Mark AE. Effect of undulations on surface tension in simulated bilayers. J. Phys. Chem. B. 2001;105:6122–6127. [Google Scholar]
- 98.Rycroft CH, Kamrin K, Bazant MZ. Assessing continuum postulates in simulations of granular flow. J. Mech. Phys. Solids. 2009;57:828–839. [Google Scholar]
Associated Data
This section collects any data citations, data availability statements, or supplementary materials included in this article.


