

Abstract
Neutron production is of principal concern when designing proton therapy vault shielding. Conventionally, neutron calculations are based on analytical methods, which do not accurately consider beam shaping components and nozzle shielding. The goal of this study was to calculate, using Monte Carlo modeling, the neutron spectral fluence and neutron dose equivalent generated by a realistic proton therapy nozzle and evaluate how these data could be used in shielding calculations. We modeled a contemporary passive scattering proton therapy nozzle in detail with the MCNPX simulation code. The neutron spectral fluence and dose equivalent at various locations in the treatment room were calculated and compared to those obtained from a thick iron target bombarded by parallel proton beams, the simplified geometry on which analytical methods are based. The neutron spectral fluence distributions were similar for both methods, with deeply penetrating high-energy neutrons (E > 10 MeV) being most prevalent along the beam central axis, and low-energy neutrons predominating the neutron spectral fluence in the lateral region. However, unlike the inverse square falloff used in conventional analytical methods, this study shows that the neutron dose equivalent per therapeutic dose in the treatment room decreased with distance approximately following a power law, with an exponent of about −1.63 in the lateral region and −1.73 in the downstream region. Based on the simulated data according to the detailed nozzle modeling, we developed an empirical equation to estimate the neutron dose equivalent at any location and distance in the treatment vault, e.g. for cases in which detailed Monte Carlo modeling is not feasible. We applied the simulated neutron spectral fluence and dose equivalent to a shielding calculation as an example.
1. Introduction
Proton beams exhibit a finite range, leading to dose distributions that deliver almost zero dose distal to the target volume (Wilson 1946). Currently, proton beams that use scattering systems are employed in most proton therapy units to laterally spread and flatten the beam. In a typical scattered beam treatment nozzle, protons pass through a rotating range modulator wheel to spread the proton dose in depth. The proton beam is conformed laterally to the target volume using a collimating aperture and in depth with a range compensator (Koehler et al 1975, 1977, Gottschalk et al 1991). As protons pass through or stop in these beam-shaping devices, a fraction of them undergo inelastic nuclear interactions that release high-energy neutrons. These neutrons are the principal concern in shielding a proton therapy vault due to their abundance and highly penetrating nature (NCRP 2003).
Analytical methods have been used in designing shielding for many proton therapy facilities, such as the Northeast Proton Therapy Center (NTPC) (Newhauser et al 2002b), the Proton Therapy Facility at the National Cancer Center in Korea (Kim et al 2005) and the Roberts Proton Therapy Center at the University of Pennsylvania facility (Avery et al 2008). The list is not exhaustive because neutron shielding calculations for many other proton facilities are not available in the open literature. The analytical methods are typically based on a simplified treatment unit and shielding vault geometry and rely on approximations to simplify the modeling of neutron production and transport. One analytical approach commonly used to calculate neutron attenuation in shielding walls was proposed by Moyer (1962) and subsequently tested by Tesch (1985) for use in shielding high-energy proton facilities. Moyer’s model includes terms to take into account neutron production and attenuation length in the shielding wall; these are typically based on limited experimental or calculated data obtained using parallel proton beams striking a copper or iron stopping target. While Moyer’s model provides an acceptable accuracy in some applications, its use in proton therapy shielding calculations leads to substantial uncertainties (Titt and Newhauser 2005). There are several sources of uncertainty in the analytical shielding calculations, including (1) approximations in the modeling of the treatment nozzle and its enclosure, (2) estimation of the number of protons required for a specified clinical workload, (3) calculation of the number and energy distribution of neutrons generated per proton, (4) evaluation of the neutron energy distribution as a function of emission angle, (5) calculation of the neutron dose equivalent as a function of location in the treatment room and (6) determination of the attenuation length of the shielding wall (e.g. concrete) as a function of angle. Cases in which the uncertainty is large have led to a substantial overestimation of the required neutron shielding (Newhauser et al 2002b, Titt and Newhauser 2005). In most cases, the analytical methods were conservative, although the degree of over-shielding has been highly variable. Under-prediction of the required shielding thickness is also possible, which would potentially pose safety issues or require administrative restrictions on the allowable clinical caseload of the facility. The large uncertainties notwithstanding, analytical models remain popular for neutron shielding calculations because of their simplicity and speed when compared with Monte Carlo simulations. Previous studies by Zheng et al (2007a, 2007b) suggest that it may be possible to reduce these uncertainties by developing more realistic models of neutron production rates for proton treatment units that use scattering systems and apertures to shape the fields.
Neutron production in the nozzle and neutron exposure for patients have been studied with both Monte Carlo methods and measurements (Agosteo et al 1998, Binns and Hough 1997, Fontenot et al 2008, Jiang et al 2005, Polf and Newhauser 2005, Polf et al 2005, Schneider et al 2002, Taddei et al 2008, 2009, Tayama et al 2006, Titt and Newhauser 2005, Wroe et al 2007, Yan et al 2002, Zheng et al 2007a, 2007b, 2008, Mesoloras et al 2006, Roy and Sandison 2004, Siebers et al 1992, Newhauser et al 2009). In previous studies (Mesoloras et al 2006, Zheng et al 2008, Newhauser et al 2002a, Yan et al 2002), it has been shown that neutron energy spectra vary with the location around the nozzle. Also, some studies have shown that the neutron dose equivalent as a function of the distance from the isocenter around the nozzle does not follow the inverse-square law (Polf et al 2005, Zheng et al 2007a, 2007b). How these findings apply to shielding design in other locations and extended distances, i.e. far from the patient, is unknown. Monte Carlo simulations have been used in some recent shielding calculations, either together with an analytical method or for verification purposes. Titt and Newhauser (2005) and Kim et al (2005) used Monte Carlo methods to verify some previous analytical shielding calculations with a simplified nozzle geometry, and Avery et al (2008) simulated the neutron spectra for a variety of target materials bombarded by protons. Detailed studies evaluating the neutron spectra and the neutron dose equivalent in a proton vault using a realistic nozzle and developing a more detailed understanding of its effect on shielding design are very few.
The purpose of this study was to calculate the neutron spectral fluence produced for a contemporary passive scattering proton treatment unit at various locations in the treatment vault using detailed Monte Carlo modeling of the nozzle system and to estimate the corresponding neutron dose equivalent and shielding requirements at various angles relative to the beam direction. In addition, we developed an analytical model to estimate the neutron dose equivalent at any location and distance in the treatment vault for cases in which detailed Monte Carlo modeling is not feasible.
2. Method and materials
2.1. MC nozzle modeling
The scattered proton therapy unit we simulated was manufactured by Hitachi America, Ltd (Brisbane, CA). Proton beams entering the nozzle may have energies of up to 250 MeV. By selecting different scattering foils according to tumor size, the proton beams may be scattered laterally to one of three field sizes—small, medium or large, corresponding to maximum uncollimated field diameters at the isocenter plane of 14.1 cm, 25.5 cm and 35.4 cm (Newhauser and Smith 2003). In this study, we only used proton beams of 250 MeV, the highest energy provided by this machine, because this energy produces the greatest number of neutrons (Zheng et al 2008). We selected to study only the medium field size; the most commonly used of the three field sizes available. We modeled the key components in the nozzle, including a range modulator wheel, scattering system, range shifter and aperture, as well as the local shielding in the nozzle. Each device was modeled in great detail so that approximations in its geometry would produce a negligible impact on simulation results. The downstream surface of the aperture was located 20 cm upstream of the isocenter. Modeling and simulations were performed for an unmodulated proton beam. Figure 1 shows a schematic diagram of the modeled nozzle and the layout of the modeled neutron receptors.
Figure 1.
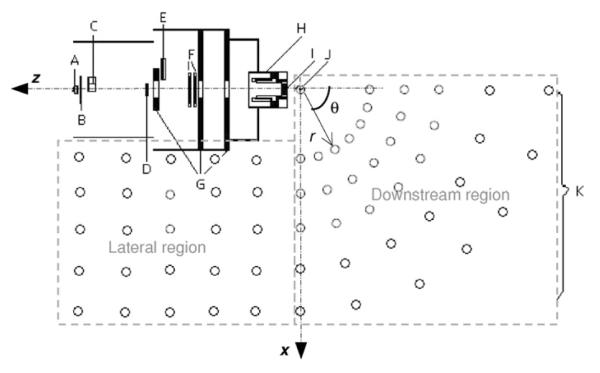
Monte Carlo model of a scattered treatment nozzle. The proton beams enter the nozzle from the left through a vacuum window (A), a beam profile monitor (B), a range-modulator wheel (C), a second scatterer (D), a range shifter assembly (E), backup and primary beam monitors (F), shielding plates (G), a snout (H), and a final collimator or aperture (I). The location of the isocenter is indicated by J. The open circles outside the nozzle represent neutron receptors (K). The position of the neutron receptor is determined by the distance from the isocenter (r) and the angle relative to the central axis (θ) in the downstream region, and the coordinates (x, z) in lateral regions, with the isocenter being the origin. The figure is not to scale.
We used the MCNPX Monte Carlo radiation transport code (version 2.6) (Pelowiz 2005) to simulate the proton therapy beam delivery system. MCNPX is a general-purpose code that can track most of the particles, including protons and neutrons. Its application in proton therapy simulations has been extensively benchmarked against measurements in proton therapy applications (Fontenot et al 2005, Herault et al 2005, Newhauser et al 2002b, Polf and Newhauser 2005, Polf et al 2005, Titt and Newhauser 2005, Tayama et al 2006, Giebeler et al 2009). The standard MCNPX nuclear interaction cross-section libraries (Chadwick et al 1999) were used for energies up to 150 MeV, and physics models (Bertini 1969, Yariv and Fraenkel 1979) were used to estimate hadronic cross-sections above 150 MeV. Both protons and neutrons were tracked in simulations. The cutoff energy for proton transport was 1 MeV. The neutron spectral fluence was tallied over each spherical air neutron receptor that was 12 cm in diameter. An in-house code was used to automatically generate MCNPX input files that model the proton treatment nozzles. More details on the nozzle and its modeling can be found in Zheng et al (2007a, 2006) and Newhauser et al (2008).
2.2. Neutron spectra and neutron dose equivalent
We simulated the spectral neutron fluences at various locations of the proton therapy vault, as shown in figure 1. We divided the room into two regions: (1) the downstream region, where the neutron receptors were located at angles (θ) 0, 15, 30, 45, 60, 75 and 90° relative to the beam axis and at selected distances (r) of up to 800 cm from the isocenter and (2) the lateral region, where neutron receptors were located at selected distances away (x) and along (z) from the central axis.
The fluence was tallied in 438 logarithmic energy bins for neutrons of energy up to 250 MeV. 5 × 10⁸ or 1 × 10⁹ protons were tracked per simulation to ensure that the statistical uncertainties for dose equivalent calculations were no more than 5%. Most of the fluence spectra and neutron ambient dose equivalent calculations were conducted for a nozzle with a closed aperture and without a phantom present. To verify that a closed aperture was a valid approximation of the clinical setting, we compared the results to those for separate simulations of a beam passing through a nozzle with an open aperture and then into a phantom, with all other parameters identical to those for the closed aperture setting. The phantom was a 30 × 30 × 30 cm3 water cube with its upstream surface located at the isocenter level.
Neutron spectral fluences were converted to the neutron dose equivalent using an in-house code and dose conversion factors from International Committee of Radiological Protection (ICRP) Publication 74 (1996). We used the ambient dose equivalent, H*(10), an operational quantity, for quantification of the neutron dose equivalent because it provides a conservative estimate of the equivalent dose, a protection quantity. This quantity is defined as the dose equivalent that would be produced by the corresponding expanded and aligned field in the International Commission on Radiation Units and Measurements (ICRU) sphere (30 cm in diameter) at a depth of 10 mm on the radius opposing the direction of the aligned field (ICRU 1985, ICRP 1991). For brevity of notation, we will denote H*(10) as H hereafter. H can be calculated as the product of the neutron spectral fluence, Φ, and the fluence-to-dose-equivalent conversion coefficient, H/Φ, which varies with the neutron energy and was taken from ICRP Publication 74 (1996). By summarizing the products of the neutron spectral fluence per incident proton, Φ/p and H/Φ over all energy bins, the neutron ambient dose equivalent per proton entering the nozzle, H/Φ, at each receptor location was calculated by using
| (1) |
where i and n are the index and the total number of neutron energy bins, respectively, and (H/Φ)i and Φi/p are the ambient dose equivalent per unit neutron fluence for neutrons and the neutron fluence per incident proton in the ith energy bin from the simulations, respectively.
The neutron ambient dose equivalent per therapeutic absorbed dose, H/D, was calculated by dividing the H/p value by the therapeutic absorbed dose (D/p) value, which was obtained at the location of the maximum absorbed depth dose in a water phantom along the central axis in a separate simulation, as previously described (Zheng et al 2007a).
2.3. Analytical fitting of neutron ambient dose equivalent distribution
Ideally, a simple analytical equation would be used to estimate neutron exposures at any location and distance for shielding calculations. Previous studies (Polf et al 2005, Zheng et al 2007a) have shown that a low-order power law function fits neutron ambient dose equivalent data quite well for locations downstream of the snout and around the nozzle. In this study, we tried to use a similar equation for extended distances up to 8 m and at locations in both the lateral and downstream regions. Since neutrons are produced in each component along the nozzle’s central axis, in the lateral region around the nozzle, we used a line source model to approximate the distributed neutron source and estimated the neutron ambient dose equivalent. At locations in the region downstream of the snout, the neutrons generated in the aperture and snout predominated the neutron ambient dose equivalent values. This is because neutrons from upstream components were partially shielded by the local shielding and/or downstream components, and the majority of neutrons were produced when a large portion of protons were stopped in the aperture and snout. Therefore, we modeled the ambient dose equivalent as a function of distance from a point located at the isocenter. For both the lateral and downstream regions, we used a power law equation to fit the simulated neutron ambient dose equivalent data:
| (2) |
where d is the distance from the isocenter (r in figure 1) for downstream region locations, and the distance away from the central axis (x in figure 1) for lateral region locations, (H/D)d0 is the neutron ambient dose equivalent per therapeutic proton dose at the reference distance d0 and α is the exponent governing the power law function.
Note that we simulated the H/D values for a completely closed aperture setting with unmodulated proton beams to make them independent of any patient-specific setting. To account for the influence of field size and spread-out Bragg peak (SOBP) width, we applied a field size correction factor, Cf, and an SOBP correction factor, Cm, to the above equation, following the methods proposed by Zheng et al (2007a). Therefore, the H/D value at the distance d for a field size of f and an SOBP width of m, (H/D)d,f,m, was estimated using
| (3) |
where f 0 and m0 are the aperture size and the modulation for a reference setup, respectively, i.e. a closed aperture and an unmodulated beam (pristine peak) in this study.
As identified in previous studies (Mesoloras et al 2006, Zheng et al 2007b, 2008), the dependence of the neutron dose equivalent on field size is weak, and neutron exposure typically decreases as field size increases. Also, our previous study (Zheng et al 2008) showed that the neutron dose equivalent per therapeutic dose almost doubles for an SOBP of 16 cm compared to a pristine peak. To be conservative and simplify the equation, we used Cf = 1 and Cm = 2 for all field sizes and modulation widths. To further simplify the equation, we used d0 = 1 m. Therefore, equation (3) became
| (4) |
where (H/D)0 is the neutron ambient dose equivalent per therapeutic absorbed dose at 1 m from the isocenter for a pristine peak with a closed aperture and d is the distance as previously defined measured in meters.
2.4. Comparison of MC and Moyer’s model
To compare with Moyer’s model, a simplified geometry was simulated. Neutron spectra and dose equivalent for each receptor were generated for an iron target bombarded by narrow parallel proton beams, the geometry assumed by Moyer’s model. The iron target was a cylinder 8 cm in height and 16 cm in diameter, similar to what was used by Tayama et al (2002). The iron target was located at the isocenter with the cylinder central axis aligned to the beam axis. The neutron receptors were distributed in the lateral and downstream regions in the same way as shown in figure 1, except that all nozzle components were removed. The neutron spectra and dose equivalent from the simplified geometry were compared to those from simulations using a detailed nozzle modeling.
2.5. Shielding calculation
Given a neutron spectral fluence Φ(En) and neutron ambient dose equivalent per therapeutic dose at any location (H/D)d, the neutron ambient dose equivalent at any distance d with a shielding wall of thickness t could be calculated by
| (5) |
where W is the workload and TVL is the equilibrium tenth-value layer of the material used for shielding. Note that TVL is a function of Φ(En), which varies with the location. Therefore, the value of TVL needs to be either calculated or simulated using the detailed neutron spectra shown in figure 2. Replacing Hd,t with the design aim (that is, the permissible dose equivalent limit) P in equation (5), the wall thickness t can be solved by
| (6) |
Note that equations (5) and (6) apply to a deep barrier penetration calculation. For thinner shielding barriers, separate TVL values may be used for the first and equilibrium tenth-value layers of the shielding material, following the approach given in NCRP Report 151 (2005). Also, neutrons from possible adjacent treatment rooms and proton transport devices are not considered here.
Figure 2.
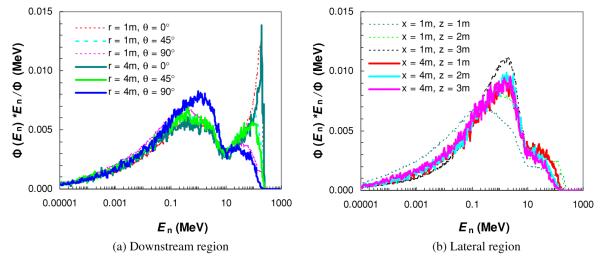
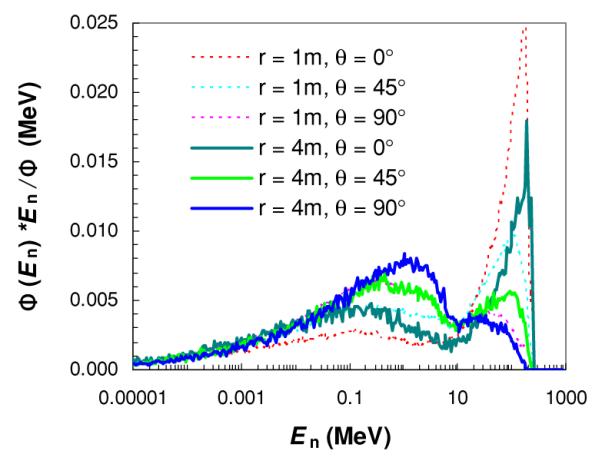
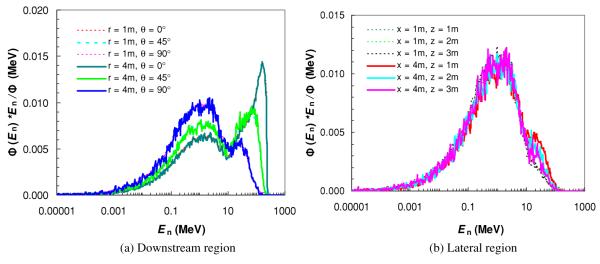
Neutron spectral fluence Φ(En) at selected angles θ and the distance to the isocenter r in the downstream region (a), and at selected distances away (x) and along (z) the central axis in the lateral region (b). Simulations were performed for a passively scattered proton beam of 25.5 cm diameter and 250 MeV proton energy at the nozzle entrance with a fully closed final collimator (aperture).
3. Results
3.1. Neutron spectral fluence
The neutron spectral fluences for the modeled proton therapy nozzle at selected locations are shown in figure 2. There were two pronounced peaks in the spectrum, a low-energy peak composed of isotropic neutrons produced by the evaporation processes and a high-energy peak composed of forward-peaked neutrons from intra-nuclear cascade reactions. For locations in the downstream region (figure 2(a)), the amplitude of the low-energy peak relative to the high-energy peak increased significantly with increasing angle relative to the central axis, but did not change much with distance from the isocenter. In the lateral region (figure 2(b)) and at locations close to the central axis (i.e. x = 1 m), the neutron spectra were similar in shape, but the high-energy peak decreased when moving from downstream (z = 1 m) to more upstream locations (z = 3 m). At a distance far away from the central axis (i.e. x = 4 m), the neutron spectra at along-axis locations in the lateral region were almost identical.
3.2. Neutron ambient dose equivalent
Table 1 shows the calculated neutron ambient dose equivalent values at selected locations in the treatment room based on Monte Carlo-simulated neutron spectral fluence. The neutron ambient dose equivalent fell off sharply with the distance away from the nozzle. Interestingly, when the distance to the nozzle (r) was constant in the downstream, we found that H/D values did not change much with angle. Similarly, for the constant off-axis distance (x) in the lateral region, the H/D value did not change with distance along the central axis (z). Because of differences in the shape of the neutron spectral fluence, shielding requirements at various locations could differ even when the neutron ambient dose equivalent rates in the room were similar. For example, at θ = 0° in the downstream region, the high-energy neutrons predominated; therefore, more shielding would be required than at other angles because high-energy neutrons have a greater TVL than low-energy neutrons. The simulated neutron ambient dose equivalent values at all locations are plotted in figure 3, interpolated to facilitate visualization.
Table 1.
Neutron ambient dose equivalent per delivered dose, H/D in mSv Gy−1, for a 25.5 cm diameter, 250 MeV proton beam at some of the evaluated locations with a closed aperture. r, θ, x and z are defined in figure 1.
| Lateral region |
Downstream region |
||||||
|---|---|---|---|---|---|---|---|
| x |
z
|
r |
θ
|
||||
| 1 m | 2 m | 3 m | 0° | 45° | 90° | ||
| 1 m | 1.28 | 1.43 | 1.35 | 1 m | 1.03 | 1.05 | 1.31 |
| 2 m | 0.49 | 0.48 | 0.39 | 2 m | 0.36 | 0.39 | 0.47 |
| 3 m | 0.24 | 0.25 | 0.18 | 3 m | 0.19 | 0.20 | 0.24 |
| 4 m | 0.15 | 0.15 | 0.10 | 4 m | 0.12 | 0.13 | 0.15 |
| 6 m | 0.06 | 0.06 | 0.06 | 6 m | 0.06 | 0.07 | 0.08 |
Figure 3.
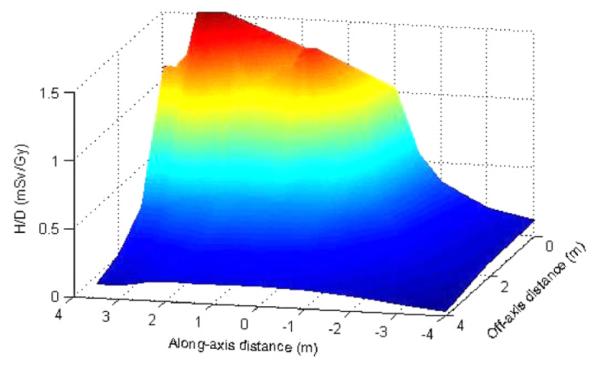
Neutron ambient dose equivalent per therapeutic absorbed dose (H/D) as a function of distance along the beam axis (z) and away from the beam axis (x). Interpolation was performed to facilitate visualization.
3.3. Analytic fitting of neutron ambient dose equivalent distribution
The low-order power-law expression in equation (2) was used to fit MC data at all angles in the downstream region and all along axis distances in the lateral region, respectively. The neutron ambient dose equivalent at any location in the treatment room generated by a 25.5 cm diameter, 250 MeV proton beam without range modulation (i.e. a pristine peak) could be estimated by
| (7) |
in the downstream region, or by
| (8) |
in the lateral region, where r and x are the distances (in m) from the isocenter or the central axis as previously defined (figure 1). Therefore, the H/D value was about 1.44 mSv Gy−1 at 1 m in the downstream region and 1.19 mSv Gy−1 in the lateral region. As indicated in equations (7) and (8), the H/D value decreased with distance, approximately following a power law with an exponent of −1.73 in the downstream region and −1.63 in the lateral region. As shown in figure 4, the analytical function fits the simulated data well, typically within 10% and with a maximum deviation of 27%. This level of agreement is quite good considering the simplicity of the analytical model and the large uncertainties in high-energy neutron dosimetry measurements and calculations. When we take the effect of field size and SOBP width into account in the shielding calculation, e.g. by applying the field size and modulation factors described earlier, a factor of 2 can be multiplied on the right-hand side of equations (7) and (8).
Figure 4.
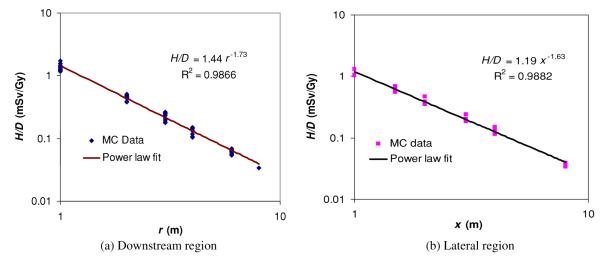
Neutron ambient dose equivalent per therapeutic absorbed dose (H/D) as a function of the distance to the isocenter, r, in the downstream region (a), and as a function of distance from the central axis for locations, x, in the lateral region (b). The dose falloff with distance approximately follows a power law, with an exponent of −1.73 in the downstream region and −1.63 in the lateral region. R is the correlation coefficient.
3.4. Comparison with water phantom simulations
We simulated neutron fluence spectra and ambient dose equivalents using an open aperture and a cubic water phantom and compared the results with those simulated in air with a closed aperture. Because a water phantom in the downstream region should have minimal effects on neutron exposure in the lateral region, we only examined effects on locations in the downstream region. As shown in figure 5, the neutron spectral fluences were quite similar to those obtained with a closed aperture (figure 2(a)); in both cases, two energy peaks occurred and the relative contributions of the high-energy peak and low-energy peak varied with an angle relative to the beam central axis. The main difference existed for the neutron fluence spectra immediately downstream of the water phantom (i.e. r = 1 m and θ = 0°); the amplitude of the low-energy peak was much lower than the corresponding neutron spectral fluence obtained in air with a closed aperture. This result is likely due to the water phantom preferentially absorbing the low-energy neutrons generated in the upstream nozzle.
Figure 5.
Neutron spectral fluence (Φ(En)) at selected angles (θ) and distances from the isocenter (r) in the downstream region. Simulations were performed with a 25.5 cm diameter, 250 MeV proton beam with an open 10 × 10 cm2 aperture irradiating a 30 × 30 × 30 cm3 water phantom.
The ratio of open to closed field neutron ambient dose equivalent values is shown in table 2. At locations immediately downstream of the water phantom, i.e. when θ is 0°, this ratio was nearly 0.5. The dose was reduced mainly because (1) water generates fewer neutrons than brass (ICRU 2000) and (2) the water tank serves as an effective shielding device against those neutrons generated in the nozzle. At locations away from the central axis in the downstream region, the neutron ambient dose equivalent is almost the same in the two cases. Therefore, our closed-aperture simulations are a good approximation of a more realistic phantom setting in most locations and are conservative in locations downstream of the water phantom, within a factor of about 2.
Table 2.
Ratio of H/D values determined with an open aperture of 10 × 10 cm2 and a water phantom present (H/Dwater) to those determined with a closed aperture and without a phantom present (H/Dair) for a 25.5 cm diameter, 250 MeV proto beam. r is the distance from the isocenter and θ is the angle with respect to the proton beam central axis as shown in figure 1.
|
H/Dwater/H/Dair |
|||
|---|---|---|---|
| r |
θ
|
||
| 0° | 45° | 90° | |
| 1 m | 0.52 | 0.68 | 0.90 |
| 2 m | 0.50 | 0.76 | 0.95 |
| 3 m | 0.50 | 0.78 | 0.96 |
| 4 m | 0.51 | 0.80 | 0.96 |
3.5. Comparison of MC and Moyer’s model
The simulated neutron fluence spectra around a thick iron target bombarded by a parallel proton beam is shown in figure 6 for selected locations. In the downstream region, the neutron fluence spectra almost overlapped for r = 1 m and r = 4 m for a common angle θ. This was expected because a point source approximation is valid for the simplified geometry. The shapes of the neutron spectra based on a thick iron target were quite similar to those based on the detailed nozzle modeling (figure 2(a)), except that the high-energy peak for θ = 45° was slightly greater in magnitude. In the lateral region, unlike the neutron spectra in figure 2(b), the iron-target neutron spectra (figure 6(b)) had almost the same shapes at all locations and the high-energy peaks were less pronounced.
Figure 6.
Neutron spectral fluence Φ(En) at various angles (θ) and distances to the isocenter (r) in the downstream region (a), and at various distances away (x) and along (z) the central axis in the lateral region (b). Simulations were performed for a thick iron target bombarded by a narrow proton beam of 250 MeV.
We also calculated the H/D values based on the simplified geometry and compared them to the results based on a detailed nozzle modeling. As shown in table 3, the H/D values based on a thick iron target were much greater in the beam direction in the downstream region (e.g. about 2.5 times higher for r = 4 m and θ = 0°), but less in the lateral region (e.g. about 40% lower when x = 4 m).
Table 3.
Ratio of H/D values determined with an iron target bombarded by a parallel 250 MeV proton beam to those determined with a closed aperture and a detailed nozzle modeling for a 25.5 cm diameter, 250 MeV proton beam. r, θ, x, and z are defined in figure 1.
| Lateral region |
Downstream region |
||||||
|---|---|---|---|---|---|---|---|
| x |
z
|
r |
θ
|
||||
| 1 m | 2 m | 3 m | 0° | 45° | 90° | ||
| 1 m | 0.69 | 0.26 | 0.14 | 1 m | 4.8 | 3.0 | 1.2 |
| 2 m | 0.67 | 0.47 | 0.36 | 2 m | 3.3 | 2.0 | 0.81 |
| 3 m | 0.66 | 0.51 | 0.55 | 3 m | 2.8 | 1.7 | 0.72 |
| 4 m | 0.64 | 0.54 | 0.66 | 4 m | 2.5 | 1.5 | 0.64 |
3.6. Shielding calculations
Using the methods described above, one may calculate the required shielding barrier of thickness t to attenuate the neutron ambient dose equivalent rate to a safe level using equation (6). An example was shown here for a situation in which we seek to calculate the required thickness of the shielding wall between the proton beam nozzle and the control room. The following assumptions were applied: the workload (W) was 20 000 Gy/year; the control room was in the lateral region of the proton beam nozzle and 6 m away from the central axis of the proton beam; and the material for the wall shielding was normal concrete with a density of 2.34 g cm−3. By simulating neutron attenuation through a concrete wall with an initial neutron spectral fluence taken from figure 2, we found that the attenuation length (TVL) for normal concrete was 78 cm. Also, based on the simulated data (table 2 or figure 3) or the analytical fitting equation, the neutron ambient dose equivalent (H/D) at 6 m was found to be 0.06 mSv Gy−1 for an unmodulated proton beam of 250 MeV and about 0.12 mSv Gy−1 for a modulated beam (assuming an SOBP factor of 2). The recommended design aim (P) for a controlled area, e.g. the control room, was 5 mSv/year according to NCRP Report 151 (NCRP 2005). According to equation (6), the thickness of the shielding wall should be
| (9) |
It should be noted that the value of the workload used in this example may not be representative of a specific proton therapy clinic. Accurate determinations of W values are expected to vary strongly with the design and implementation of the proton therapy clinic (Newhauser et al 2002b).
4. Discussion
We studied the neutron spectral fluence and neutron ambient dose equivalent at selected locations in a proton therapy room and examined how these data could be used in calculations of the required shielding barrier thickness. In the downstream region, the shape of the neutron spectral fluence changed rapidly with angle relative to the beam direction but changed little with the distance from the isocenter. High-energy neutron fluences, the main concern in shielding, were greatest along the beam central axis. In the lateral region, the shape of the neutron spectral fluence was found to be similar at all locations. In both the downstream and lateral regions, the neutron ambient dose equivalent per therapeutic absorbed dose in the treatment room decreased sharply with increasing distance, approximately following a power law. An empirical equation was developed to estimate the neutron ambient dose equivalent at an arbitrary location and distance in the treatment vault. An example was given to illustrate a method to use the simulated neutron spectral fluence and ambient dose equivalent results in a practical shielding calculation. The neutron fluence spectra and dose equivalent from a realistic nozzle were compared to those from a thick iron target bombarded by a parallel proton beam. While the shapes of neutron fluence spectra were similar in both cases, the thick iron target method significantly overestimated the neutron dose equivalent in the beam forward directions and underestimated in the lateral region.
The simulated neutron spectral fluence obtained here is consistent with those reported in previous studies (Yan et al 2002, Zheng et al 2008, Avery et al 2008). The results showed that the neutron ambient dose equivalent did not change much with angle relative to the central beam axis in the downstream region. This result is consistent with those in studies by Yan et al (2002) and Polf et al (2005); however, some analytical methods use a large factor to scale the 90° value to estimate the 0° value (e.g. a factor of 20 was used for the NPTC shielding design). The main reason for the much larger neutron dose at the 0° angle in the previous analytical method is that a thick copper or iron target with a parallel narrow proton beam was used, while in reality a broad proton beam interacts with the whole nozzle, which contains components all along the beam line composed of various materials. Also, this study shows that the neutron ambient dose equivalent decreases with distance following a power law, with an exponent of about −1.73 in the downstream region and −1.63 in the lateral region, which is consistent with previous studies by Polf et al (2005) and Zheng et al (2007a). However, conventional analytical methods typically assume an ideal point source and use an inverse square law to calculate the change of the neutron ambient dose equivalent as a function of distance. Since neutrons are generated in several components in the nozzle and in the patient, modeling H/D with a single point source and pure inverse square falloff is a first-order approximation. While it is possible to use multiple neutron point sources from some of the major components in the nozzle for better estimation, such modeling is relatively complicated because it needs to estimate neutron productions from each individual component, where protons may lose only part of their energy. Also, such modeling cannot take into consideration local shielding effects by other components of the nozzle. A simple analytical fit was derived based on simulations from a detailed nozzle model, which fit the simulated H/D values at various locations in the treatment room within an accuracy of 27%. The better accuracy was obtained by empirically estimating the value of the exponent, thereby approximately taking into account the distributed nature of the neutron sources.
Most of the neutron fluence spectra and ambient dose equivalent data presented here were based on simulations of a nozzle with a closed aperture and without a phantom present, which is different from a typical patient treatment, for which an open aperture is used. However, the results were compared with those from simulations of nozzles with an open aperture and a water phantom, with no significant difference except in the downstream region when angles relative to the central beam are small, where the neutron ambient dose equivalent with a closed aperture was typically conservative and within a factor of 2 of the phantom calculations. Furthermore, the closed-aperture method allows an estimation of the neutron dose exposures independent of patient-specific settings and devices such as range compensators and apertures, which differ from field to field. Also, only unmodulated proton beams were simulated in this study. When the SOBP width increases, more protons will interact with the range modulation wheel; therefore, more neutrons will be produced from the range modulation wheel. This change may increase the neutron exposure at locations close to the range modulation wheel in the lateral region. However, because the thinner steps of the range modulation wheel contribute most to the SOBP, the effect is expected to be relatively small.
In addition, no measurements were made specifically for this study to confirm the Monte Carlo estimates. However, the nozzle model has been validated with a wide range of measurements (Titt et al 2008), and simulations of the neutron dose equivalent have been verified by measurements carried out by other groups (Moyers et al 2008, Tayama et al 2006, Wroe et al 2007). Finally, it is noteworthy that the analytical model developed here reproduced H/D values specific to the Hitachi proton facility. We will be applying these techniques to other proton units to determine the accuracy of generalizing the model.
With many additional proton therapy facilities being planned and built, there is an urgent need for improved shielding calculation methods and data for application in future shielding designs. Preferably, Monte Carlo modeling and simulation should be used in shielding design when the detailed nozzle design is available. Compared to conventional analytical methods, which are based on a simplified geometry and rely on numerous assumptions, Monte Carlo methods can simulate the detailed proton source and nozzle geometry and therefore provide a more accurate neutron dose equivalent prediction. Also, the simulated neutron spectral fluence at selected locations can be used for accurate determination of attenuation length in shielding materials. Furthermore, we presented a relatively accurate analytical method to estimate the neutron ambient dose equivalent in shielding calculations in situations where detailed Monte Carlo modeling is not feasible.
References
- Agosteo S, Birattari C, Caravaggio M, Silari M, Tosi G. Secondary neutron and photon dose in proton therapy. Radiother. Oncol. 1998;48:293–305. doi: 10.1016/s0167-8140(98)00049-8. [DOI] [PubMed] [Google Scholar]
- Avery S, Ainsley C, Maughan R, McDonough J. Analytical shielding calculations for a proton therapy facility. Radiat. Prot. Dosim. 2008;131:167–79. doi: 10.1093/rpd/ncn136. [DOI] [PubMed] [Google Scholar]
- Bertini HW. Intranuclear-cascade calculation of the secondary nucleon spectra from nucleon-nucleus interactions in the energy range 340 to 2900 MeV and comparisons with experiment. Phys. Rev. 1969;188:1711–30. [Google Scholar]
- Binns PJ, Hough JH. Secondary dose exposures during 200 MeV proton therapy. Radiat. Prot. Dosim. 1997;70:441–4. [Google Scholar]
- Chadwick MB, et al. Cross-section evaluations to 150 MeV for accelerator-driven systems and implementation in MCNPX. Nucl. Sci. Eng. 1999;131:293–328. [Google Scholar]
- Fontenot J, Newhauser W, Titt U. Design tools for proton therapy nozzles based on the double-scattering technique. Radiat. Prot. Dosim. 2005;116:211–5. doi: 10.1093/rpd/nci229. [DOI] [PubMed] [Google Scholar]
- Fontenot J, Taddei P, Zheng Y, Mirkovic D, Jordan T, Newhauser W. Equivalent dose and effective dose from stray radiation during passively scattered proton radiotherapy for prostate cancer. Phys. Med. Biol. 2008;53:1677–88. doi: 10.1088/0031-9155/53/6/012. [DOI] [PubMed] [Google Scholar]
- Giebeler A, Fontenot J, Balter P, Ciangaru G, Zhu R, Newhauser W. Dose perturbations from implanted helical gold markers in proton therapy of prostate cancer. J. Appl. Clin. Med. Phys. 2009;10:63–70. doi: 10.1120/jacmp.v10i1.2875. [DOI] [PMC free article] [PubMed] [Google Scholar]
- Gottschalk B, Koehler A, Sisterson J, Wagner M. The case for passive beam spreading. Proc. of Proton Radiotherapy Workshop (Paul Scherrer Institute).1991. [Google Scholar]
- Herault J, Iborra N, Serrano B, Chauvel P. Monte Carlo simulation of a protontherapy platform devoted to ocular melanoma. Med. Phys. 2005;32:910–9. doi: 10.1118/1.1871392. [DOI] [PubMed] [Google Scholar]
- ICRP 1990 Recommendations of the International Commission on Radiological Protection. ICRP Publication 60 Ann. ICRP. 1991;21:1–201. [PubMed] [Google Scholar]
- ICRP Conversion Coefficients for Use in Radiological Protection Against External Radiation. ICRP Publication 74 Ann. ICRP. 1996;26:1–205. [PubMed] [Google Scholar]
- ICRU . ICRU Report 39. International Commission on Radiation Units and Measurements; Bethesda, MD: 1985. Determination of Dose Equivalents from External Radiation Sources. [Google Scholar]
- ICRU . ICRU Report 63. International Commission on Radiation Units and Measurements; Bethesda, MD: 2000. Nuclear Data for Neutron and Proton Radiotherapy and for Radiation Protection. [Google Scholar]
- Jiang H, Wang B, Xu XG, Suit HD, Paganetti H. Simulation of organ-specific patient effective dose due to secondary neutrons in proton radiation treatment. Phys. Med. Biol. 2005;50:4337–53. doi: 10.1088/0031-9155/50/18/007. [DOI] [PubMed] [Google Scholar]
- Kim JW, Kwon JW, Lee J. Design of radiation shielding for the proton therapy facility at the national cancer center in Korea. Radiat. Prot. Dosim. 2005;115:271–5. doi: 10.1093/rpd/nci153. [DOI] [PubMed] [Google Scholar]
- Koehler A, Schneider R, Sisterson J. Range modulators for protons and heavy ions. Nucl. Instrum. Methods. 1975;131:437–40. [Google Scholar]
- Koehler AM, Schneider RJ, Sisterson JM. Flattening of proton dose distributions for large-field radiotherapy. Med. Phys. 1977;4:297–301. doi: 10.1118/1.594317. [DOI] [PubMed] [Google Scholar]
- Mesoloras G, Sandison GA, Stewart RD, Farr JB, Hsi WC. Neutron scattered dose equivalent to a fetus from proton radiotherapy of the mother. Med. Phys. 2006;33:2479–90. doi: 10.1118/1.2207147. [DOI] [PubMed] [Google Scholar]
- Moyer B. Proc. of First Int. Conf. on Shielding, Around High-energy Accelerators. Press Universitaires de France, Paris; Saclay: 1962. Methods of Calculation of the Shielding Enclosure for the Berkeley Bevatron; pp. 65–70. [Google Scholar]
- Moyers MF, Benton ER, Ghebremedhin A, Coutrakon G. Leakage and scatter radiation from a double scattering based proton beamline. Med. Phys. 2008;35:128–44. doi: 10.1118/1.2805086. [DOI] [PubMed] [Google Scholar]
- NCRP . Report 144. National Council on Radiation Protection and Measurements; Bethesda, MD: 2003. Radiation Protection for Particle Accelerator Facilities. [Google Scholar]
- NCRP . Report 151. National Council on Radiation Protection and Measurements; Bethesda, MD: 2005. Structural Shielding Design and Evaluation from Megavoltage X- and Gamma-Ray Radiotherapy Facilities. [Google Scholar]
- Newhauser W, Burns J, Smith A. Dosimetry for ocular proton beam therapy at the Harvard Cyclotron Laboratory based on the ICRU Report 59. Med. Phys. 2002a;29:1953–61. doi: 10.1118/1.1487425. [DOI] [PubMed] [Google Scholar]
- Newhauser W, Titt U, Dexheimer D, Yan X, Nill S. Neutron shielding verification measurements and simulations for a 235-MeV proton therapy center. Nucl. Instrum. Methods A. 2002b;476:80–4. [Google Scholar]
- Newhauser WD, et al. The risk of developing a second cancer after receiving craniospinal proton irradiation. Phys. Med. Biol. 2009;54:2277–91. doi: 10.1088/0031-9155/54/8/002. [DOI] [PMC free article] [PubMed] [Google Scholar]
- Newhauser WD, Zheng Y, Taddei P, Mirkovic D, Fontenot JD, Giebeler A, Zhang R, Titt U, Mohan R. Monte Carlo proton treatment planning calculations. Trans. Am. Nucl. Soc. 2008;99:63–4. [Google Scholar]
- Newhauser WD, Smith AR. Scope of work and specifications for the proton treatment planning system and the associated interfaces for the Proton Therapy Center-Houston. The University of Texas MD Anderson Cancer Center; Houston: 2003. [Google Scholar]
- Pelowiz DBE. MCNPX User’s Manual. (Version 2.50) 2005 LA-CP-05-0369. [Google Scholar]
- Polf JC, Newhauser WD. Calculations of neutron dose equivalent exposures from range-modulated proton therapy beams. Phys. Med. Biol. 2005;50:3859–73. doi: 10.1088/0031-9155/50/16/014. [DOI] [PubMed] [Google Scholar]
- Polf JC, Newhauser WD, Titt U. Patient neutron dose equivalent exposures outside of the proton therapy treatment field. Radiat. Prot. Dosim. 2005;115:154–8. doi: 10.1093/rpd/nci264. [DOI] [PubMed] [Google Scholar]
- Roy SC, Sandison GA. Scattered neutron dose equivalent to a fetus from proton therapy of the mother. Radiat. Phys. Chem. 2004;71:997–8. [Google Scholar]
- Schneider U, Agosteo S, Pedroni E, Besserer J. Secondary neutron dose during proton therapy using spot scanning. Int. J. Radiat. Oncol. Biol. Phys. 2002;53:244–51. doi: 10.1016/s0360-3016(01)02826-7. [DOI] [PubMed] [Google Scholar]
- Siebers JV, DeLuca PM, Pearson DW, Coutrakon G. Measurement of neutron dose equivalent and penetration in concrete for 230 MeV proton bombardment of Al, Fe, and Pb targets. Radiat. Prot. Dosim. 1992;44:247. [Google Scholar]
- Taddei PJ, Fontenot JD, Zheng Y, Mirkovic D, Lee AK, Titt U, Newhauser WD. Reducing stray radiation dose to patients receiving passively scattered proton radiotherapy for prostate cancer. Phys. Med. Biol. 2008;53:2131–47. doi: 10.1088/0031-9155/53/8/009. [DOI] [PMC free article] [PubMed] [Google Scholar]
- Taddei PJ, Mirkovic D, Fontenot JD, Giebeler A, Zheng Y, Titt U, Woo S, Newhauser WD. Reducing stray radiation dose for a pediatric patient receiving proton craniospinal irradiation. Nucl. Technol. 2009;168:108–12. doi: 10.13182/nt09-a9108. [DOI] [PMC free article] [PubMed] [Google Scholar]
- Tayama R, Fujita Y, Tadokoro M, Fujimaki H, Sakae T, Terunuma T. Measurement of neutron dose distribution for a passive scattering nozzle at the Proton Medical Research Center (PMRC) Nucl. Instrum. Methods A. 2006;564:532–6. [Google Scholar]
- Tayama R, Handa H, Hayashi K, Nakano H, Sasamoto N, Nakashma H, Masukawa F. Benchmark calculations of neutron yields and dose equivalent from thick iron target for 52–256 MeV protons. Nucl. Eng. Des. 2002;213:119–31. [Google Scholar]
- Tesch K. Simple estimation of the lateral shielding for proton accelerators in the energy range 50 to 1000 MeV. Radiat. Prot. Dosim. 1985;11:165–72. [Google Scholar]
- Titt U, Newhauser WD. Neutron shielding calculations in a proton therapy facility based on Monte Carlo simulations and analytical models: criterion for selecting the method of choice. Radiat. Prot. Dosim. 2005;115:144–8. doi: 10.1093/rpd/nci252. [DOI] [PubMed] [Google Scholar]
- Titt U, Sahoo N, Ding X, Zheng Y, Newhauser WD, Zhu XR, Polf JC, Gillin MT, Mohan R. Assessment of the accuracy of an MCNPX-based Monte Carlo simulation model for predicting three-dimensional absorbed dose distributions. Phys. Med. Biol. 2008;53:4455–70. doi: 10.1088/0031-9155/53/16/016. [DOI] [PMC free article] [PubMed] [Google Scholar]
- Wilson R. Radiological use of fast protons. Radiology. 1946;47:487–91. doi: 10.1148/47.5.487. [DOI] [PubMed] [Google Scholar]
- Wroe AJ, Rosenfeld AB, Schulte R. Out-of-field dose equivalents delivered by proton therapy of prostate cancer. Med. Phys. 2007;34:3449–56. doi: 10.1118/1.2759839. [DOI] [PubMed] [Google Scholar]
- Yan X, Titt U, Koehler AM, Newhauser WD. Measurement of neutron dose equivalent to proton therapy patients outside of the proton radiation field. Nucl. Instrum. Methods A. 2002;476:429–34. [Google Scholar]
- Yariv Y, Fraenkel Z. Intranuclear cascade calculation of high-energy heavy-ion interactions. Phys. Rev. C. 1979;20:2227–43. [Google Scholar]
- Zheng Y, Fontenot J, Taddei P, Mirkovic D, Newhauser W. Monte Carlo simulations of neutron spectral fluence, radiation weighting factor and ambient dose equivalent for a passively scattered proton therapy unit. Phys. Med. Biol. 2008;53:187–201. doi: 10.1088/0031-9155/53/1/013. [DOI] [PubMed] [Google Scholar]
- Zheng Y, Newhauser W, Fontenot J, Taddei P, Mohan R. Monte Carlo study of neutron dose equivalent during passive scattering proton therapy. Phys. Med. Biol. 2007a;52:4481–96. doi: 10.1088/0031-9155/52/15/008. [DOI] [PubMed] [Google Scholar]
- Zheng Y, Newhauser WD, Fontenot J, Koch N, Moham R. Monte Carlo simulations of stray neutron radiation exposures in proton therapy. J. Nucl. Mater. 2007b:289–97. [Google Scholar]
- Zheng Y, Newhauser WD, Fontenot JD, Koch NC. Development of a code system to automatically generate MCNPX input files for proton therapy simulations. American Nuclear Society’s 14th Biennial Topical Meeting of the Radiation Protection and Shielding Division; Carlsbad, NM. 2006. [Google Scholar]