

Abstract
Histopathological studies in Alzheimer's disease (AD) suggest severe and region-specific neurodegeneration of the basal forebrain cholinergic system (BFCS). Here, we studied the between-center reliability and diagnostic accuracy of MRI-based BFCS volumetry in a large multicenter data set, including participants with prodromal (n = 41) or clinically manifest AD (n = 134) and 148 cognitively healthy controls. Atrophy was determined using voxel-based and region-of-interest based analyses of high-dimensionally normalized MRI scans using a newly created map of the BFCS based on postmortem in cranio MRI and histology. The AD group showed significant volume reductions of all subregions of the BFCS, which were most pronounced in the posterior nucleus basalis Meynert (NbM). The mild cognitive impairment-AD group showed pronounced volume reductions in the posterior NbM, but preserved volumes of anterior-medial regions. Diagnostic accuracy of posterior NbM volume was superior to hippocampus volume in both groups, despite higher multicenter variability of the BFCS measurements. The data of our study suggest that BFCS morphometry may provide an emerging biomarker in AD.
Keywords: Atrophy, biomarker, cholinergic system, dementia, European DTI Study on Dementia
Introduction
Postmortem brain studies show a significant reduction in markers of cholinergic function in the neocortex of patients with Alzheimer's disease (AD) compared to cognitively healthy controls (HC) [1–4]. A key role of cholinergic transmission in explaining cognitive impairment in AD is supported by the effect of anticholinergic pharmacological treatment on working memory and attention in HC [5]. The main cholinergic input to the cerebral cortex arises from the basal fore brain cholinergic system (BFCS) [6], consisting of the nucleus basalis Meynert (NbM) [7–9], the horizontal and vertical limb of the diagonal band of Broca [10], the nucleus subputaminalis (nucleus Ayala) [11], and a small pericommisural cluster of cholinergic perikarya (juxta-commisural cells).
Cholinergic nuclei appear to be particularly vulnerable to neurofibrillary pathology and amyloid-β accumulation [12–17]. Consistently, postmortem pathological studies of the basal forebrain in AD dementia patients have revealed a significant loss of cholinergic neurons, consistent with the cholinergic deficit in the neocortex [18]. In pre-dementia stages of AD like in mild cognitive impairment (MCI-AD), cholinergic dysfunction is present in the neocortex [19], but the role of neuron loss versus neuronal shrinkage in the BFCS is still unresolved [20].
The importance of cholinergic degeneration in AD has fueled efforts to determine the integrity of the BFCS in vivo using magnetic resonance imaging (MRI). Manual measurement of the thickness of the substantia innominata on a coronal section at the level of the anterior commissure suggests atrophy of this region in AD patients compared to HC [21–23], and this finding correlates with global cognitive impairment [23, 24]. This observation was reproduced using automated calculation of grey matter (GM) volume in a similarly defined region-of-interest (ROI) ventral to the anterior commissure [25]. However, these simple structural measures of anterior parts of the basal forebrain cover only a small part of the entire BFCS. Therefore, more detailed volumetric analysis of the BFCS has been developed based on maps of the basal forebrain nuclei in MRI standard space derived from postmortem MRI and histology data [26–28]. Using this approach, several studies reported significant reductions of BFCS volume in AD dementia compared to controls. These changes are mainly located in areas corresponding to the anterior lateral, anterior medial, and the posterior parts of the NbM, corresponding to the Ch4al, Ch4am, and Ch4p regions according to Mesulam's nomenclature [27, 29, 30].
BFSC morphometry in patients with MCI has documented atrophy in similar areas to those see in patients with AD dementia, albeit spatially more restricted [27, 31, 32]. Using a probabilistic map of the BFCS [28], it has been shown that subregional volumes of the cholinergic nuclei are differentially associated with global cognition and specific memory function in MCI patients. A significant volume reduction is found when compared to HC but appears restricted to posterior areas of the NbM [30].
In a recent single center study, the diagnostic use of BFCS volumetry appeared to be comparable to the diagnostic use of hippocampus volume, the most established structural imaging marker of AD to date [29]. Establishing BFCS volumetry as a potential future diagnostic marker requires demonstrating its stability and diagnostic accuracy in a multicenter setting. In the present study, we aimed to determine stability and diagnostic accuracy of BFCS volumetry in a large multicenter study on AD dementia and prodromal AD (MCI-AD), encompassing ten different MRI scanners across eight European sites. We used a newly created mask of BFCS subregions derived from histological sections and postmortem in cranio MRI to determine differential atrophy and diagnostic accuracy of BFCS subregions. An overview of the subregions of the BFCS mask in Montreal Neurological Institute (MNI) space can be seen in Supplementary Figure 1.
Material and Methods
Participants
Data sets of 323 participants from the European DTI Study in Dementia (EDSD) were analyzed. The EDSD is a newly established framework of nine European centers for clinical dementia research including Amsterdam (The Netherlands), Brescia (Italy), Dublin (Ireland), Frankfurt (Germany), Freiburg (Germany), Milano (Italy), Mainz (Germany), Munich (Germany), and Rostock (Germany). According to the Declaration of Helsinki, written informed consent was provided by all participants or their representatives and the study was approved by local ethics committees at each of the participating centers. Anatomical MRI scans from 134 patients with a diagnosis of clinically probable AD according to NINCDS-ADRDA criteria and 148 elderly cognitively HC were derived from eight centers, representing ten different MRI scanners (two center with two different MRI scanners) [33]. Additionally, 41 participants (from three centers) with MCI-AD were included in the study. We employed a scanner-matched subset of the cognitively HC for the AD group analysis (HC I; n = 138) and a scanner- and aged-matched subset (HC II; n = 42) for the MCI-AD group analysis. The number of participants per scanner varied from 13 to 46 with a median of 29. MCI-AD participants met the Petersen criteria for MCI and had objective cognitive impairment (above −1.5 standard deviation in the age and education years controlled Consortium to Establish a Registry of Alzheimer's Disease (CERAD) testing battery) without dementia and either pathological levels of tau, phospho-tau, or amyloid-β in cerebrospinal fluid (CSF) analysis [34]. 26 participants of this group fulfilled criteria for the diagnosis of MCI due to AD with a high degree of certainty according to the National Institute on Aging-Alzheimer's Association (NIA-AA) workgroups on diagnostic guidelines for AD (increased CSF levels of total-tau and phospho-tau levels and decreased amyloid-(3 1-42 levels) [35]. The remaining 15 participants fulfilling core clinical criteria of MCI according to the NIA-AA workgroups on diagnostic guidelines for AD [35] and had either increased total-tau and increased phospho-tau and normal or decreased levels of amyloid-β 1-42 and normal levels of total-tau and phospho-tau. Beside the diagnosis of AD or MCI-AD, participants were free of any signs of neurological, psychiatric, or any medical conditions that may have interfered with cognition. In particular, there were no clinical or neuroimaging signs for cerebrovascular apoplexy, depression, or drug abuse and no clinical or blood testing signs for hypothyroidism.
The Mini-Mental State Exam (MMSE) and CERAD cognitive battery were used to assess the level of cognitive functioning [36, 37]. HC were required to score within one standard deviation of age and education adjusted norm in all subtest of the CERAD battery. Demographic characteristics are shown in Table 1. AD patients had significantly less years of education and were older than the control group participants. As it was to be expected, MMSE scores were significantly lower in patients with AD compared to HC.
Table 1. Participants' characteristics.
| AD | HC I | MCI | HC II | |
|---|---|---|---|---|
| No. of participants (women) | 134 (76)1 | 138 (69) | 41 (17)5 | 42 (18) |
| Age (SD) in years | 72.5 (8.3)2 | 69.2 (5.9) | 70.5 (6.4)6 | 70.0 (5.2) |
| MMSE (SD) | 20.7 (5.4)3 | 28.8 (1.1) | 25.7 (4.4)7 | 28.7 (1.1) |
| Years of education (SD) | 10.2 (3.4)4 | 13.1 (3.8) | 12.1 (2.9)8 | 13.0 (3.1) |
AD, Alzheimer's disease; HC I, cognitively healthy control group I (matched to AD group); MCI, (mild cognitive impairment); HC II, cognitively healthy control group II (matched to MCI group); MMSE, Mini-Mental State Exam;
not significantly different between groups, χ2 = 1.23, 1 df, p = 0.27;
significantly different between groups, T = 3.81, 270 df, p < 0.001;
significantly different between groups, Mann-Whitney-U=263, p < 0.001;
significantly different between groups, T = −6.7, 270 df, p < 0.001;
not significantly different between groups, χ2 = 0.017, 1 df, p = 0.90;
not significantly different between groups, T= −0.40, 81 df, p = 0.83;
significantly different between groups, Mann-Whitney-U = 170, p< 0.001;
not significantly different between groups, T = 1.25, 81 df, p = 0.215.
MCI-AD participants scored significantly less in MMSE compared to HC. Age, years of education, and gender did not significantly differ between groups.
Postmortem Brain
The delineation and identification of the BFCS nuclei and its subregions followed the Mesulam nomenclature [38]. The transfer to MRI reference space was based on histological serial staining of a postmortem brain of a non-demented 56-year old man who died from myocardial infarction. Clinicofunctional structured evaluation was obtained from an informant by a trained nurse using a standardized and validated questionnaire. The review of the data involved a behavioral neurologist and two geriatricians and revealed no cognitive decline or psychiatric illnesses prior to death [39]. After scanning the brain in cranio (15 h postmortem) on a 3T MRI scanner (Philips Achieva) at the Radiologic Institute of Sao Paulo Medical School, the brain was removed from the skull and stored in formalin fixation (1 : 9) for three months. A second scan was done after this time period and did not reveal any pathological findings.
After the second scan was performed, the brain was stored in upgrading series of ethanol solutions. A third MRI scan was performed on the dehydrated brain on a 3T MRI scanner (Siemens Magnetom Verio). Afterwards the rostral parts anterior to the anterior horn and the dorsal parts of the frontal/parietal lobes of the brain were severed and the remaining parts of both hemispheres with the attached brainstem and the cerebellum were soaked in an 8% solution of celloidin. The tissue block was subjected to a slight vacuum in order to accelerate the concentration of celloidin from 8% to 16%. Chloroform vapors were used to harden the celloidin block before immersing it into a solution of 70% alcohol. Serial cutting in the coronal plane of the block was done at a thickness of 400 μm using a sliding microtome (Polycut, Cambridge Instruments, UK). Digital pictures of each newly appearing block surface were taken during sliding process using a digital single lens-reflex camera. More details on this process are described elsewhere [40, 41]. To identify and delineate cholinergic perikarya, celloidin sections were subsequently stained by a modified gallocyanin technique [42].
All parts of this procedure were approved by the Ethics committees of the Medical School of the University of Sao Paulo, Sao Paulo, Brazil, and the Medical Faculty of the University of Würzburg, Würzburg, Germany.
MRI Acquisition in vivo
The MRI acquisition was part of the European DTI Study on Dementia (EDSD). Data were obtained from ten different MRI scanners, including seven 3.0 Tesla and three 1.5 Tesla scanners. A sagittal high-resolution 3-dimensional gradient-echo sequence was performed for the anatomical studies with an isotropic spatial resolution of 1 mm3. In addition axial 2-dimensional T2-weighted sequences were performed to identify white matter lesions (fluid attenuation inversion recovery (FLAIR)). The exact imaging parameters for each scanner are described in Supplementary Table 1.
Postmortem MRI Scans
The postmortem scan in cranio and the scan of the formalin-fixed brain were performed on a 3.0 T MRI scanner (Achieva, Philips Medical Systems, Best, The Netherlands) using an eight channel head coil. For the anatomic study a sagittal 3-dimensional T1 Fast field echo (FFE) sequence with a spatial resolution of 1.0 × 1.0 × 1.0 mm3 (Field of view (FOV) 240 mm) was used (repetition time 7 ms, echo time 3.2 ms, flip angle 8°, number of slices 180).
The scan of the dehydrated brain was performed on a 3.0 T MR scanner (Magnetom Verio, Siemens Medical Solutions, Erlangen, Germany) using a sagittal high resolution, 3-dimensional gradient-echo sequence with a spatial resolution of 1.0 × 1.0 × 1.0 mm3 (MPRAGE, repetition time 2500 ms, echo time 4.81 ms, inversion time 1100 ms, flip angle 8°, number of slices 200). The brain was placed in an eight channel knee coil for scanning.
MRI Data Processing
Postmortem mapping of BFCS nuclei
The BFCS map was processed as shown in Fig. 1. Most parts of the magnocellular nuclei of the BFCS are located in the substantia innominata, ventral to the anterior commisure. The ventral pallidum and parts of the nucleus accumbens are located in the rostral substantia innominata, The caudal parts of the substantia innominata are occupied by the extended amygdala. We used the Mesulam nomenclature for subregions of the BFCS [6, 43]. The nuclei of the BFCS and their subregions were identified from the digital images of the histological sections and manually transferred into the corresponding slices of the MRI scan of the dehydrated brain. The MRI scan of the dehydrated brain was then transformed into the space of the postmortem in cranio scan using an initial 12-parameter affine transformation followed by a high-dimensional nonlinear registration [44] implemented in SPM8 software (Wellcome Trust Center for Neuroimaging). Next, the postmortem in cranio MRI was transferred into MNI standard space using the high-dimensional DARTEL (Diffeomorphic Anatomic Registration using Exponentiated Lie algebra) registration method [45]. The linear and non-linear transformations from alcohol through in cranio to MNI space were combined to spatially transform the basal forebrain mask into the MNI standard space. We used this map (i) to relate the voxel-wise group effects in local GM reduction to the anatomical position of the BFCS nuclei in MNI space and (ii) to automatically extract individual GM volumes for each BFCS subregion.
Fig. 1.

Postmortem MRI processing. Identification of the basal forebrain cholinergic system subregions. The upper part of the figure shows the postmortem processing with MRI scans of the brain in cranio and after formalin fixation. Afterwards the subregions were identified by histological staining and manually transferred into the MRI of the dehydrated brain in the alcohol space (color-coded mask at the lowest row of the figure). MRI scans were transferred first into the MRI space of the in cranio scan and then into MNI standard space. The combined transformation matrices were used to transfer the BFCS mask from alcohol space to MNI space via MRI in cranio space.
In vivo MRI data processing
For spatial normalization, the VBM8 toolbox (Version 414, http://dbm.neuro.uni-jena.de/vbm8/) implemented in SPM8 was used to create a customized DARTEL template. For better accuracy and quality of segmentation and to avoid favoring of one specific scanner in normalization and segmentation, we used a random subsample of n = 54 images, with the restriction to include scans from exactly 3 AD patients and 3 HC from 9 scanners [46]. The template was used for high-dimensional DARTEL normalization of the MPRAGE scans as implemented in VBM8. The images were segmented into GM and white matter and transformed to MNI space applying modulation for non-linear components only, thus accounting for global differences in head size and shape at this processing step. The GM segments were smoothed with a 4mm FWHM kernel for voxel-based analysis, considering the small size of the BFCS and previous experience in independent samples [27, 29, 30].
Volumes of BFCS nuclei and hippocampus
Individual GM volumes of the BFCS nuclei and the hippocampus were extracted automatically from the warped unsmoothed GM segments by summing up the modulated GM voxel values within ROI masks of the BFCS nuclei and the hippocampus, respectively.
The ROI mask for the hippocampus in MNI space was obtained by manual delineation of the hippocampus in the customized DARTEL template using the interactive software package Display (McConnell Brain Imaging Centre at the Montreal Neurological Institute) and a previously described protocol for segmentation of the medial temporal lobe [47].
Statistical analysis
We used voxel-based morphometry implemented in SPM8 to calculate the linear effect of diagnosis on voxel-wise volume. The search region was restricted to the BFCS mask and a FDR (false discovery rate) corrected statistical threshold of p < 0.05 and a cluster extension threshold of 5 voxels were applied.
In the ROI analysis, we determined the overall effect of BFCS atrophy using repeated measures ANOVA with diagnosis as between participants factor, age, gender, and years of education as covariates, scanner as co-factor and BFCS subregions as within participants factor. A significant overall effect of diagnosis was followed-up by pairwise linear models for each subregion controlling for age, education, gender, and scanner. The same parameters were applied to the comparison of hippocampus volumes between groups. We used receiver operating characteristics (ROC) analysis to determine the diagnostic accuracy of hippocampus and subregional BFCS volumes and compared the areas under the curves (AUCs) of different BFCS subregions and the hippocampus using a univariate binominal model implemented in ROCKIT software (Kurt Rossmann Laboratories, Chicago, Illinois) [48].
We employed variance component analysis to determine the effect of scanner on GM volumes. We determined the proportion of variance attributable to scanner relative to the variance attributable to scanner and error combined.
The ROI-based analyses were performed using SPSS 15.0 (IBM SPSS, Chicago, IL, USA), the variance component analysis was calculated using Proc Varcomp in SAS 9.2 (SAS, Cary, NC, USA).
Results
AD dementia participants
Using voxel-based analysis, we found significantly reduced volume in AD affecting virtually all cholinergic nuclei of the BFCS, including the vertical and horizontal limbs of the diagonal band, anterior medial and lateral, intermediate and posterior parts of the NbM as well as the nucleus subputaminalis (Fig. 2A). These findings remained significant after controlling for age, years of education, and gender as covariate and scanner as factor.
Fig. 2.

Volumetric changes projected onto the BFCS mask. Coronal section through the basal forebrain show the mask of the cholinergic basal forebrain in MNI space. The numbers on multislice line on top show the y-coordinate in MNI space (anterior to posterior position of the section). Red voxels show significant volume reduction in AD/MCI-AD group compared to HC (bright red areas show high T-values). Green voxels represent subregions or parts of subregions without significant reduction. (A: AD dementia compared to HC I; B: MCI-AD compared to HC II; p < 0.05 FDR corrected).
In the complementary ROI analysis, repeated measures ANOVA, controlling for age, gender, and scanner, revealed a significant overall effect of diagnosis across BFCS subregions ( , p < 0.0001). Pairwise follow-up analysis, controlling for age, years of education, gender, and scanner, showed volume reductions in patients with AD compared to controls in the hippocampus and in all subregions of the BFCS at p < 0.001 (Fig. 3A).
Fig. 3.
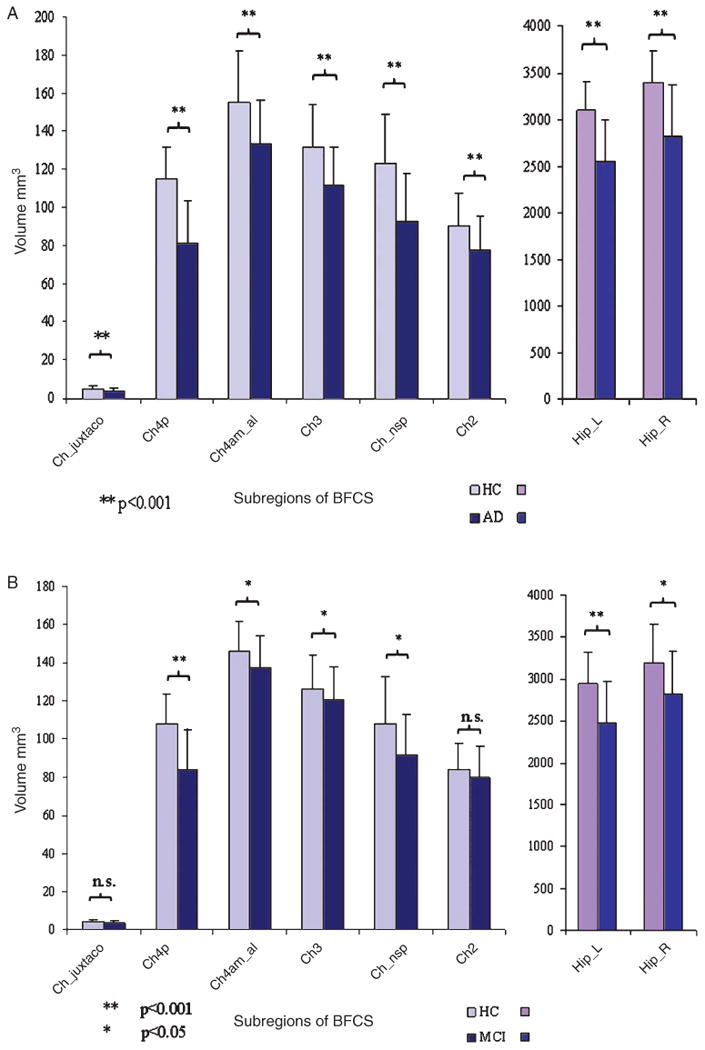
Bar diagram of BFCS and hippocampus volumes between AD and HC groups. Mean value of hippocampus and BFCS volumes in HC and AD/MCI-AD with error bars indicating standard deviation (data adjusted for head size). (A: AD dementia compared to HC I; B: MCI-AD compared to HC II).
The areas under the ROC curves (AUC) differed significantly between subregions of the BFCS. The region projecting to localization of Ch4p showed the highest value with 0.88 (95% confidence interval (CI): 0.84–0.92) followed by the nucleus subputaminalis (0.80, 95% CI: 0.75–0.85) and the Ch3 (0.75, 95% CI: 0.70–0.81). The region corresponding to the localization of Ch2 showed the smallest AUC with a value of 0.70 (95% CI: 0.63–0.76). By contrast the hippocampal volume (bilaterally) yielded an AUC of 0.84 (95% CI: 0.78–0.88). Compared to the BFCS subregion with the highest AUC (Ch4p), AUCs of the other BFCS sub-regions as well as the hippocampus were significantly smaller (p < 0.001, for the BFCS subregions; p = 0.005 for hippocampus).
The contribution of scanner to the variance of the data was estimated as , with vc = variance component, and ranged from 0.17 for Ch4p to 0.49 for the region projecting to the localization of Ch2. For comparison, the contribution of scanner to the variance of hippocampus volume was 0.08 for the left and 0.11 for the right hippocampus in this model.
MCI-AD participants
Voxel-based analysis showed significant clusters of reduced volume in posterior and anterior lateral parts of the BFCS, whereas anterior-medial regions appeared relatively spared (Fig. 2B).
Complimentary ROI analysis revealed statistically significant volume reductions of all BFCS subregions with the exception of the region projecting to the localization of the Ch2 nucleus and the juxta-commisural cell cluster (Fig. 3B). Repeated measurements ANOVA controlled for age, gender, education, and scanner showed a significant overall effect for diagnosis ( , p < 0.0001).
ROC analysis for the separation between MCI-AD and HC revealed a similar pattern of subregion-specific AUC values as for the classification of AD patients. The region corresponding to the Ch4p nucleus showed the highest value with an AUC of 0.86 (95% CI: 0.77–0.93), followed by N. subputaminalis with an AUC of 0.69 (95% CI: 0.57–0.79) and Ch4am_al (0.68; 95% CI: 0.56–0.78). All other regions showed only modest group separation with AUC values of 0.63 or below. Pair-wise comparisons showed that AUC of Ch4p was significantly higher than AUC of the other BFCS subregions (p < 0.001 for all subregions, except Ch4am al; p = 0.002). The diagnostic accuracy of bilateral hippocampus volume (AUC = 0.77, 95% CI: 0.66–0.86) was lower than the value of Ch4p region. This difference was statistically significant (p = 0.03).
Discussion
In the present study, we examined atrophy of the BFCS in patients with AD using a newly created sub region specific map of the BFCS, based on postmortem MRI in cranio, in a large multicenter data set. In accordance with previous monocentric studies, we found significant volume reductions of all areas projecting to the location of BFCS subnuclei in patients with preclinical and clinical manifest AD compared to HC, which was most pronounced in the posterior NbM [27, 29, 30, 32]. In the pre-dementia stage of AD, the area corresponding to the location of Ch4p showed a similarly high volume reduction compared to age-matched controls, whereas the region of the anterior Ch2 nucleus was relatively spared. The diagnostic accuracy of basal forebrain volumetry measured by ROC analysis varied among subregions and yielded AUCs between 0.88 for Ch4p and 0.70 for Ch2 in the AD group. ROC based classification of the MCI-AD group showed a similar pattern of region-specific AUC values; group separation being most accurate for Ch4p region. The diagnostic accuracy of Ch4p was significantly higher compared to the other BFCS subregions in both diagnostic groups, and even compared favorably with the diagnostic accuracy of the hippocampus for classification of AD patients. Although the multicenter effect was stronger on the BFCS than on the hippocampus volumes, our data support the hypothesis that atrophy in the BFCS is an important morphologic biomarker in AD.
The Ch4p region is part of the isodendritic core, a network of interconnected nuclei affected in the very early AD stages [49]. Although profound loss of cholinergic neurons in the basal forebrain is a consistent finding in postmortem studies of end stage AD patients [3, 16, 50, 51], the underlying mechanism of regional BFCS atrophy in pre-clinical or mild clinical stages of AD is not resolved. In support of an ongoing neurodegenerative processes of the BFCS in pre-dementia stages of AD, BF cholinergic cells in MCI have been found to exhibit significant neurofibrillary pathology [20] as well as a reduction in trophic support due to a selective loss of receptors for the nerve growth factor [52–54]. Autopsy studies on persons who died in pre-dementia stages of AD (MCI) or mild AD stages are inconsistent in regard to atrophy of the BFCS. For example, choline acetyltransferase immunoreactivity in basal forebrain neurons and the vesicular acetylcholine transporter are not significantly reduced in MCI and mild dementia when compared to HC [55]. However, the number of participants was small (n = 7 MCI) and dystrophic cell shrinkage, which may be indicative of a neurodegenerative process prior to definite neuronal death, was not assessed. DeKosky et al. found elevated levels of choline acetyltransferase in the frontal cortex and hippocampus in 14 patients with MCI compared to HC [56]. Indeed, both a post-mortem study on the size of the Golgi apparatus in cholinergic neurons in MCI as well as a recent in vivo FDG-PET study on basal forebrain metabolism suggested an increase of metabolic activity in the BFCS in pre-dementia stages of AD [57, 58], possibly reflecting a compensatory adaptation.
George and colleagues employed a manual delineation of the substantia innominata in their MRI study with 19 participants with mild AD, 33 with MCI, and 27 elderly controls. They found a volume reduction of the substantia innominata in the AD group compared to MCI and controls but no significant differences between the MCI group and the control group [59]. Another study with 26 MCI, 12 AD patients, and 46 controls using manual tracing of the substantia innominata did show significant reduction in volume in the AD and MCI group compared to controls [60]. However, it is difficult for in vivo studies on the BFCS to offer a precise delineation of the complex structure of the scattered cholinergic cell groups in the absence of significant landmarks. Advanced imaging techniques using deformation-based morphometry in combination with cytoarchitectonic maps of the BFCS, based on dedicated histological examinations and postmortem MRI, have begun to provide access to the detailed study of the BFCS in vivo. Using these techniques, changes in subregions of the BFCS in pre-dementia and dementia stages of AD have been assessed using a single-person map derived from postmortem histological staining and MRI-based localization of the cholinergic fore brain [27] as well as using a probabilistic map of the magnocellular nuclei of the BFCS based on pooled data from 10 brain specimens [28, 30]. Studies using these maps demonstrated volume reductions in the BFCS both in AD and MCI, with the strongest and earliest effects located in the Ch4p region [27, 29, 30, 32]. However, limitations of these previous maps include the lack of subregional differentiation in the first map and the deviation from the Mesulam nomenclature for the identification of the BFCS subregions in the probabilistic map. A further limitation common to both maps is the reference to MRI of formalin fixed brains, which limits the accuracy of transformation of MRI data into MNI standard space. Therefore, for better differentiation of subregions of the BFCS, in this study we generated a new map based on postmortem histological staining, identification of subregions following the Mesulam nomenclature and high-dimensional transformation of BFCS labels into MNI standard space via in cranio postmortem MRI.
Volumetric change: Subregional differences
Our finding that the regions projecting to the localization of Ch4p shows the strongest changes in AD fits well with similar findings in independent samples of MCI patients [29, 30] and with neuropathological studies which showed that the posterior NbM region suffers the most severe neuronal loss in AD [20, 61]. Consistently, in MCI-AD participants, the volume reduction of the Ch4 region was more prominent in posterior parts, preserving anterior-medial regions of the NbM. Interestingly, cholinergic cells in the posterior NbM subdivision project mainly to the temporal neocortex [6], which also shows the most prominent reduction in cortical cholinergic activity in AD [62].
Little is known about the function of the nucleus subputaminalis (NSP, Ayala's nucleus) and even less about its role in AD. The anatomic position of the NSP close to the external capsule and in proximity to cortical speech areas, the strong accentuation of this structure in the left hemisphere, and the fact that it has only been described in humans and anthropoid monkeys, but not in other species, gave rise to the hypothesis that the NSP might play an important role in speech processing [63]. In the future, our BFCS mask will provide the possibility to investigate a potential role of NSP changes for language impairment in AD and other neurodegenerative diseases.
The Ch3 region of the basal forebrain is located at the horizontal limb of the diagonal band of Broca, provides the major cholinergic source for the olfactory bulb [6], and is early and severely affected by AD [64]. These findings agree with the clinical observation that loss of smell is an early symptom in AD [65]. Our finding of significant volume reduction in the region projecting to the localization of Ch3 in patients with AD and MCI-AD compared to controls agrees with previous morphometric studies in independent samples [27, 30].
The Ch2 region corresponds to the vertical limb of the diagonal band of Broca and the cholinergic neurons project mainly to the hippocampus—similar to the Ch1 neurons—but also to cortical midline areas [6, 66]. Neuropathological examinations have shown that this region is the less affected compared to the more posterior BFCS nuclei in AD [16, 67], which is consistent with our in vivo findings in this and previous studies [29].
Diagnostic accuracy
The AUCs for the diagnostic separation of AD and HC ranged from 0.57 to 0.88. The highest group separation was achieved by using the volume of the Ch4p region both in AD and MCI-AD participants. The diagnostic accuracy of this region was significantly higher than the accuracy of hippocampus volumetry in both groups. To the best of our knowledge, there is no other study of the BFCS using subregional analysis of group discrimination. In monocentric MRI data from the Open Access Series of Imaging Studies (OASIS, http://www.oasis-brains.org/), a non-subregional map of the BFCS as a whole [27] reached a diagnostic accuracy of 0.81 AUC for the discrimination between 28 patients with AD and 96 HC, which was identical to the diagnostic value of hippocampus volume. However, in a sample of 69 participants in a pre-dementia stage of AD, the non-subregional map of the BFCS only achieved an AUC of 0.69 for the separation from HC and was significantly inferior to the diagnostic accuracy of hippocampus volume [29].
Variance component analysis revealed a considerably stronger effect of scanner on BFCS measurements than on hippocampus measurements. This result is not surprising, given the small size of the BFCS structures. Still, the data on group differences and diagnostic accuracy suggest that at least for Ch4p and NSP, the multicenter variance is offset by a strong involvement of these brain areas in AD and its value as a diagnostic test is unlikely to be diminished.
The interpretation of the anatomical findings is limited, because the histological examination of a single brain specimen for stereotactic mapping of the BFCS nuclei does not account for inter-individual differences in BFCS anatomy. However, MR images of dehydrated brains show a marked reduction in gray/white matter contrast, which reduces the accuracy of automated segmentation and spatial normalization procedures. Therefore, spatial variation in the location of stereo tactically mapped BFCS regions across individuals may also reflect inter-individual differences in spatial normalization accuracy, in addition to anatomic variability. Although limited to a single brain specimen, in the present study we aimed to enhance the quality of the stereotactic mapping from histology into MNI space using a postmortem MRI in cranio, which showed image characteristics comparable to in vivo scans. This intermediate normalization step via the in cranio scan of the same subject allows high-dimensional spatial normalization from native to MNI standard space using the highly efficient DARTEL algorithm [45, 68]. This may significantly improve the spatial projection of the native localization of BFCS nuclei into MNI standard space when compared to the direct spatial normalization of the alcohol-fixed brain scans that has been used in previous cytoarchitectonic mapping studies [27, 28].
To determine the convergence of the location of the cholinergic space of the BF in MNI standard space across different processing pipelines and data sources, we compared our mask with a previously published probabilistic mask of the BFCS and found a very good spatial agreement between the masks, i.e., all center of gravity coordinates for the different BFCS subdivisions reported in [28] fell into the cholinergic space as defined by our mask, with exception of the coordinate for right Ch4p which was located slightly lateral of the space defined by our right Ch4p label.
In summary, we found significant and differential atrophy of BFCS subregions in AD and MCI-AD, most notable involving posterior parts of the NbM (Ch4p). Compared to AD dementia, the anterior-medial regions of the NbM were more preserved in MCI-AD. Diagnostic accuracy of BFCS subregional volumes was comparable to hippocampus volumetry for the most severely affected BFCS regions, despite higher multicenter variability. These data suggest that BFCS morphometry may provide an emerging biomarker in AD that may help in studying underlying neurobiological changes of specific cognitive impairments.
Supplementary Material
Fig. 4.

ROC curves of BFCS subregions and hippocampus. ROC curves of the different subregions (left) and comparison of Ch4p and hippocampus volumes (right). (A: AD dementia compared to HC I; B: MCI-AD compared to HC II).
Acknowledgments
HH was supported by a research grant of the Katharina-Hardt-Foundation, Bad Homburg, Germany. ALWB has received funding from Science Foundation Ireland through the Stokes Programme. Dr. Grinberg is funded by the NIH (R01AG040311).
Footnotes
Authors' disclosures available online (http://www.jalz.com/disclosures/view.php?id=2065).
Supplementary Material: The supplementary figure and table are available in the electronic version of this article: http://dx.doi.org/10.3233/JAD-132345.
References
- 1.Davies P, Maloney AJ. Selective loss of central cholinergic neurons in Alzheimer's disease. Lancet. 1976;2:1403. doi: 10.1016/s0140-6736(76)91936-x. [DOI] [PubMed] [Google Scholar]
- 2.Gil-Bea FJ, Garcia-Alloza M, Dominguez J, Marcos B, Ramirez MJ. Evaluation of cholinergic markers in Alzheimer's disease and in a model of cholinergic deficit. Neurosci Lett. 2005;375:37–41. doi: 10.1016/j.neulet.2004.10.062. [DOI] [PubMed] [Google Scholar]
- 3.McGeer PL, McGeer EG, Suzuki J, Dolman CE, Nagai T. Aging, Alzheimer's disease, and the cholinergic system of the basal forebrain. Neurology. 1984;34:741–745. doi: 10.1212/wnl.34.6.741. [DOI] [PubMed] [Google Scholar]
- 4.Ruberg M, Mayo W, Brice A, Duyckaerts C, Hauw JJ, Simon H, LeMoal M, Agid Y. Choline acetyltransferase activity and [3H] vesamicol binding in the temporal cortex of patients with Alzheimer's disease, Parkinson's disease, and rats with basal forebrain lesions. Neuroscience. 1990;35:327–333. doi: 10.1016/0306-4522(90)90086-j. [DOI] [PubMed] [Google Scholar]
- 5.Ellis JR, Ellis KA, Bartholomeusz CF, Harrison BJ, Wesnes KA, Erskine FF, Vitetta L, Nathan PJ. Muscarinic and nicotinic receptors synergistically modulate working memory and attention in humans. Int J Neuropsychopharmacol. 2006;9:175–189. doi: 10.1017/S1461145705005407. [DOI] [PubMed] [Google Scholar]
- 6.Mesulam MM, Mufson EJ, Levey AI, Wainer BH. Cholinergic innervation of cortex by the basal forebrain: Cytochemistry and cortical connections of the septal area, diagonal band nuclei, nucleus basalis (substantia innominata), and hypothalamus in the rhesus monkey. J Comp Neurol. 1983;214:170–197. doi: 10.1002/cne.902140206. [DOI] [PubMed] [Google Scholar]
- 7.Meynert T. Der Bau der Gross-Hirnrinde und seine örtlichen Verschiedenheiten, nebst einem pathologischanatomischen Corollarium. Vierteljahrsschrift für Psychiatrie. 1867;1:77–93. 199–217. [Google Scholar]
- 8.Meynert T. Der Bau der Gross-Hirnrinde und seine örtlichen Verschiedenheiten, nebst einem pathologischanatomischen Corollarium. Vierteljahrsschrift für Psychiatrie. 1868;2:88–113. [Google Scholar]
- 9.Kölliker A. Handbuch der Gewebelehre 1896 [Google Scholar]
- 10.Broca P. Anatomie comparee des circonvolutions cerebrales. Le grand lobe limbique et la scissure limbique dans la serie des mammiferes. Rev Anthropol. 1878;8:385–498. [Google Scholar]
- 11.Ayala G. A hitherto undifferentiated nucleus in the forebrain (nucleus subputaminalis) Brain. 1915;37:433–438. [Google Scholar]
- 12.Arendt T, Taubert G, Bigl V, Arendt A. Amyloid deposition in the nucleus basalis of Meynert complex: A topographic marker for degenerating cell clusters in Alzheimer's disease. Acta Neuropathol. 1988;75:226–232. doi: 10.1007/BF00690530. [DOI] [PubMed] [Google Scholar]
- 13.Geula C, Nagykery N, Nicholas A, Wu CK. Cholinergic neuronal and axonal abnormalities are present early in aging and in Alzheimer disease. J Neuropathol Exp Neurol. 2008;67:309–318. doi: 10.1097/NEN.0b013e31816a1df3. [DOI] [PMC free article] [PubMed] [Google Scholar]
- 14.Mesulam MM. The cholinergic innervation of the human cerebral cortex. Prog Brain Res. 2004;145:67–78. doi: 10.1016/S0079-6123(03)45004-8. [DOI] [PubMed] [Google Scholar]
- 15.Sassin I, Schultz C, Thal DR, Rub U, Arai K, Braak E, Braak H. Evolution of Alzheimer's disease-related cytoskeletal changes in the basal nucleus of Meynert. Acta Neuropathol. 2000;100:259–269. doi: 10.1007/s004019900178. [DOI] [PubMed] [Google Scholar]
- 16.Vogels OJ, Broere CA, ter Laak HJ, ten Donkelaar HJ, Nieuwenhuys R, Schulte BP. Cell loss and shrinkage in the nucleus basalis Meynert complex in Alzheimer's disease. Neurobiol Aging. 1990;11:3–13. doi: 10.1016/0197-4580(90)90056-6. [DOI] [PubMed] [Google Scholar]
- 17.Mesulam M, Shaw P, Mash D, Weintraub S. Cholinergic nucleus basalis tauopathy emerges early in the aging-MCI-AD continuum. Ann Neurol. 2004;55:815–828. doi: 10.1002/ana.20100. [DOI] [PubMed] [Google Scholar]
- 18.Lyness SA, Zarow C, Chui HC. Neuron loss in key cholinergic and aminergic nuclei in Alzheimer disease: A meta-analysis. Neurobiol Aging. 2003;24:1–23. doi: 10.1016/s0197-4580(02)00057-x. [DOI] [PubMed] [Google Scholar]
- 19.Haense C, Kalbe E, Herholz K, Hohmann C, Neumaier B, Krais R, Heiss WD. Cholinergic system function and cognition in mild cognitive impairment. Neurobiol Aging. 2012;33:867–877. doi: 10.1016/j.neurobiolaging.2010.08.015. [DOI] [PubMed] [Google Scholar]
- 20.Mesulam M. The cholinergic lesion of Alzheimer's disease: Pivotal factor or side show? Learn Mem. 2004;11:43–49. doi: 10.1101/lm.69204. [DOI] [PubMed] [Google Scholar]
- 21.Sasaki M, Ehara S, Tamakawa Y, Takahashi S, Tohgi H, Sakai A, Mita T. MR anatomy of the substantia innominata and findings in Alzheimer disease: A preliminary report. AJNR Am J Neuroradiol. 1995;16:2001–2007. [PMC free article] [PubMed] [Google Scholar]
- 22.Hanyu H, Tanaka Y, Sakurai H, Takasaki M, Abe K. Atrophy of the substantia innominata on magnetic resonance imaging and response to donepezil treatment in Alzheimer's disease. Neurosci Lett. 2002;319:33–36. doi: 10.1016/s0304-3940(01)02507-1. [DOI] [PubMed] [Google Scholar]
- 23.Hanyu H, Asano T, Sakurai H, Tanaka Y, Takasaki M, Abe K. MR analysis of the substantia innominata in normal aging, Alzheimer disease, and other types of dementia. AJNR Am J Neuroradiol. 2002;23:27–32. [PMC free article] [PubMed] [Google Scholar]
- 24.Hanyu H, Shimizu S, Tanaka Y, Hirao K, Iwamoto T, Abe K. MR features of the substantia innominata and therapeutic implications in dementias. Neurobiol Aging. 2007;28:548–554. doi: 10.1016/j.neurobiolaging.2006.02.009. [DOI] [PubMed] [Google Scholar]
- 25.Whitwell JL, Weigand SD, Shiung MM, Boeve BF, Ferman TJ, Smith GE, Knopman DS, Petersen RC, Benarroch EE, Josephs KA, Jack CR., Jr Focal atrophy in dementia with Lewy bodies on MRI: A distinct pattern from Alzheimer's disease. Brain. 2007;130:708–719. doi: 10.1093/brain/awl388. [DOI] [PMC free article] [PubMed] [Google Scholar]
- 26.Heinsen H, Hampel H, Teipel S. Computer-assisted 3D reconstruction of the Nucleus basalis complex, including the Nucleus subputaminalis. Brain. 2006;129:E43. [Google Scholar]
- 27.Teipel SJ, Flatz WH, Heinsen H, Bokde AL, Schoenberg SO, Stockel S, Dietrich O, Reiser MF, Moller HJ, Hampel H. Measurement of basal forebrain atrophy in Alzheimer's disease using MRI. Brain. 2005;128:2626–2644. doi: 10.1093/brain/awh589. [DOI] [PubMed] [Google Scholar]
- 28.Zaborszky L, Hoemke L, Mohlberg H, Schleicher A, Amunts K, Zilles K. Stereotaxic probabilistic maps of the magnocellular cell groups in human basal forebrain. Neuroimage. 2008;42:1127–1141. doi: 10.1016/j.neuroimage.2008.05.055. [DOI] [PMC free article] [PubMed] [Google Scholar]
- 29.Grothe M, Heinsen H, Teipel SJ. Atrophy of the cholinergic Basal forebrain over the adult age range and in early stages of Alzheimer's disease. Biol Psychiatry. 2012;71:805–813. doi: 10.1016/j.biopsych.2011.06.019. [DOI] [PMC free article] [PubMed] [Google Scholar]
- 30.Grothe M, Zaborszky L, Atienza M, Gil-Neciga E, Rodriguez-Romero R, Teipel SJ, Amunts K, Suarez-Gonzalez A, Cantero JL. Reduction of basal forebrain cholinergic system parallels cognitive impairment in patients at high risk of developing Alzheimer's disease. Cereb Cortex. 2010;20:1685–1695. doi: 10.1093/cercor/bhp232. [DOI] [PMC free article] [PubMed] [Google Scholar]
- 31.Teipel SJ, Bokde AL, Born C, Meindl T, Reiser M, Moller HJ, Hampel H. Morphological substrate of face matching in healthy ageing and mild cognitive impairment: A combined MRI-fMRI study. Brain. 2007;130:1745–1758. doi: 10.1093/brain/awm117. [DOI] [PubMed] [Google Scholar]
- 32.Teipel SJ, Meindl T, Grinberg L, Grothe M, Cantero JL, Reiser MF, Moller HJ, Heinsen H, Hampel H. The cholinergic system in mild cognitive impairment and Alzheimer's disease: An in vivo MRI and DTI study. Hum Brain Mapp. 2011;32:1349–1362. doi: 10.1002/hbm.21111. [DOI] [PMC free article] [PubMed] [Google Scholar]
- 33.Teipel SJ, Wegrzyn M, Meindl T, Frisoni G, Bokde AL, Fellgiebel A, Filippi M, Hampel H, Kloppel S, Hauenstein K, Ewers M. Anatomical MRI and DTI in the diagnosis of Alzheimer's disease: A European multicenter study. J Alzheimers Dis. 2012;31:S33–S47. doi: 10.3233/JAD-2012-112118. [DOI] [PubMed] [Google Scholar]
- 34.Petersen RC. Mild cognitive impairment as a diagnostic entity. J Intern Med. 2004;256:183–194. doi: 10.1111/j.1365-2796.2004.01388.x. [DOI] [PubMed] [Google Scholar]
- 35.Albert MS, DeKosky ST, Dickson D, Dubois B, Feldman HH, Fox NC, Gamst A, Holtzman DM, Jagust WJ, Petersen RC, Snyder PJ, Carrillo MC, Thies B, Phelps CH. The diagnosis of mild cognitive impairment due to Alzheimer's disease: Recommendations from the National Institute on Aging-Alzheimer's Association workgroups on diagnostic guidelines for Alzheimer's disease. Alzheimers Dement. 2011;7:270–279. doi: 10.1016/j.jalz.2011.03.008. [DOI] [PMC free article] [PubMed] [Google Scholar]
- 36.Folstein MF, Folstein SE, McHugh PR. Mini-mental state. A practical method for grading the cognitive state of patients for the clinician. J Psychiatr Res. 1975;12:189–198. doi: 10.1016/0022-3956(75)90026-6. [DOI] [PubMed] [Google Scholar]
- 37.Morris JC, Heyman A, Mohs RC, Hughes JP, van Belle G, Fillenbaum G, Mellits ED, Clark C. The Consortium to Establish a Registry for Alzheimer's Disease (CERAD). Part I. Clinical and neuropsychological assessment of Alzheimer's disease. Neurology. 1989;39:1159–1165. doi: 10.1212/wnl.39.9.1159. [DOI] [PubMed] [Google Scholar]
- 38.Mesulam MM, Mufson EJ, Wainer BH, Levey AI. Central cholinergic pathways in the rat: An overview based on an alternative nomenclature (Ch1-Ch6) Neuroscience. 1983;10:1185–1201. doi: 10.1016/0306-4522(83)90108-2. [DOI] [PubMed] [Google Scholar]
- 39.Grinberg LT, Ferretti RE, Farfel JM, Leite R, Pasqualucci CA, Rosemberg S, Nitrini R, Saldiva PH, Filho WJ. Brain bank of the Brazilian aging brain study group - a milestone reached and more than 1,600 collected brains. Cell Tissue Bank. 2007;8:151–162. doi: 10.1007/s10561-006-9022-z. [DOI] [PubMed] [Google Scholar]
- 40.Grinberg LT, Amaro E, Jr, Teipel S, dos Santos DD, Pasqualucci CA, Leite RE, Camargo CR, Goncalves JA, Sanches AG, Santana M, Ferretti RE, Jacob-Filho W, Nitrini R, Heinsen H. Assessment of factors that confound MRI and neuropathological correlation of human postmortem brain tissue. Cell Tissue Bank. 2008;9:195–203. doi: 10.1007/s10561-008-9080-5. [DOI] [PubMed] [Google Scholar]
- 41.Grinberg LT, Amaro Junior E, da Silva AV, da Silva RE, Sato JR, dos Santos DD, de Paula Pacheco S, de Lucena Ferretti RE, Paraizo Leite RE, Pasqualucci CA, Teipel SJ, Flatz WH, Heinsen H. Improved detection of incipient vascular changes by a biotechnological platform combining post mortem MRI in situ with neuropathology. J Neurol Sci. 2009;283:2–8. doi: 10.1016/j.jns.2009.02.327. [DOI] [PubMed] [Google Scholar]
- 42.Heinsen H, Arzberger T, Schmitz C. Celloidin mounting (embedding without infiltration) - a new, simple and reliable method for producing serial sections of high thickness through complete human brains and its application to stereological and immunohistochemical investigations. J Chem Neuroanat. 2000;20:49–59. doi: 10.1016/s0891-0618(00)00067-3. [DOI] [PubMed] [Google Scholar]
- 43.Mesulam MM, Geula C. Nucleus basalis (Ch4) and cortical cholinergic innervation in the human brain: Observations based on the distribution of acetylcholinesterase and choline acetyltransferase. J Comp Neurol. 1988;275:216–240. doi: 10.1002/cne.902750205. [DOI] [PubMed] [Google Scholar]
- 44.Ashburner J, Andersson JL, Friston KJ. High-dimensional image registration using symmetric priors. Neuroimage. 1999;9:619–628. doi: 10.1006/nimg.1999.0437. [DOI] [PubMed] [Google Scholar]
- 45.Ashburner J. A fast diffeomorphic image registration algorithm. Neuroimage. 2007;38:95–113. doi: 10.1016/j.neuroimage.2007.07.007. [DOI] [PubMed] [Google Scholar]
- 46.Buckner RL, Head D, Parker J, Fotenos AF, Marcus D, Morris JC, Snyder AZ. A unified approach for morphometric and functional data analysis in young, old, and demented adults using automated atlas-based head size normalization: Reliability and validation against manual measurement of total intracranial volume. Neuroimage. 2004;23:724–738. doi: 10.1016/j.neuroimage.2004.06.018. [DOI] [PubMed] [Google Scholar]
- 47.Pruessner JC, Li LM, Serles W, Pruessner M, Collins DL, Kabani N, Lupien S, Evans AC. Volumetry of hippocampus and amygdala with high-resolution MRI and three-dimensional analysis software: Minimizing the discrepancies between laboratories. Cereb Cortex. 2000;10:433–442. doi: 10.1093/cercor/10.4.433. [DOI] [PubMed] [Google Scholar]
- 48.Metz CE, Herman BA, Roe CA. Statistical comparison of two ROC-curve estimates obtained from partially-paired datasets. Med Decis Making. 1998;18:110–121. doi: 10.1177/0272989X9801800118. [DOI] [PubMed] [Google Scholar]
- 49.Grinberg LT, Rueb U, Heinsen H. Brainstem: Neglected locus in neurodegenerative diseases. Front Neurol. 2011;2:42. doi: 10.3389/fneur.2011.00042. [DOI] [PMC free article] [PubMed] [Google Scholar]
- 50.Whitehouse PJ, Price DL, Clark AW, Coyle JT, DeLong MR. Alzheimer disease: Evidence for selective loss of cholinergic neurons in the nucleus basalis. Ann Neurol. 1981;10:122–126. doi: 10.1002/ana.410100203. [DOI] [PubMed] [Google Scholar]
- 51.Arendt T, Bigl V, Tennstedt A, Arendt A. Neuronal loss in different parts of the nucleus basalis is related to neuritic plaque formation in cortical target areas in Alzheimer's disease. Neuroscience. 1985;14:1–14. doi: 10.1016/0306-4522(85)90160-5. [DOI] [PubMed] [Google Scholar]
- 52.Mufson EJ, Ma SY, Dills J, Cochran EJ, Leurgans S, Wuu J, Bennett DA, Jaffar S, Gilmor ML, Levey AI, Kordower JH. Loss of basal forebrain P75(NTR) immunoreactivity in subjects with mild cognitive impairment and Alzheimer's disease. J Comp Neurol. 2002;443:136–153. doi: 10.1002/cne.10122. [DOI] [PubMed] [Google Scholar]
- 53.Chu Y, Cochran EJ, Bennett DA, Mufson EJ, Kordower JH. Down-regulation of trkA mRNA within nucleus basalis neurons in individuals with mild cognitive impairment and Alzheimer's disease. J Comp Neurol. 2001;437:296–307. doi: 10.1002/cne.1284. [DOI] [PubMed] [Google Scholar]
- 54.Mufson EJ, Ma SY, Cochran EJ, Bennett DA, Beckett LA, Jaffar S, Saragovi HU, Kordower JH. Loss of nucleus basalis neurons containing trkA immunoreactivity in individuals with mild cognitive impairment and early Alzheimer's disease. J Comp Neurol. 2000;427:19–30. doi: 10.1002/1096-9861(20001106)427:1<19::aid-cne2>3.0.co;2-a. [DOI] [PubMed] [Google Scholar]
- 55.Gilmor ML, Erickson JD, Varoqui H, Hersh LB, Bennett DA, Cochran EJ, Mufson EJ, Levey AI. Preservation of nucleus basalis neurons containing choline acetyltransferase and the vesicular acetylcholine transporter in the elderly with mild cognitive impairment and early Alzheimer's disease. J Comp Neurol. 1999;411:693–704. [PubMed] [Google Scholar]
- 56.DeKosky ST, Ikonomovic MD, Styren SD, Beckett L, Wisniewski S, Bennett DA, Cochran EJ, Kordower JH, Mufson EJ. Upregulation of choline acetyltransferase activity in hippocampus and frontal cortex of elderly subjects with mild cognitive impairment. Ann Neurol. 2002;51:145–155. doi: 10.1002/ana.10069. [DOI] [PubMed] [Google Scholar]
- 57.Dubelaar EJ, Mufson EJ, ter Meulen WG, Van Heerikhuize JJ, Verwer RW, Swaab DF. Increased metabolic activity in nucleus basalis of Meynert neurons in elderly individuals with mild cognitive impairment as indicated by the size of the Golgi apparatus. J Neuropathol Exp Neurol. 2006;65:257–266. doi: 10.1097/01.jnen.0000205143.16339.cd. [DOI] [PubMed] [Google Scholar]
- 58.Kim MJ, Lee KM, Son YD, Jeon HA, Kim YB, Cho ZH. Increased basal forebrain metabolism in mild cognitive impairment: An evidence for brain reserve in incipient dementia. J Alzheimers Dis. 2012;32:927–938. doi: 10.3233/JAD-2012-120133. [DOI] [PubMed] [Google Scholar]
- 59.George S, Mufson EJ, Leurgans S, Shah RC, Ferrari C, de Toledo-Morrell L. MRI-based volumetric measurement of the substantia innominata in amnestic MCI and mild AD. Neurobiol Aging. 2011;32:1756–1764. doi: 10.1016/j.neurobiolaging.2009.11.006. [DOI] [PMC free article] [PubMed] [Google Scholar]
- 60.Muth K, Schonmeyer R, Matura S, Haenschel C, Schroder J, Pantel J. Mild cognitive impairment in the elderly is associated with volume loss of the cholinergic basal forebrain region. Biol Psychiatry. 2010;67:588–591. doi: 10.1016/j.biopsych.2009.02.026. [DOI] [PubMed] [Google Scholar]
- 61.Mesulam M. Cholinergic aspects of aging and Alzheimer's disease. Biol Psychiatry. 2012;71:760–761. doi: 10.1016/j.biopsych.2012.02.025. [DOI] [PMC free article] [PubMed] [Google Scholar]
- 62.Herholz K, Weisenbach S, Kalbe E. Deficits of the cholinergic system in early AD. Neuropsychologia. 2008;46:1642–1647. doi: 10.1016/j.neuropsychologia.2007.11.024. [DOI] [PubMed] [Google Scholar]
- 63.Simic G, Mrzljak L, Fucic A, Winblad B, Lovric H, Kostovic I. Nucleus subputaminalis (Ayala): The still disregarded magnocellular component of the basal forebrain may be human specific and connected with the cortical speech area. Neuroscience. 1999;89:73–89. doi: 10.1016/s0306-4522(98)00304-2. [DOI] [PubMed] [Google Scholar]
- 64.Christen-Zaech S, Kraftsik R, Pillevuit O, Kiraly M, Martins R, Khalili K, Miklossy J. Early olfactory involvement in Alzheimer's disease. Can J Neurol Sci. 2003;30:20–25. doi: 10.1017/s0317167100002389. [DOI] [PubMed] [Google Scholar]
- 65.Schofield PW, Ebrahimi H, Jones AL, Bateman GA, Murray SR. An olfactory ‘stress test’ may detect preclinical Alzheimer's disease. BMC Neurol. 2012;12:24. doi: 10.1186/1471-2377-12-24. [DOI] [PMC free article] [PubMed] [Google Scholar]
- 66.Senut MC, Menetrey D, Lamour Y. Cholinergic and peptidergic projections from the medial septum and the nucleus of the diagonal band of Broca to dorsal hippocampus, cingulate cortex and olfactory bulb: A combined wheatgerm agglutinin-apohorseradish peroxidase-gold immunohistochemical study. Neuroscience. 1989;30:385–403. doi: 10.1016/0306-4522(89)90260-1. [DOI] [PubMed] [Google Scholar]
- 67.Fujishiro H, Umegaki H, Isojima D, Akatsu H, Iguchi A, Kosaka K. Depletion of cholinergic neurons in the nucleus of the medial septum and the vertical limb of the diagonal band in dementia with Lewy bodies. Acta Neuropathol. 2006;111:109–114. doi: 10.1007/s00401-005-0004-1. [DOI] [PubMed] [Google Scholar]
- 68.Klein A, Andersson J, Ardekani BA, Ashburner J, Avants B, Chiang MC, Christensen GE, Collins DL, Gee J, Hellier P, Song JH, Jenkinson M, Lepage C, Rueckert D, Thompson P, Vercauteren T, Woods RP, Mann JJ, Parsey RV. Evaluation of 14 nonlinear deformation algorithms applied to human brain MRI registration. Neuroimage. 2009;46:786–802. doi: 10.1016/j.neuroimage.2008.12.037. [DOI] [PMC free article] [PubMed] [Google Scholar]
Associated Data
This section collects any data citations, data availability statements, or supplementary materials included in this article.