

Abstract
We compared accuracy of hippocampus and basal forebrain cholinergic system (BFCS) atrophy to predict cortical amyloid burden in 179 cognitively normal subjects (CN), 269 subjects with early stages of mild cognitive impairment (MCI), 136 subjects with late stages of MCI, and 86 subjects with Alzheimer’s disease (AD) dementia retrieved from the Alzheimer’s Disease Neuroimaging Initiative database. Hippocampus and BFCS volumes were determined from structural magnetic resonance imaging scans at 3 Tesla, and cortical amyloid load from AV45 (florbetapir) positron emission tomography scans. In receiver operating characteristics analyses, BFCS volume provided significantly more accurate classification into amyloid-negative and -positive categories than hippocampus volume. In contrast, hippocampus volume more accurately identified the diagnostic categories of AD, late and early MCI, and CN compared with whole and anterior BFCS volume, whereas posterior BFCS and hippocampus volumes yielded similar diagnostic accuracy. In logistic regression analysis, hippocampus and posterior BFCS volumes contributed significantly to discriminate MCI and AD from CN, but only BFCS volume predicted amyloid status. Our findings suggest that BFCS atrophy is more closely associated with cortical amyloid burden than hippocampus atrophy in predementia AD.
Keywords: Cholinergic system, Hippocampus, Amyloid PET, Diagnosis, Predementia Alzheimer’s disease
1. Introduction
According to the amyloid cascade hypothesis, cortical amyloid accumulation is the first event in the pathogenesis of Alzheimer’s disease (AD) instigating further pathological events, including the formation of neurofibrillary tangles and disruption of synaptic connections, which then lead to a reduction in neurotransmitter levels, death of tangle-bearing neurons, and dementia (Selkoe, 2000). Therefore, detection of cortical amyloid accumulation using positron emission tomography (PET) with amyloid binding compounds has become a disease defining marker of AD (Barthel et al., 2011; Klunk et al., 2004).
The interaction between PET markers of cortical amyloid accumulation and structural imaging markers of atrophy in AD has found increasing attention. Hippocampus volume, the best established structural imaging marker of AD (Dubois et al., 2007; Wahlund et al., 2005), was not different or even larger in amyloid-positive (+) compared with amyloid-negative (−) healthy subjects (Becker et al., 2011; Bourgeat et al., 2010), but yet inversely correlated with amyloid load in amyloid+ healthy subjects in some, but not all studies (Apostolova et al., 2010; Bourgeat et al., 2010; Chetelat et al., 2010a, 2010b). In mild cognitive impairment (MCI) stages of AD, hippocampus atrophy has not been associated with global or regional amyloid accumulation in most studies (Apostolova et al., 2010; Chetelat et al., 2010b). Thus, associations between cortical amyloid deposition and hippocampus atrophy were relatively weak, consistent with postmortem evidence that amyloid pathology occurs in the hippocampus only secondary to neurofibrillary pathology (Braak and Braak, 1997; Royall et al., 2012).
Besides amyloid accumulation, cholinergic degeneration is regarded as a key event in AD pathogenesis (Mesulam, 2004). Degeneration of basal forebrain cholinergic nuclei occurs in early and predementia stages of AD (Mann et al., 1984; Perry et al., 1978; Sassin et al., 2000; Whitehouse et al., 1981). Animal models and postmortem brain studies provide evidence for a 2-way interaction between cholinergic transmission and amyloid accumulation (Schliebs and Arendt, 2006), with a specific vulnerability of cholinergic basal forebrain neurons to amyloid toxicity (Boncristiano et al., 2002) and increased amyloid formation with decline of cholinergic transmission (Beach, 2008). Volumetric measurement of cholinergic nuclei in the basal forebrain has become available (Grothe et al., 2010, 2012; Teipel et al., 2005) using in vivo structural magnetic resonance imaging (MRI) and masks of the basal forebrain cholinergic nuclei derived from postmortem MRI and histology (Heinsen et al., 2006).
Other than amyloid end points, changes in hippocampus volume were consistently found to be associated with episodic memory impairment (Grothe, et al., 2010; Mortimer et al., 2004; Reitz et al., 2009; Teipel et al., 2010), the defining clinical criterion for MCI. Accordingly, hippocampus volume was superior to cortical amyloid load in discriminating amnestic MCI subjects from healthy control subjects in a previous study (Jack et al., 2008). So far, BFCS volume has been little studied for diagnosis of MCI, reaching an accuracy below that of hippocampus volume in one previous study (Grothe et al., 2012).
Based on these findings, our primary hypothesis was that BFCS volume would be more sensitive to cortical amyloid accumulation than hippocampus volume in cognitively healthy elderly and MCI subjects. Our secondary hypothesis was that hippocampus volume would be more sensitive than BFCS volume to predict a diagnosis of MCI. We used data from 670 subjects retrieved from the Alzheimer’s Disease Neuroimaging Initiative (ADNI) database (adni.loni.ucla.edu) comprised of subjects with AD dementia, early and late stages of MCI, and cognitively healthy elderly subjects. Based on this sample, we determined the accuracy of BFCS and hippocampus volumes to predict PET-based classification into amyloid+ or amyloid− subgroups and to differentiate MCI subjects from cognitively healthy control subjects irrespective of amyloid status.
2. Methods
Data used in the preparation of this article were obtained from the ADNI database (adni.loni.ucla.edu). The ADNI was launched in 2003 by the National Institute on Aging, the National Institute of Biomedical Imaging and Bioengineering, the Food and Drug Administration, private pharmaceutical companies, and nonprofit organizations, as a $60 million, 5-year public-private partnership. The primary goal of ADNI has been to test whether serial MRI, PET, other biological markers, and clinical and neuropsychological assessment can be combined to measure the progression of MCI and early AD. Determination of sensitive and specific markers of very early AD progression is intended to aid researchers and clinicians to develop new treatments and monitor their effectiveness, and lessen the time and cost of clinical trials.
The Principal Investigator of this initiative is Michael W. Weiner, MD, Veterans Affairs Medical Center and University of California, San Francisco. ADNI is the result of efforts of many coinvestigators from a broad range of academic institutions and private corporations, and subjects have been recruited from more than 50 sites across the United States and Canada. The initial goal of ADNI was to recruit 800 subjects but ADNI has been followed by ADNI-GO and ADNI-2. To date, these 3 protocols have recruited more than 1500 adults, ages 55–90, to participate in the research, consisting of cognitively normal older individuals, people with early or late MCI, and people with early AD. The follow-up duration of each group is specified in the protocols for ADNI-1, ADNI-2, and ADNI-GO. Subjects originally recruited for ADNI-1 and ADNI-GO had the option to be followed in ADNI-2. For up-to-date information, see www.adni-info.org.
2.1. Subjects
(AV45)-amyloid-PET and structural MRI scans were retrieved from the ADNI-GO and ADNI-2 extensions of the ADNI project and included imaging data of 179 cognitively normal elderly subjects (CN), 269 subjects with early stage MCI (EMCI), 136 subjects in a more advanced stage of MCI (LMCI), and 86 subjects in dementia stages of AD. A subset of this sample, 57 CN, 155 EMCI, and 31 LMCI subjects, had been included in a previous study (Grothe et al., in press).
Detailed inclusion criteria for the diagnostic categories can be found at the ADNI Web site (http://adni.loni.usc.edu/methods/documents/). Briefly, CN subjects have Mini Mental State Examination (MMSE) scores between 24 and 30 (inclusive), a Clinical Dementia Rating (CDR) score = 0, are nondepressed, non-MCI, and nondemented. EMCI subjects have MMSE scores between 24 and 30 (inclusive), a subjective memory concern reported by the subject, informant, or clinician, objective memory loss measured using education-adjusted scores on delayed recall (1 paragraph from Wechsler Memory Scale Logical Memory II; education-adjusted scores: ≥16 years: 9–11; 8–15 years: 5–9; 0–7 years: 3–6), a CDR = 0.5, absence of significant levels of impairment in other cognitive domains, essentially preserved activities of daily living, and an absence of dementia. Diagnosis of LMCI differs from that of EMCI only in a higher degree of objective memory impairment (education-adjusted scores: ≥16 years: ≤8; 8–15 years: ≤4; 0–7 years: ≤2). Subjects with AD dementia have initial MMSE scores between 20 and 26 (inclusive), a CDR = 0.5 or 1.0 and fulfill National Institute of Neurological and Communicative Diseases and Stroke/Alzheimer’s Disease and Related Disorders Association criteria for clinically probable AD (McKhann et al., 1984).
2.2. Imaging data acquisition
ADNI-GO/-2 MRI data were acquired on multiple 3-T MRI scanners using scanner-specific T1-weighted sagittal 3-D magnetization-prepared rapid gradient-echo sequences. To increase signal uniformity across the multicenter scanner platforms, original magnetization-prepared rapid gradient-echo acquisitions in ADNI undergo standardized image preprocessing correction steps.
(AV45)-amyloid-PET data were acquired on multiple instruments of varying resolution and following different platform-specific acquisition protocols. Similar to the MRI data, PET data in ADNI undergo standardized image preprocessing correction steps aimed at increasing data uniformity across the multicenter acquisitions.
More detailed information on the different imaging protocols used across ADNI sites and standardized image preprocessing steps for MRI and PET acquisitions can be found on the ADNI Web site (http://adni.loni.usc.edu/data-samples/).
The average acquisition delay between AV45 scans and corresponding MRI scans used in this study was 33.8 ± 30.5 days.
2.3. Imaging data processing
Imaging data were processed using statistical parametric mapping (SPM8, Wellcome Trust Center for Neuroimaging) and the VBM8 toolbox (http://dbm.neuro.uni-jena.de/vbm/) implemented in MatLab R2007a (MathWorks, Natick, MA, USA).
2.3.1. MRI processing
First, MRI scans were automatically segmented into gray matter (GM), white matter (WM), and cerebrospinal fluid (CSF) partitions of 1.5-mm isotropic voxel size using the tissue prior free segmentation routine of the VBM8 toolbox. The resulting GM and WM partitions of each subject in native space were then high-dimensionally registered to an aging/AD-specific reference template from a previous study (Grothe et al., 2012) using Diffeomorphic anatomical registration through exponentiated lie algebra (DARTEL) (Ashburner, 2007). Structural brain characteristics change considerably in advanced age and AD, and spatial registration accuracy worsens with deviance from the template characteristics, rendering the Montreal Neurological Institute (MNI) standard space template inappropriate for high-dimensional deformation-based morphometry studies of aged and demented populations. Therefore, the reference template in this study was derived by DARTEL-aligning 50 healthy elderly subjects and 50 subjects with very mild, mild, and moderate AD retrieved from an open access MRI database (www.oasis-brains.org), and thus reflects unbiased aging/AD-specific structural characteristics. Individual flow fields resulting from the DARTEL registration to the reference template were used to warp the GM segments and voxel values were modulated for volumetric changes introduced by the high-dimensional normalization, such that the total amount of GM volume present before warping was preserved. Finally, for voxel-based analyses, modulated warped GM segments were smoothed with a Gaussian smoothing kernel of 8 mm full-width at half maximum. All preprocessed GM maps passed a visual inspection for segmentation and registration accuracy.
Individual GM volumes of regions of interest (ROIs) were extracted automatically from the warped GM segments (before smoothing) by summing up the modulated GM voxel values within the respective ROI masks in the reference space (see section 2.3.2.). For further analyses, the extracted regional GM volumes were divided by the total intracranial volume, calculated as the sum of total volumes of the GM, WM, and CSF partitions.
2.3.2. Definition of the basal forebrain and hippocampus ROIs
The cholinergic basal forebrain (BF) is composed of 4 groups of cholinergic cells. According to Mesulam’s nomenclature, Ch1 refers to the cholinergic cells associated with the medial septal nucleus, Ch2 and Ch3 to those belonging to the vertical and horizontal limb of the diagonal band of Broca, respectively, and Ch4 designates the cholinergic cells of the nucleus basalis of Meynert (Mesulam et al., 1983b). The nucleus basalis of Meynert is the largest cholinergic nucleus of the BF and can be further subdivided into anterior lateral (Ch4al) and medial (Ch4am), intermediate (Ch4i) and posterior regions (Ch4p). The cholinergic nuclei lack clear anatomical borders that could be easily identified on MRI scans, rendering manual delineation impractical. The BF mask used in this study was therefore based on a cytoarchitectonic map of BF cholinergic nuclei in MNI space, derived from combined histology and in cranio MRI of a postmortem brain (Teipel et al., unpublished). This map is similar in general outline to a previously defined BFCS map based on a different postmortem MRI scan (Teipel et al., 2005), but in contrast to this previous mask it contains outlines of the Ch1/2, Ch3, Ch4a–i, Ch4p, and nucleus subputaminalis subregions of the basal forebrain. For subsequent analysis we used the entire volume of the BFCS and the subregions belonging to the nucleus basalis of Meynert proper (i.e., Ch4a–i and Ch4p). Considering that this cytoarchitectonic map was designed to match standard MNI space, we nonlinearly registered the MNI152 template to the aging–AD-specific template used in this study and used the resulting DARTEL parameters to warp the cytoarchitectonic map into the population-specific template space.
We also examined hippocampus volume. The ROI mask for the hippocampus was obtained using manual delineation of the hippocampus in the reference template of aging–AD-specific anatomy (Grothe et al., 2012) using the interactive software package Display version 1.4.2 (McConnell Brain Imaging Centre at the Montreal Neurological Institute) and a previously described protocol for segmentation of the medial temporal lobe (Pruessner et al., 2000). Interrater reliability from 4 raters independently measuring hippocampus volume in 10 randomly selected MRI scans yielded intraclass correlation coefficients of 0.92 for the right and 0.93 for the left hippocampus (Teipel et al., 2010). Intrarater reliability for the rater who provided the label for automatic volumetry yielded intraclass correlation coefficients of 0.96 for the left and 0.93 for the right hippocampus when measuring 10 MRI scans twice, on average 464 (SD, 29) days apart.
2.3.3. (AV45)-amyloid PET data processing
(AV45)-PET scans were processed using SPM8 software. (AV45)-PET scans were rigidly coregistered to their corresponding structural MRI scans and warped to the aging–AD-specific reference space using the DARTEL flow fields derived from the registration of the coregistered structural MRI. To limit signal spillover from surrounding WM and CSF tissue, warped (AV45)-PET scans were masked with an inclusive GM mask of the aging–AD template thresholded at 50% GM probability.
Global cortical AV45 uptake was calculated as mean uptake within a composite mask of frontal, parietal, and temporal ROIs known to be vulnerable to amyloid accumulation (Shin et al., 2010; Thal et al., 2002). Anatomical masks for these ROIs were derived from the Harvard–Oxford structural atlas (distributed with the software package, FSL; Desikan et al., 2006) and high-dimensionally warped into the reference space of this study based on a DARTEL registration of the MNI152 template (the template space of the Harvard–Oxford atlas) to the aging–AD reference template. Cortical AV45 uptake means were converted to standard uptake value ratios (SUVR) by normalization to the mean uptake value within a mask of cerebellar GM, which was derived from the Hammers Maximum Probability atlas (Hammers et al., 2003) and processed identically to the labels of the Harvard–Oxford atlas. The cortical composite mask and the cerebellar mask are illustrated in Fig. 1.
Fig. 1.
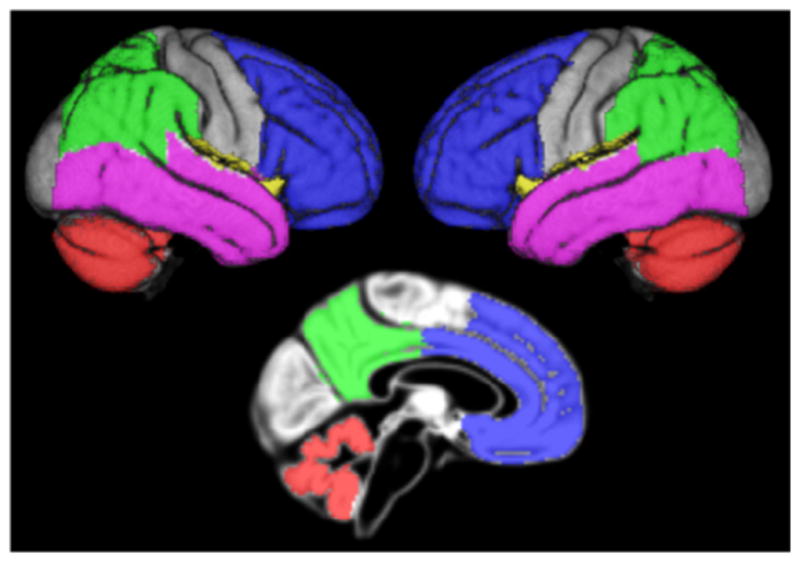
Overview of the cortical composite and cerebellar masks. Figure illustrating the lobar contributions to the composite cortical mask and the cerebellar control region on rendered views of right and left brain surfaces and a midsagittal section of the reference template. Blue = frontal labels; green = parietal labels; violet = temporal labels; yellow = insular labels (not thoroughly visible); red = cerebellar control region.
Based on combined antemortem (AV45) PET and postmortem neuropathologic examination a threshold of cortex to whole cerebellum SUVR ≥1.17 was suggested to be indicative of pathological levels of amyloid associated with AD (Fleisher et al., 2011). Cortex to whole cerebellum SUVRs are being calculated for all ADNI subjects and made available on the ADNI server by 1 of the ADNI PET core laboratories (Susan Landau and William Jagust at Helen Wills Neuroscience Institute, UC Berkley and Lawrence Berkeley National Laboratory). Linear regression analysis between these cortex to whole cerebellum SUVRs and the cortex to cerebellar GM SUVRs used in the present study yielded close to perfect correlation between these 2 measures (R2 = 0.948 across all subjects; see Supplementary Fig. 1). Based on the linear regression equation the threshold of 1.17 converts to a threshold of 1.362 for the cortex to cerebellar GM SUVR used here. The apparently lower threshold for cortex to whole cerebellum SUVR is explained by nonspecific tracer uptake in cerebellar WM, which is excluded in the cerebellar GM mask.
2.4. Statistics
Demographic characteristics were compared between clinical- and amyloid-stratified groups using Student t test for age and years of education, Mann-Whitney U test for MMSE scores, and χ2 tests for sex distribution and handedness.
Statistical significance of the difference in effect sizes between hippocampus and BFCS volumes across the clinical- and amyloid-based classifications was assessed using comparison of areas under the receiver operating characteristics curves (AUC) implemented in ROCKIT software version 0.9.1 (Kurt Rossmann Laboratories) (Metz et al., 1998). We used the AUC as a measure of effect size of group differences (Hanley and McNeil, 1983) and compared AUCs between markers. This approach has been well established in the biomarker and imaging marker literature (Parnetti et al., 2001; Teipel et al., 2003) and allows direct comparison of diagnostic performance between markers derived from the same sample.
In addition, we determined contribution of Ch4am-al and Ch4p nuclei and bilateral hippocampus to group discrimination using logistic regression models. In the first step, all markers plus age, sex, and center were forced into the model. Subsequently, volumetric markers were stepwise removed from the model based on conditional likelihood ratio tests, where markers were only retained in the model if they yielded a contribution for model fit at a level of significance of p < 0.05. The logistic regression analysis served to asses the effect of covariates on diagnostic performance, and to determine the relative contribution of each marker to diagnostic accuracy when first all markers were forced into the model and then sequentially removed according to their contribution to the fit of the model.
3. Results
3.1. Demographic characteristics
As outlined in Table 1, AD, and EMCI+ subjects were significantly older than the CN− subjects, and the EMCI− were significantly younger than the CN− subjects (Student t test). CN+ and EMCI+ subjects were significantly older than the amyloid− subjects from the same clinical diagnostic category (Student t test). Groups differed in MMSE scores, with AD dementia subjects having the lowest and CN subjects having the highest MMSE scores. EMCI+ and LMCI+ subjects had significantly lower MMSE scores compared with the amyloid− subjects from the same clinical diagnostic category (Mann-Whitney U test). Sex distribution was only different between EMCI+ and CN−, and between EMCI+ and EMCI− subjects, with more women in the EMCI+ group. Handedness was similarly distributed across clinical- and amyloid-stratified groups (χ2 = 8.4; 7 df; p = 0.31), with 602 right-handed and 68 left-handed subjects.
Table 1.
Subject demographics for amyloid-stratified diagnostic groups
| Group | n | Age, y | Sex (F/M) | Education, y | MMSE |
|---|---|---|---|---|---|
| AD− | 12 | 78.5 (SD 6.1)a | 9/3 | 15.8 (SD 2.6) | 22.3 (SD 1.9)a |
| AD+ | 74 | 75.1 (SD 8.5)b | 41/33 | 15.7 (SD 2.8)a | 23.0 (SD 2.0)a |
| LMCI− | 55 | 72.1 (SD 9.1) | 26/29 | 16.2 (SD 2.6) | 28.2 (SD 1.5)a |
| LMCI+ | 81 | 72.7 (SD 7.3) | 48/33 | 16.7 (SD 2.8) | 27.0 (SD 1.9)a,c |
| EMCI− | 169 | 69.4 (SD 7.3)a | 83/86 | 16.1 (SD 2.5)b | 28.7 (SD 1.4)a |
| EMCI+ | 100 | 74.6 (SD 6.6)b,c | 65/35b,d | 15.5 (SD 2.9)a,d | 27.9 (SD 1.7)a,c |
| CN− | 137 | 72.7 (SD 6.2) | 70/67 | 16.8 (SD 2.5) | 29.1 (SD 1.2) |
| CN+ | 42 | 77.4 (SD 6.1)c | 18/24 | 16.1 (SD 2.6) | 29.0 (SD 1.0) |
Diagnostic groups were dichotomized into amyloid-positive (+) and amyloid-negative (−) subgroups based on a cortex to cerebellum AV45 standard uptake value ratio (SUVR) threshold of 1.362.
Key: AD, Alzheimer’s disease; CN, cognitively normal; EMCI, early stage MCI; F, female; LMCI, later stage MCI; M, male; MCI, mild cognitive impairment; MMSE, Mini Mental State Examination.
Significantly different (p < 0.01) from the control group of amyloid− CN−.
Significantly different (p < 0.05) from the control group of amyloid− CN−.
Significantly different (p < 0.01) from amyloid− subjects of same diagnostic category.
Significantly different (p < 0.05) from amyloid− subjects of same diagnostic category.
3.2. Volumetric measures
We compared accuracy of group discrimination between hippocampus and BFCS volumes based on the following 2 classifications: (1) clinical classification of AD dementia, LMCI, and EMCI subjects compared with CN; and (2) amyloid-based classification of amyloid+ AD dementia, LMCI, EMCI, and CN compared with the corresponding amyloid− groups.
The detailed findings of the receiver operating characteristics analysis and the comparison of AUCs between hippocampus and BFCS classifiers are shown in Fig. 2. AUC was significantly higher for bilateral hippocampi compared with the entire BFCS and the Ch4a–i subregion for all comparisons based on clinical diagnosis. However, AUC values for hippocampus were significantly smaller than for Ch4p in the AD group and did not differ between hippocampus and Ch4p in the remaining diagnostic groups.
Fig. 2.

Areas under receiver operating characteristics (ROC) curves for hippocampus and BFCS classifiers. Color-coded areas under ROC curves (AUC). Top: Comparisons of cognitively healthy elderly controls (CN) with Alzheimer’s disease (AD), late MCI (LMCI), and early MCI (EMCI). Middle: Amyloid-positive subjects with AD (AD+), late MCI (LMCI+), early MCI (EMCI+), and amyloid-positive LMCI, EMCI, and CN combined (MCI/HC+) versus the corresponding amyloid negative groups. Bottom: Amyloid-positive subjects stratified according to MMSE score versus the corresponding amyloid-negative subjects. Regions are in columns, corresponding to left/right hippocampus (hipp), the volume of the entire basal forebrain cholinergic system mask (BFCS) and the volumes of the Ch4a_i and Ch4p BFCS subregions. * AUC significantly higher for hippocampus volume than for BFCS and Ch4a_i volumes at p < 0.05. ** AUC significantly higher for hippocampus volume than for BFCS and Ch4a_i volumes at p < 0.01. AUC significantly higher for BFCS (sub)volume than for hippocampus volume at p < 0.05. ¶¶ AUC significantly higher for BFCS (sub)volume than for hippocampus volume at p < 0.001. (¶) AUC significantly higher for BFCS subvolume than for right hippocampus volume at p < 0.02, trend for left hippocampus (p < 0.1). [¶] AUC significantly higher for BFCS subvolume than for left hippocampus volume at p < 0.04, trend for right hippocampus (p < 0.08). n.s. AUC not significantly different between BFCS (sub)volume and bilateral hippocampus volumes. Abbreviations: BFCS, basal forebrain cholinergic system; Ch4a_i, anterior to anterior-intermediate Ch4; Ch4p, posterior Ch4; MCI, mild cognitive impairment; MMSE, Mini Mental State Examination.
In contrast, Ch4p volume yielded significantly larger AUC values than hippocampus volume for the separation of amyloid+ and amyloid− subjects in the EMCI and LMCI groups. Also, the AUCs for total BFCS volume and for Ch4a–i volume were significantly larger than the AUC for bilateral hippocampus volume when comparing amyloid− and amyloid+ subjects in the EMCI group, but not in the LMCI group. In CN and AD dementia subjects, all BFCS subregions reached classification levels similar to the classification accuracy of bilateral hippocampi volumes (Fig. 3).
Fig. 3.

Categorization based on hippocampus and BFCS volumes. Ch4p volumes are plotted against volumes of the left hippocampus. Volumetric measures are normalized to the total intracranial volume (TIV). Cutoffs for the markers were derived from the comparison of amyloid-positive AD dementia subjects and amyloid-negative control subjects maximizing the sum of sensitivity and specificity in a receiver operating characteristics analysis. The lower left and upper right quadrants represent areas of agreement between markers, the lower right and upper left quadrants are areas of marker disagreement. Abbreviations: AD, Alzheimer’s disease; BFCS, basal forebrain cholinergic system; Ch4p, posterior Ch4; EMCI−, amyloid-negative early MCI subjects; EMCI+, amyloid-positive early MCI subjects; LMCI−, amyloid-negative late MCI subjects; LMCI+, amyloid-positive late MCI subjects.
This pattern was confirmed using logistic regression models, controlling for age, sex, and center (Table 2): for the clinical classification, hippocampus volume was similar to Ch4a–i and Ch4p volumes in discriminating AD, and EMCI subjects from CN, but inferior in LMCI subjects. For the amyloid-based classification, in the early and late MCI groups and in the combined MCI and CN group, BFCS subregions were the only significant predictors discriminating between amyloid+andamyloid −subjects. In the AD and the CN group, none of the volumetric markers contributed significantly to the discrimination between amyloid+ and amyloid− subjects.
Table 2.
Logistic regression models, controlling for age, sex, and center
| Group | Left hipp. | Right hipp. | Ch4a–i | Ch4p | Accuracy |
|---|---|---|---|---|---|
| A: Clinical diagnosis as reference, irrespective of amyloid status, versus CN | |||||
| AD | Excluded | p < 0.021 | p < 0.020 | p < 0.001 | 94.7% |
| LMCI | Excluded | Excluded | Excluded | p < 0.001 | 80.6% |
| EMCI | Excluded | p < 0.045 | Excluded | p < 0.021 | 72.8% |
| B: Amyloid status as reference, stratified according to clinical diagnosis, versus amyloid | |||||
| AD+ | Excluded | Excluded | Excluded | Excluded | – |
| LMCI+ | Excluded | Excluded | p < 0.037 | Excluded | 77.2% |
| EMCI+ | Excluded | Excluded | p < 0.001 | Excluded | 79.9% |
| CN+ | Excluded | Excluded | Excluded | Excluded | – |
| MCI/CN+ | Excluded | Excluded | Excluded | p < 0.001 | 72.4% |
| C: Amyloid status as reference, stratified according to MMSE scores, versus amyloid | |||||
| MMSE 28/30 | Excluded | p < 0.031 | Excluded | p < 0.001 | 74.4% |
| MMSE 24/27 | Excluded | Excluded | Excluded | p < 0.001 | 82.0% |
| MMSE 19/23 | Excluded | Excluded | Excluded | Excluded | – |
A: Stepwise exclusion of hippocampus (hipp.), Ch4a–i, and Ch4p volumes from a logistic regression model, controlling for age and sex, for the comparisons between subjects with AD, LMCI, and EMCI versus CN.
B and C: Same logistic regression model for the comparison between amyloid-positive (+) and negative (−) subjects within diagnostic groups (B) or within groups defined on level of global cognition (C). AD+, LMCI+, EMCI+, CN+, and MCI/CN+ = amyloid+ subgroups of AD, late MCI, early MCI, CN, and LMCI, EMCI, and CN subjects combined. AD+, LMCI+, EMCI+, CN+, and MCI/CN+ = amyloid+ subgroups of AD, late MCI, early MCI, CN, and LMCI, EMCI, and CN combined.
Key: AD, Alzheimer’s disease; Ch4a–i, anterior to anterior intermediate Ch4; Ch4p, posterior Ch4; CN, cognitively normal; EMCI, early stage MCI; LMCI, later stage MCI; MCI, mild cognitive impairment; MMSE, Mini Mental State Examination.
In a complementary analysis for the classification of amyloid status, we stratified our subjects not according to clinical diagnosis but according to cognitive performance using MMSE scores. Based on the probability density function of MMSE scores across the entire sample (Supplementary Fig. 2), we identified MMSE cutoff points, defining high (MMSE 28–30, inclusive; n = 445), intermediate (MMSE 24–27, inclusive; n = 172), and low (MMSE 19–23, inclusive; n = 53) cognitive strata. In AUC analysis, Ch4p and total BFCS volume were significantly more accurate than hippocampus volume to discriminate between amyloid+ and amyloid− subjects within the high MMSE stratum. In the remaining MMSE strata, hippocampus volume and subregional BFCS volumes were not significantly different in predicting amyloid status. In logistic regression analysis, Ch4p was the main determinant for amyloid status in high and intermediate MMSE classes, with only minor contribution of hippocampus volume. In the low MMSE class, only Ch4a–i yielded significant discrimination between amyloid− and amyloid+ subjects.
4. Discussion
We determined the association of hippocampus and BFCS volume with amyloid burden and clinical diagnosis in a large sample of elderly subjects spanning the range from cognitively unimpaired aging to AD dementia. Previous evidence indicates only a limited association of hippocampus volume with global cortical and regional amyloid burden (Apostolova et al., 2010; Becker et al., 2011), but a strong association with episodic memory impairment in MCI (Grothe et al., 2010; Mortimer et al., 2004; Reitz et al., 2009; Teipel et al., 2010); in contrast, cholinergic system changes have been found associated with cortical amyloid accumulation in animal models (Beach, 2008; Boncristiano et al., 2002) and in postmortem studies in humans (Arendt et al., 1984; Potter et al., 2011). Based on these findings, we hypothesized that BFCS atrophy would be superior to hippocampus atrophy in predicting cortical amyloid burden, and hippocampus atrophy would be more accurate in predicting cognitive status.
Consistent with our primary hypothesis, total BFCS, and nucleus basalis of Meynert (Ch4a–i and Ch4p) volumes were superior to hippocampus volume in predicting amyloid status in early and late MCI subjects. Consistent with our secondary hypothesis, we found significantly higher diagnostic accuracy of hippocampus volume compared with global BFCS volume to discriminate early and late MCI subjects from CN. Surprisingly, volume of posterior basal forebrain (Ch4p) was not only more accurate in predicting amyloid status, but was also significantly more accurate than hippocampus volume in predicting AD dementia compared with CN, and was similar to hippocampus in predicting a clinical diagnosis of late or early MCI compared with CN.
In logistic regression analyses controlling for age, sex, and center, BFCS volumes were the main determinants for amyloid status and clinical diagnosis in late and early MCI. Consistent with our hypotheses, hippocampus volume contributed significantly to a prediction model based on Ch4p for the discrimination of AD dementia and late MCI from CN, but not to any model considering amyloid status as outcome, except a minor contribution in the high MMSE subgroup.
4.1. Prediction of cortical amyloid load
With respect to group discrimination according to amyloid status, hippocampus volume reached an AUC between 0.64 (EMCI) and 0.58 (LMCI) for discriminating amyloid+ and amyloid− subjects. In addition, when entered together with BFCS volumes, hippocampus volume did not significantly contribute to group discrimination in logistic regression models. These findings agree with previous imaging studies that found no significant differences of hippocampus volumes between amyloid+ and amyloid− CN and MCI subjects (Becker et al., 2011; La Joie et al., 2012). In addition, a previous voxel-based study revealed a regional dissociation between Pittsburgh compound B (PIB) accumulation and hippocampus atrophy when comparing AD dementia with CN (Jack et al., 2008). A longitudinal study on rates of PIB uptake and hippocampus atrophy found increasing rates of hippocampus atrophy in MCI converters and nonconverters, but a significant increase of PIB uptake only in MCI nonconverters over a 2-year follow-up (Koivunen et al., 2011). Similarly, amyloid load was interpolated to peak at least 1 decade before hippocampus atrophy based on longitudinal follow-up data in CN, MCI, and AD dementia subjects (Villemagne et al., 2013). The longitudinal findings suggest in early stages of AD dementia a saturation of amyloid uptake, but still ongoing hippocampus atrophy. The neurobiological basis of these effects is still widely unexplored. However, a range of postmortem autopsy studies suggest a stronger association of hippocampus volume with neurofibrillary tangle load than with senile plaque load (Csernansky et al., 2004; Silbert et al., 2003). According to the currently widely held model of AD pathogenesis, neurofibrillary tangle formation is secondary to amyloid plaque accumulation (Hardy, 2006), suggesting that taurelated atrophy might follow amyloid accumulation with a temporal delay and might also be regionally dissociated. An alternative account of recent findings would suggest that amyloid changes and tau pathology evolve as partly independent, but synergistic processes in AD pathogenesis (Duyckaerts, 2011), in which tau pathology in the transentorhinal and hippocampus region is an early but not the first event in AD pathology (Grinberg et al., 2009), leaving space for further dynamic processes of hippocampus atrophy in the course of manifest disease.
In contrast, BFCS volumes, particularly Ch4p, were associated with cortical amyloid load in LMCI and EMCI subjects with an AUC between 0.64 and 0.71. In addition, only BFCS volumes contributed to the discrimination of amyloid+ and amyloid− subjects in logistic regression models. Animal studies suggest a close interaction between cholinergic system integrity and amyloid accumulation. Cortical cholinergic deafferentiation provokes formation of amyloid in cortical projection areas (Beach, 2008; Leanza, 1998). Conversely, cortical amyloid accumulation in transgenic animals, mimicking AD-related amyloid formation, leads to decline of cholinergic cortical innervation, although not consistently to cholinergic neuronal loss in basal forebrain nuclei (Aucoin et al., 2005; Christensen et al., 2010). These findings also agree with the inverse association between cortical amyloid load and choline acetyltransferase activity in postmortem human autopsy studies of AD dementia (Ikonomovic et al., 2011) and asymptomatic subjects (Beach et al., 2000; Potter et al., 2011).
To more clearly dissociate the clinical- and the amyloid-based categorization, we determined the accuracy for the identification of amyloid status in subgroups stratified according to global cognitive performance (determined according to MMSE score) irrespective of clinical diagnosis. The results of this analysis were consistent with those on amyloid status detection stratified according to clinical diagnosis. In all except the most severely impaired categories, posterior BFCS subnuclei volume (Ch4p) was the major significant contributor among all volumetric markers used to group classification based on amyloid status. The cognitively most severely impaired subjects with an MMSE less than 24 (almost entirely overlapping with the AD dementia group) showed no significant discrimination of amyloid status based on any volumetric marker. This finding agrees with the assumption that, in dementia stages, degree of cognitive impairment is driven by downstream changes such as progressing regional atrophy, but no more by primary amyloid accumulation (Landau et al., 2012).
4.2. Accuracy of clinical group discrimination
With respect to diagnostic group discrimination compared with CN, hippocampus volume reached diagnostic accuracy between an AUC of 0.89 for AD dementia and 0.58 for early MCI, similar to levels of group discrimination in independent studies (Muller et al., 2007; Teipel et al., 2010; Walhovd et al., 2010). These levels of accuracy agree with the broad evidence for a strong association of hippocampus volume with measures of episodic memory (Sarazin et al., 2010), a key criterion for the clinical discrimination between CN and MCI subjects (Dubois et al., 2007).
The AUC for the entire BFCS volume and the anterior subnuclei of the nucleus basalis of Meynert (Ch4a–i) were approximately 0.77 for the discrimination of AD subjects from CN and approximately 0.65 for the discrimination of LMCI subjects from CN. Data on diagnostic accuracy of BFCS in AD are limited. In a previous independent sample, total BFCS volume reached AUC values of 0.81 for the discrimination of 28 AD dementia subjects and 0.69 for the discrimination of 69 MCI subjects from 95 age-matched CN (Grothe et al., 2012). In the present study, discrimination accuracy for BFCS and Ch4a–i volumes was significantly inferior to accuracy based on hippocampus volume. In contrast, volumes of the posterior BFCS nuclei (Ch4p) were at least as accurate as hippocampus volumes in discriminating AD, LMCI, and EMCI from CN, reaching AUC values of up to 0.92. In logistic regression analysis, the Ch4p region was the only volumetric measure that provided significant group discrimination between the EMCI and CN groups. The stronger effect in Ch4p than in the more anterior BFCS regions agrees with several neuropathological studies that found cholinergic atrophy in AD to be more pronounced in the Ch4p compartment compared with other BFCS subnuclei (Vogels et al., 1990). It further agrees with previous in vivo imaging results from 3 independent cross-sectional and 1 longitudinal sample suggesting predominant posterior BFCS involvement in amnestic MCI (Grothe et al., 2010, 2012, 2013; Teipel et al., 2011) with spreading of atrophy to more anterior BFCS areas in the dementia stage of AD.
It is unresolved whether the atrophic changes of Ch4p follow or precede the pathological involvement of the cortical projection areas. In the human brain there is only indirect evidence for a corticotopic projection pattern of the BFCS (Mesulam and Geula, 1988; Selden et al., 1998). However, axonal transport experiments combined with immunocytochemistry in rhesus monkeys suggest that the Ch4p neurons primarily project to the superior temporal and temporopolar cortex (Mesulam et al., 1983a). The temporal cortex exhibits highly pronounced depletion of cortical cholinergic markers in AD as demonstrated in neurochemical postmortem examinations and in vivo molecular imaging studies (Herholz et al., 2004; Kuhl et al., 1996; Svensson et al., 1997). The differential distribution of cholinergic marker reductions within the temporal cortex is poorly described; however, superior temporal lobe and temporal pole were strongly involved in previous molecular imaging studies (Haense et al., 2012; Iyo et al., 1997; Kendziorra et al., 2011) and in 1 postmortem study using tyrosine kinase receptor type 1 (TrkA) as an indirect measure of cortical cholinergic innervation (Counts et al., 2004).
Previous studies suggest that activity of the cholinergic marker enzymes, choline acetyltransferase and acetylcholinesterase, are preserved or even increased in the cortical areas at predementia stages and early stages of AD (Davis et al., 1999; DeKosky et al., 2002). These findings are believed to reflect compensatory processes of select hippocampal and cortical cholinergic projection systems (Ikonomovic et al., 2011; Mufson et al., 2012). More recent findings suggest that cortical choline acetyltransferase and M1 receptor coupling are significantly decreased in nondemented elderly subjects with amyloid plaques and are more pronounced in subjects with AD and dementia (Potter et al., 2011). In addition, several lines of evidence support an early evolvement of neurofibrillary tangle pathology and axonal degeneration in the BFCS in AD (Geula et al., 2008; Mesulam, 2004; Sassin et al., 2000). In conclusion, the question of the time of onset of cortical cholinergic dysfunction in AD can not yet finally be resolved because dependent on the stage of disease, mechanisms of degeneration might be partly compensated by functional upregulation of cholinergic activity in remaining axons and synapses (Ikonomovic et al., 2007). Even if cell numbers of the BFCS are preserved in early stages of disease there is indication of cell shrinkage and axonal degeneration that might underlie the positive signal of regional atrophy, detected using MRI in this and previous studies in predementia AD.
4.3. Limitations
There are several limitations of our study. First, the results depend, in part, on the selection of the threshold for amyloid classification. The threshold used in our study corresponds to a threshold from a previous study indicating pathologically relevant amyloid accumulation (Fleisher et al., 2011). At a lower amyloid threshold, the effect of BFCS volume to predict amyloid status compared with hippocampus volume became lower; at higher thresholds, the results became even more pronounced (data not shown). This finding might indicate that a minimum amount of cortical amyloid is required to exert a significant effect on BFCS volume.
Second, a proportion of 14% of the subjects in our AD sample were amyloid−. This compares with a previously reported percentage of amyloid− subjects in clinically defined AD dementia samples ranging between 0 and 20% (Fleisher et al., 2011; Hatashita and Yamasaki, 2010; Klunk et al., 2004; Rowe et al., 2007; Schipke et al., 2012; Villain et al., 2012). The variability in rates of amyloid− subjects across studies might be related to the selected amyloid threshold, sample size (as is the case in many studies that had sample sizes of AD patients less than n = 20), selection bias (e.g., by using amyloid marker or apolipoprotein ε4 for diagnostic categorization), and sensitivity of imaging techniques. An important factor, however, is misdiagnosis of subjects as AD cases. In a previous study on 63 subjects diagnosed with clinically probable AD, 10 subjects were amyloid− according to PIB-PET and additionally showed a CSF amyloid and tau protein signature that was atypical for AD (Shimada et al., 2011). So, clinical diagnosis of AD and amyloid positivity do not always concur, but autopsy data and longitudinal studies are still widely lacking to better understand the pathological basis of cognitive decline in amyloid− clinically AD subjects. A small fraction of amyloid− AD cases can be related to rare conditions, such as carriers of the Arctic amyloid precursor protein (APP) mutation leading to reduced agglomeration of amyloid (Scholl et al., 2012). This will, however, not account for most of the amyloid− AD cases. The lack of a difference in volumetric measures between amyloid+ and amyloid− AD groups in our study indicates that, irrespective of the underlying cause of dementia, the cognitive changes that drive the clinical diagnosis are associated with the regional pattern of brain atrophy.
Third, we used an indirect measure for the integrity of the basal forebrain cholinergic system (BFCS) based on postmortem mapping of cholinergic nuclei. The anatomical validity of our BFCS measure is supported by the large regional overlap between 3 independently defined masks, the first mask based on 1 postmortem brain in formalin space (Teipel et al., 2005), a probabilistic mask based on 10 brains in formalin space (Zaborszky et al., 2008), and the mask used here, based on 1 postmortem brain in in cranio space (Teipel et al., 2013). Specifically, the peak coordinates of the probabilistic mask lay within the cholinergic subnuclei of the presently used mask.
Fourth, we did not perform multiple comparison correction for the AUC comparisons. As an overall test for the difference of AUCs between basal forebrain and hippocampus volumes we determined the effect of amyloid status across all diagnostic groups (AD/MCI/CN+ vs. AD/MCI/CN−). We found a highly significant effect for AUC of Ch4p (0.73) being larger than the AUC for right and left hippocampus (0.66) at p < 0.0001. The subsequent pairwise comparisons between amyloid+ and amyloid− diagnostic subgroups represent dependent post hoc tests.
Fifth, our comparison of BFCS and hippocampus volumetry might potentially underestimate the role of hippocampus volume, because we did not consider hippocampus subvolumes that might carry higher diagnostic accuracy than the total hippocampus volume (Hanseeuw et al., 2011). Hippocampus subfield segmentation is most reliably performed using high-resolution T2-weighted scans (Pluta et al., 2012; Yushkevich et al., 2010) that are not yet widely available, but might become an interesting addendum to future large-scale multimodal imaging networks.
Finally, based on the notion that EMCI subjects perform at a level between CN and LMCI subjects in episodic memory, it is reasonable to assume that EMCI is a transition stage between healthy aging and LMCI. However, evidence for this assumption is yet widely lacking. The higher prevalence of amyloid− subjects in the EMCI compared with the LMCI sample shows that EMCI is an even more heterogeneous concept than is MCI or LMCI.
4.4. Summary
In summary, classification into amyloid− and amyloid+ categories was significantly more accurate based on BFCS volume, particularly volume of the posterior nucleus basalis of Meynert, than on hippocampus volume in cognitively unimpaired and mildly impaired subjects. In contrast, we found a better classification of subjects into clinically defined diagnostic categories of AD dementia, LMCI, and EMCI compared with healthy aging, based on hippocampus volumetry than on whole BFCS volume or anterior nucleus basalis of Meynert volume. In addition, Ch4p volumewas at least as accurate as hippocampus volume for prediction of clinical diagnoses. From a clinical point of view, our data suggest that BFCS volumetry is superior to hippocampus volume to predict cortical amyloid accumulation in MCI, and of similar accuracy for classification into clinical categories. Volumetric measurements based on MRI scans are much more broadly available in clinical care than fludeoxyglucose-PET or amyloid PET. Hippocampus volumetry is entering application as a biomarker of AD in specialized clinical care outside of pure experimental settings (Teipel et al., unpublished). Compared with hippocampus volumetry, BFCS volumetry is less easily available and there is less experience on its multicenter stability. Therefore, BFCS volumetry is still a research tool to study the relative contribution of BFCS changes to cognitive decline in the elderly. However, our data are promising because they suggest that BFCS might be a better structural proxy of cortical amyloid load than hippocampus volumetry. Along this line, BFCS volumetry might provide an additional measure of amyloid-related structural degeneration that might usefully be used together with other biomarkers, such as CSF amyloid-β42 or even amyloid-β blood tests in the future.
Supplementary Material
Acknowledgments
Data used in preparation of this article were obtained from the Alzheimer’s Disease Neuroimaging Initiative (ADNI) database (adni.loni.ucla.edu). As such, the investigators within the ADNI contributed to the design and implementation of ADNI and/or provided data but did not participate in analysis or writing of this report. A complete listing of ADNI investigators can be found at: http://adni.loni.usc.edu/about/centers-cores/study-sites/
Data collection and sharing for this project was funded by the ADNI (National Institutes of Health Grant U01 AG024904). ADNI is funded by the National Institute on Aging, the National Institute of Biomedical Imaging and Bioengineering, and through generous contributions from the following: Alzheimer’s Association; Alzheimer’s Drug Discovery Foundation; BioClinica, Inc; Biogen Idec Inc; Bristol-Myers Squibb Company; Eisai Inc; Elan Pharmaceuticals, Inc; Eli Lilly and Company; F. Hoffmann-La Roche Ltd and its affiliated company Genentech, Inc; GE Healthcare; Innogenetics, N.V.; IXICO Ltd; Janssen Alzheimer Immunotherapy Research & Development, L.L.C.; Johnson & Johnson Pharmaceutical Research & Development, L.L.C.; Medpace, Inc; Merck & Co, Inc; Meso Scale Diagnostics, L.L.C.; NeuroRx Research; Novartis Pharmaceuticals Corporation; Pfizer Inc; Piramal Imaging; Servier; Synarc Inc; and Takeda Pharmaceutical Company.
The Canadian Institutes of Health Research is providing funds to support ADNI clinical sites in Canada. Private sector contributions are facilitated by the Foundation for the National Institutes of Health (www.fnih.org). The grantee organization is the Northern California Institute for Research and Education, and the study is coordinated by the Alzheimer’s Disease Cooperative Study at the University of California, San Diego. ADNI data are disseminated by the Laboratory for Neuro Imaging at the University of California, Los Angeles. This research was also supported by National Institutes of Health grants P30 AG010129 and K01 G030514. Part of this work was supported by grants from the Interdisciplinary Faculty, Department Aging of the Individual and the Society, University of Rostock, to S.T. and of the Medical Faculty, University Rostock to S.T.
Appendix A. Supplementary data
Supplementary data associated with this article can be found, in the online version, at http://dx.doi.org/10.1016/j.neurobiolaging.2013.09.029.
Footnotes
Disclosure statement
The authors have no actual or potential conflicts of interest. Within the ADNI framework, all investigations were done after written informed consent was obtained by the proband or his/her durable holder of the power of attorney. The study has been approved by the IRB of the site of the study prinicipal investigator and the IRBS of each participating site.
References
- Apostolova LG, Hwang KS, Andrawis JP, Green AE, Babakchanian S, Morra JH, Cummings JL, Toga AW, Trojanowski JQ, Shaw LM, Jack CR, Jr, Petersen RC, Aisen PS, Jagust WJ, Koeppe RA, Mathis CA, Weiner MW, Thompson PM. 3D PIB and CSF biomarker associations with hippocampal atrophy in ADNI subjects. Neurobiol Aging. 2010;31:1284–1303. doi: 10.1016/j.neurobiolaging.2010.05.003. [DOI] [PMC free article] [PubMed] [Google Scholar]
- Arendt T, Bigl V, Tennstedt A, Arendt A. Correlation between cortical plaque count and neuronal loss in the nucleus basalis in Alzheimer’s disease. Neurosci Lett. 1984;48:81–85. doi: 10.1016/0304-3940(84)90292-1. [DOI] [PubMed] [Google Scholar]
- Ashburner J. A fast diffeomorphic image registration algorithm. Neuroimage. 2007;38:95–113. doi: 10.1016/j.neuroimage.2007.07.007. [DOI] [PubMed] [Google Scholar]
- Aucoin JS, Jiang P, Aznavour N, Tong XK, Buttini M, Descarries L, Hamel E. Selective cholinergic denervation, independent from oxidative stress, in a mouse model of Alzheimer’s disease. Neuroscience. 2005;132:73–86. doi: 10.1016/j.neuroscience.2004.11.047. [DOI] [PubMed] [Google Scholar]
- Barthel H, Gertz HJ, Dresel S, Peters O, Bartenstein P, Buerger K, Hiemeyer F, Wittemer-Rump SM, Seibyl J, Reininger C, Sabri O. Cerebral amyloid-beta PET with florbetaben (18F) in patients with Alzheimer’s disease and healthy controls: a multicentre phase 2 diagnostic study. Lancet Neurol. 2011;10:424–435. doi: 10.1016/S1474-4422(11)70077-1. [DOI] [PubMed] [Google Scholar]
- Beach TG. Physiologic origins of age-related beta-amyloid deposition. Neurodegener Dis. 2008;5:143–145. doi: 10.1159/000113685. [DOI] [PubMed] [Google Scholar]
- Beach TG, Kuo YM, Spiegel K, Emmerling MR, Sue LI, Kokjohn K, Roher AE. The cholinergic deficit coincides with Abeta deposition at the earliest histopathologic stages of Alzheimer disease. J Neuropathol Exp Neurol. 2000;59:308–313. doi: 10.1093/jnen/59.4.308. [DOI] [PubMed] [Google Scholar]
- Becker JA, Hedden T, Carmasin J, Maye J, Rentz DM, Putcha D, Fischl B, Greve DN, Marshall GA, Salloway S, Marks D, Buckner RL, Sperling RA, Johnson KA. Amyloid-beta associated cortical thinning in clinically normal elderly. Ann Neurol. 2011;69:1032–1042. doi: 10.1002/ana.22333. [DOI] [PMC free article] [PubMed] [Google Scholar]
- Boncristiano S, Calhoun ME, Kelly PH, Pfeifer M, Bondolfi L, Stalder M, Phinney AL, Abramowski D, Sturchler-Pierrat C, Enz A, Sommer B, Staufenbiel M, Jucker M. Cholinergic changes in the APP23 transgenic mouse model of cerebral amyloidosis. J Neurosci. 2002;22:3234–3243. doi: 10.1523/JNEUROSCI.22-08-03234.2002. [DOI] [PMC free article] [PubMed] [Google Scholar]
- Bourgeat P, Chetelat G, Villemagne VL, Fripp J, Raniga P, Pike K, Acosta O, Szoeke C, Ourselin S, Ames D, Ellis KA, Martins RN, Masters CL, Rowe CC, Salvado O. Beta-amyloid burden in the temporal neocortex is related to hippocampal atrophy in elderly subjects without dementia. Neurology. 2010;74:121–127. doi: 10.1212/WNL.0b013e3181c918b5. [DOI] [PubMed] [Google Scholar]
- Braak H, Braak E. Frequency of stages of Alzheimer-related lesions in different age categories. Neurobiol Aging. 1997;18:351–357. doi: 10.1016/s0197-4580(97)00056-0. [DOI] [PubMed] [Google Scholar]
- Chetelat G, Villemagne VL, Bourgeat P, Pike KE, Jones G, Ames D, Ellis KA, Szoeke C, Martins RN, O’Keefe GJ, Salvado O, Masters CL, Rowe CC. Relationship between atrophy and beta-amyloid deposition in Alzheimer disease. Ann Neurol. 2010a;67:317–324. doi: 10.1002/ana.21955. [DOI] [PubMed] [Google Scholar]
- Chetelat G, Villemagne VL, Pike KE, Baron JC, Bourgeat P, Jones G, Faux NG, Ellis KA, Salvado O, Szoeke C, Martins RN, Ames D, Masters CL, Rowe CC. Larger temporal volume in elderly with high versus low beta-amyloid deposition. Brain. 2010b;133:3349–3358. doi: 10.1093/brain/awq187. [DOI] [PubMed] [Google Scholar]
- Christensen DZ, Bayer TA, Wirths O. Intracellular Abeta triggers neuron loss in the cholinergic system of the APP/PS1KI mouse model of Alzheimer’s disease. Neurobiol Aging. 2010;31:1153–1163. doi: 10.1016/j.neurobiolaging.2008.07.022. [DOI] [PubMed] [Google Scholar]
- Counts SE, Nadeem M, Wuu J, Ginsberg SD, Saragovi HU, Mufson EJ. Reduction of cortical TrkA but not p75(NTR) protein in early-stage Alzheimer’s disease. Ann Neurol. 2004;56:520–531. doi: 10.1002/ana.20233. [DOI] [PubMed] [Google Scholar]
- Csernansky JG, Hamstra J, Wang L, McKeel D, Price JL, Gado M, Morris JC. Correlations between antemortem hippocampal volume and postmortem neuropathology in AD subjects. Alzheimer Dis Assoc Disord. 2004;18:190–195. [PubMed] [Google Scholar]
- Davis KL, Mohs RC, Marin D, Purohit DP, Perl DP, Lantz M, Austin G, Haroutunian V. Cholinergic markers in elderly patients with early signs of Alzheimer disease. JAMA. 1999;281:1401–1406. doi: 10.1001/jama.281.15.1401. [DOI] [PubMed] [Google Scholar]
- DeKosky ST, Ikonomovic MD, Styren SD, Beckett L, Wisniewski S, Bennett DA, Cochran EJ, Kordower JH, Mufson EJ. Upregulation of choline acetyltransferase activity in hippocampus and frontal cortex of elderly subjects with mild cognitive impairment. Ann Neurol. 2002;51:145–155. doi: 10.1002/ana.10069. [DOI] [PubMed] [Google Scholar]
- Desikan RS, Segonne F, Fischl B, Quinn BT, Dickerson BC, Blacker D, Buckner RL, Dale AM, Maguire RP, Hyman BT, Albert MS, Killiany RJ. An automated labeling system for subdividing the human cerebral cortex on MRI scans into gyral based regions of interest. Neuroimage. 2006;31:968–980. doi: 10.1016/j.neuroimage.2006.01.021. [DOI] [PubMed] [Google Scholar]
- Dubois B, Feldman HH, Jacova C, Dekosky ST, Barberger-Gateau P, Cummings J, Delacourte A, Galasko D, Gauthier S, Jicha G, Meguro K, O’Brien J, Pasquier F, Robert P, Rossor M, Salloway S, Stern Y, Visser PJ, Scheltens P. Research criteria for the diagnosis of Alzheimer’s disease: revising the NINCDS-ADRDA criteria. Lancet Neurol. 2007;6:734–746. doi: 10.1016/S1474-4422(07)70178-3. [DOI] [PubMed] [Google Scholar]
- Duyckaerts C. Tau pathology in children and young adults: can you still be unconditionally baptist? Acta Neuropathol. 2011;121:145–147. doi: 10.1007/s00401-010-0794-7. [DOI] [PubMed] [Google Scholar]
- Fleisher AS, Chen K, Liu X, Roontiva A, Thiyyagura P, Ayutyanont N, Joshi AD, Clark CM, Mintun MA, Pontecorvo MJ, Doraiswamy PM, Johnson KA, Skovronsky DM, Reiman EM. Using positron emission tomography and florbetapir F18 to image cortical amyloid in patients with mild cognitive impairment or dementia due to Alzheimer disease. Arch Neurol. 2011;68:1404–1411. doi: 10.1001/archneurol.2011.150. [DOI] [PubMed] [Google Scholar]
- Geula C, Nagykery N, Nicholas A, Wu CK. Cholinergic neuronal and axonal abnormalities are present early in aging and in Alzheimer disease. J Neuropathol Exp Neurol. 2008;67:309–318. doi: 10.1097/NEN.0b013e31816a1df3. [DOI] [PMC free article] [PubMed] [Google Scholar]
- Grinberg LT, Rub U, Ferretti RE, Nitrini R, Farfel JM, Polichiso L, Gierga K, Jacob-Filho W, Heinsen H. The dorsal raphe nucleus shows phospho-tau neurofibrillary changes before the transentorhinal region in Alzheimer’s disease. A precocious onset? Neuropathol Appl Neurobiol. 2009;35:406–416. doi: 10.1111/j.1365-2990.2009.00997.x. [DOI] [PubMed] [Google Scholar]
- Grothe M, Ewers M, Krause B, Heinsen H, Teipel SJ. Basal forebrain atrophy and cortical amyloid deposition in nondemented elderly subjects. Alzheimers Dement. 2013 doi: 10.1016/j.jalz.2013.09.011. in press. [DOI] [PMC free article] [PubMed] [Google Scholar]
- Grothe M, Heinsen H, Teipel S. Longitudinal measures of cholinergic forebrain atrophy in the transition from healthy aging to Alzheimer’s disease. Neurobiol Aging. 2013;34:1210–1220. doi: 10.1016/j.neurobiolaging.2012.10.018. [DOI] [PMC free article] [PubMed] [Google Scholar]
- Grothe M, Heinsen H, Teipel SJ. Atrophy of the cholinergic basal forebrain over the adult age range and in early stages of Alzheimer’s disease. Biol Psychiatry. 2012;71:805–813. doi: 10.1016/j.biopsych.2011.06.019. [DOI] [PMC free article] [PubMed] [Google Scholar]
- Grothe M, Zaborszky L, Atienza M, Gil-Neciga E, Rodriguez-Romero R, Teipel SJ, Amunts K, Suarez-Gonzalez A, Cantero JL. Reduction of basal forebrain cholinergic system parallels cognitive impairment in patients at high risk of developing Alzheimer’s disease. Cereb Cortex. 2010;20:1685–1695. doi: 10.1093/cercor/bhp232. [DOI] [PMC free article] [PubMed] [Google Scholar]
- Haense C, Kalbe E, Herholz K, Hohmann C, Neumaier B, Krais R, Heiss WD. Cholinergic system function and cognition in mild cognitive impairment. Neurobiol Aging. 2012;33:867–877. doi: 10.1016/j.neurobiolaging.2010.08.015. [DOI] [PubMed] [Google Scholar]
- Hammers A, Allom R, Koepp MJ, Free SL, Myers R, Lemieux L, Mitchell TN, Brooks DJ, Duncan JS. Three-dimensional maximum probability atlas of the human brain, with particular reference to the temporal lobe. Hum Brain Mapp. 2003;19:224–247. doi: 10.1002/hbm.10123. [DOI] [PMC free article] [PubMed] [Google Scholar]
- Hanley JA, McNeil BJ. A method of comparing the areas under receiver operating characteristics curves derived from the same cases. Radiology. 1983;148:839–843. doi: 10.1148/radiology.148.3.6878708. [DOI] [PubMed] [Google Scholar]
- Hanseeuw BJ, Van Leemput K, Kavec M, Grandin C, Seron X, Ivanoiu A. Mild cognitive impairment: differential atrophy in the hippocampal subfields. AJNR Am J Neuroradiol. 2011;32:1658–1661. doi: 10.3174/ajnr.A2589. [DOI] [PMC free article] [PubMed] [Google Scholar]
- Hardy J. Alzheimer’s disease: the amyloid cascade hypothesis: an update and reappraisal. J Alzheimers Dis. 2006;9 (3 suppl):151–153. doi: 10.3233/jad-2006-9s317. [DOI] [PubMed] [Google Scholar]
- Hatashita S, Yamasaki H. Clinically different stages of Alzheimer’s disease associated by amyloid deposition with [11C]-PIB PET imaging. J Alzheimers Dis. 2010;21:995–1003. doi: 10.3233/JAD-2010-100222. [DOI] [PubMed] [Google Scholar]
- Heinsen H, Hampel H, Teipel SJ. Computer-assisted 3D reconstruction of the Nucleus basalis complex, including the Nucleus subputaminalis. Brain. 2006;129:E43. [Google Scholar]
- Herholz K, Weisenbach S, Zundorf G, Lenz O, Schroder H, Bauer B, Kalbe E, Heiss WD. In vivo study of acetylcholine esterase in basal forebrain, amygdala, and cortex in mild to moderate Alzheimer disease. Neuroimage. 2004;21:136–143. doi: 10.1016/j.neuroimage.2003.09.042. [DOI] [PubMed] [Google Scholar]
- Ikonomovic MD, Abrahamson EE, Isanski BA, Wuu J, Mufson EJ, DeKosky ST. Superior frontal cortex cholinergic axon density in mild cognitive impairment and early Alzheimer disease. Arch Neurol. 2007;64:1312–1317. doi: 10.1001/archneur.64.9.1312. [DOI] [PubMed] [Google Scholar]
- Ikonomovic MD, Klunk WE, Abrahamson EE, Wuu J, Mathis CA, Scheff SW, Mufson EJ, DeKosky ST. Precuneus amyloid burden is associated with reduced cholinergic activity in Alzheimer disease. Neurology. 2011;77:39–47. doi: 10.1212/WNL.0b013e3182231419. [DOI] [PMC free article] [PubMed] [Google Scholar]
- Iyo M, Namba H, Fukushi K, Shinotoh H, Nagatsuka S, Suhara T, Sudo Y, Suzuki K, Irie T. Measurement of acetylcholinesterase by positron emission tomography in the brains of healthy controls and patients with Alzheimer’s disease. Lancet. 1997;349:1805–1809. doi: 10.1016/S0140-6736(96)09124-6. [DOI] [PubMed] [Google Scholar]
- Jack CR, Jr, Lowe VJ, Senjem ML, Weigand SD, Kemp BJ, Shiung MM, Knopman DS, Boeve BF, Klunk WE, Mathis CA, Petersen RC. 11C PiB and structural MRI provide complementary information in imaging of Alzheimer’s disease and amnestic mild cognitive impairment. Brain. 2008;131:665–680. doi: 10.1093/brain/awm336. [DOI] [PMC free article] [PubMed] [Google Scholar]
- Kendziorra K, Wolf H, Meyer PM, Barthel H, Hesse S, Becker GA, Luthardt J, Schildan A, Patt M, Sorger D, Seese A, Gertz HJ, Sabri O. Decreased cerebral alpha4beta2* nicotinic acetylcholine receptor availability in patients with mild cognitive impairment and Alzheimer’s disease assessed with positron emission tomography. Eur J Nucl Med Mol Imag. 2011;38:515–525. doi: 10.1007/s00259-010-1644-5. [DOI] [PubMed] [Google Scholar]
- Klunk WE, Engler H, Nordberg A, Wang Y, Blomqvist G, Holt DP, Bergstrom M, Savitcheva I, Huang GF, Estrada S, Ausen B, Debnath ML, Barletta J, Price JC, Sandell J, Lopresti BJ, Wall A, Koivisto P, Antoni G, Mathis CA, Langstrom B. Imaging brain amyloid in Alzheimer’s disease with Pittsburgh compound-B. Ann Neurol. 2004;55:306–319. doi: 10.1002/ana.20009. [DOI] [PubMed] [Google Scholar]
- Koivunen J, Scheinin N, Virta JR, Aalto S, Vahlberg T, Nagren K, Helin S, Parkkola R, Viitanen M, Rinne JO. Amyloid PET imaging in patients with mild cognitive impairment: a 2-year follow-up study. Neurology. 2011;76:1085–1090. doi: 10.1212/WNL.0b013e318212015e. [DOI] [PubMed] [Google Scholar]
- Kuhl DE, Minoshima S, Fessler JA, Frey KA, Foster NL, Ficaro EP, Wieland DM, Koeppe RA. In vivo mapping of cholinergic terminals in normal aging, Alzheimer’s disease, and Parkinson’s disease. Ann Neurol. 1996;40:399–410. doi: 10.1002/ana.410400309. [DOI] [PubMed] [Google Scholar]
- La Joie R, Perrotin A, Barre L, Hommet C, Mezenge F, Ibazizene M, Camus V, Abbas A, Landeau B, Guilloteau D, de La Sayette V, Eustache F, Desgranges B, Chetelat G. Region-specific hierarchy between atrophy, hypometabolism, and beta-amyloid (Abeta) load in Alzheimer’s disease dementia. J Neurosci. 2012;32:16265–16273. doi: 10.1523/JNEUROSCI.2170-12.2012. [DOI] [PMC free article] [PubMed] [Google Scholar]
- Landau SM, Mintun MA, Joshi AD, Koeppe RA, Petersen RC, Aisen PS, Weiner MW, Jagust WJ. Amyloid deposition, hypometabolism, and longitudinal cognitive decline. Ann Neurol. 2012;72:578–586. doi: 10.1002/ana.23650. [DOI] [PMC free article] [PubMed] [Google Scholar]
- Leanza G. Chronic elevation of amyloid precursor protein expression in the neocortex and hippocampus of rats with selective cholinergic lesions. Neurosci Lett. 1998;257:53–56. doi: 10.1016/s0304-3940(98)00744-7. [DOI] [PubMed] [Google Scholar]
- Mann DM, Yates PO, Marcyniuk B. Changes in nerve cells of the nucleus basalis of Meynert in Alzheimer’s disease and their relationship to ageing and to the accumulation of lipofuscin pigment. Mech Ageing Dev. 1984;25:189–204. doi: 10.1016/0047-6374(84)90140-4. [DOI] [PubMed] [Google Scholar]
- McKhann G, Drachman D, Folstein M, Katzman R, Price D, Stadlan EM. Clinical diagnosis of Alzheimer’s disease: report of the NINCDS-ADRDA Work Group under the auspices of the Department of Health and Human Services Task Force on Alzheimer’s disease. Neurology. 1984;34:939–944. doi: 10.1212/wnl.34.7.939. [DOI] [PubMed] [Google Scholar]
- Mesulam M. The cholinergic lesion of Alzheimer’s disease: pivotal factor or side show? Learn Mem. 2004;11:43–49. doi: 10.1101/lm.69204. [DOI] [PubMed] [Google Scholar]
- Mesulam MM, Geula C. Nucleus basalis (Ch4) and cortical cholinergic innervation in the human brain: observations based on the distribution of acetylcholinesterase and choline acetyltransferase. J Comp Neurol. 1988;275:216–240. doi: 10.1002/cne.902750205. [DOI] [PubMed] [Google Scholar]
- Mesulam MM, Mufson EJ, Levey AI, Wainer BH. Cholinergic innervation of cortex by the basal forebrain: cytochemistry and cortical connections of the septal area, diagonal band nuclei, nucleus basalis (substantia innominata), and hypothalamus in the rhesus monkey. J Comp Neurol. 1983a;214:170–197. doi: 10.1002/cne.902140206. [DOI] [PubMed] [Google Scholar]
- Mesulam MM, Mufson EJ, Wainer BH, Levey AI. Central cholinergic pathways in the rat: an overview based on an alternative nomenclature (Ch1–Ch6) Neuroscience. 1983b;10:1185–1201. doi: 10.1016/0306-4522(83)90108-2. [DOI] [PubMed] [Google Scholar]
- Metz CE, Herman BA, Roe CA. Statistical comparison of two receiver operating characteristics-curve estimates obtained from partially-paired datasets. Med Decis Making. 1998;18:110–121. doi: 10.1177/0272989X9801800118. [DOI] [PubMed] [Google Scholar]
- Mortimer JA, Gosche KM, Riley KP, Markesbery WR, Snowdon DA. Delayed recall, hippocampal volume and Alzheimer neuropathology: findings from the Nun Study. Neurology. 2004;62:428–432. doi: 10.1212/01.wnl.0000106463.66966.65. [DOI] [PubMed] [Google Scholar]
- Mufson EJ, Binder L, Counts SE, DeKosky ST, de Toledo-Morrell L, Ginsberg SD, Ikonomovic MD, Perez SE, Scheff SW. Mild cognitive impairment: pathology and mechanisms. Acta Neuropathol. 2012;123:13–30. doi: 10.1007/s00401-011-0884-1. [DOI] [PMC free article] [PubMed] [Google Scholar]
- Muller MJ, Greverus D, Weibrich C, Dellani PR, Scheurich A, Stoeter P, Fellgiebel A. Diagnostic utility of hippocampal size and mean diffusivity in amnestic MCI. Neurobiol Aging. 2007;28:398–403. doi: 10.1016/j.neurobiolaging.2006.01.009. [DOI] [PubMed] [Google Scholar]
- Parnetti L, Lanari A, Amici S, Gallai V, Vanmechelen E, Hulstaert F. CSF phosphorylated tau is a possible marker for discriminating Alzheimer’s disease from dementia with Lewy bodies. Phospho-Tau International Study Group. Neurol Sci. 2001;22:77–78. doi: 10.1007/s100720170055. [DOI] [PubMed] [Google Scholar]
- Perry EK, Tomlinson BE, Blessed G, Bergman K, Gibson PH, Perry RH. Correlation of cholinergic abnormalities with senile plaques and mental test-scores in senile dementia. Br Med J. 1978;2:1457–1459. doi: 10.1136/bmj.2.6150.1457. [DOI] [PMC free article] [PubMed] [Google Scholar]
- Pluta J, Yushkevich P, Das S, Wolk D. In vivo analysis of hippocampal subfield atrophy in mild cognitive impairment via semi-automatic segmentation of T2-weighted MRI. J Alzheimers Dis. 2012;31:85–99. doi: 10.3233/JAD-2012-111931. [DOI] [PMC free article] [PubMed] [Google Scholar]
- Potter PE, Rauschkolb PK, Pandya Y, Sue LI, Sabbagh MN, Walker DG, Beach TG. Pre- and post-synaptic cortical cholinergic deficits are proportional to amyloid plaque presence and density at preclinical stages of Alzheimer’s disease. Acta Neuropathol. 2011;122:49–60. doi: 10.1007/s00401-011-0831-1. [DOI] [PMC free article] [PubMed] [Google Scholar]
- Pruessner JC, Li LM, Serles W, Pruessner M, Collins DL, Kabani N, Lupien S, Evans AC. Volumetry of hippocampus and amygdala with highresolution MRI and three-dimensional analysis software: minimizing the discrepancies between laboratories. Cereb Cortex. 2000;10:433–442. doi: 10.1093/cercor/10.4.433. [DOI] [PubMed] [Google Scholar]
- Reitz C, Brickman AM, Brown TR, Manly J, DeCarli C, Small SA, Mayeux R. Linking hippocampal structure and function to memory performance in an aging population. Arch Neurol. 2009;66:1385–1392. doi: 10.1001/archneurol.2009.214. [DOI] [PMC free article] [PubMed] [Google Scholar]
- Rowe CC, Ng S, Ackermann U, Gong SJ, Pike K, Savage G, Cowie TF, Dickinson KL, Maruff P, Darby D, Smith C, Woodward M, Merory J, Tochon-Danguy H, O’Keefe G, Klunk WE, Mathis CA, Price JC, Masters CL, Villemagne VL. Imaging beta-amyloid burden in aging and dementia. Neurology. 2007;68:1718–1725. doi: 10.1212/01.wnl.0000261919.22630.ea. [DOI] [PubMed] [Google Scholar]
- Royall DR, Palmer RF, Petrovitch H, Ross GW, Masaki K, White LR. Modeling regional vulnerability to Alzheimer pathology. Neurobiol Aging. 2012;33:1556–1563. doi: 10.1016/j.neurobiolaging.2011.05.028. [DOI] [PMC free article] [PubMed] [Google Scholar]
- Sarazin M, Chauvire V, Gerardin E, Colliot O, Kinkingnehun S, de Souza LC, Hugonot-Diener L, Garnero L, Lehericy S, Chupin M, Dubois B. The amnestic syndrome of hippocampal type in Alzheimer’s disease: an MRI study. J Alzheimers Dis. 2010;22:285–294. doi: 10.3233/JAD-2010-091150. [DOI] [PubMed] [Google Scholar]
- Sassin I, Schultz C, Thal DR, Rüb U, Arai K, Braak E, Braak H. Evolution of Alzheimer’s disease-related cytoskeletal changes in the basal nucleus of Meynert. Acta Neuropathol. 2000;100:259–269. doi: 10.1007/s004019900178. [DOI] [PubMed] [Google Scholar]
- Schipke CG, Peters O, Heuser I, Grimmer T, Sabbagh MN, Sabri O, Hock C, Kunz M, Kuhlmann J, Reininger C, Blankenburg M. Impact of beta-amyloid- specific florbetaben PET imaging on confidence in early diagnosis of Alzheimer’s disease. Dement Geriatr Cogn Disord. 2012;33:416–422. doi: 10.1159/000339367. [DOI] [PubMed] [Google Scholar]
- Schliebs R, Arendt T. The significance of the cholinergic system in the brain during aging and in Alzheimer’s disease. J Neural Transm. 2006;113:1625–1644. doi: 10.1007/s00702-006-0579-2. [DOI] [PubMed] [Google Scholar]
- Scholl M, Wall A, Thordardottir S, Ferreira D, Bogdanovic N, Langstrom B, Almkvist O, Graff C, Nordberg A. Low PiB PET retention in presence of pathologic CSF biomarkers in Arctic APP mutation carriers. Neurology. 2012;79:229–236. doi: 10.1212/WNL.0b013e31825fdf18. [DOI] [PubMed] [Google Scholar]
- Selden NR, Gitelman DR, Salamon-Murayama N, Parrish TB, Mesulam MM. Trajectories of cholinergic pathways within the cerebral hemispheres of the human brain. Brain. 1998;121:2249–2257. doi: 10.1093/brain/121.12.2249. [DOI] [PubMed] [Google Scholar]
- Selkoe DJ. The genetics and molecular pathology of Alzheimer’s disease: roles of amyloid and the presenilins. Neurol Clin. 2000;18:903–922. doi: 10.1016/s0733-8619(05)70232-2. [DOI] [PubMed] [Google Scholar]
- Shimada H, Ataka S, Takeuchi J, Mori H, Wada Y, Watanabe Y, Miki T. Pittsburgh compound B-negative dementia: a possibility of misdiagnosis of patients with non-Alzheimer disease-type dementia as having AD. J Geriatr Psychiatry Neurol. 2011;24:123–126. doi: 10.1177/0891988711409410. [DOI] [PubMed] [Google Scholar]
- Shin J, Lee SY, Kim SJ, Kim SH, Cho SJ, Kim YB. Voxel-based analysis of Alzheimer’s disease PET imaging using a triplet of radiotracers: PIB, FDDNP, and FDG. Neuroimage. 2010;52:488–496. doi: 10.1016/j.neuroimage.2010.04.013. [DOI] [PubMed] [Google Scholar]
- Silbert LC, Quinn JF, Moore MM, Corbridge E, Ball MJ, Murdoch G, Sexton G, Kaye JA. Changes in premorbid brain volume predict Alzheimer’s disease pathology. Neurology. 2003;61:487–492. doi: 10.1212/01.wnl.0000079053.77227.14. [DOI] [PubMed] [Google Scholar]
- Svensson AL, Warpman U, Hellstrom-Lindahl E, Bogdanovic N, Lannfelt L, Nordberg A. Nicotinic receptors, muscarinic receptors and choline acetyltransferase activity in the temporal cortex of Alzheimer patients with differing apolipoprotein E genotypes. Neurosci Lett. 1997;232:37–40. doi: 10.1016/s0304-3940(97)00573-9. [DOI] [PubMed] [Google Scholar]
- Teipel SJ, Bayer W, Alexander GE, Bokde AL, Zebuhr Y, Teichberg D, Muller-Spahn F, Schapiro MB, Moller HJ, Rapoport SI, Hampel H. Regional pattern of hippocampus and corpus callosum atrophy in Alzheimer’s disease in relation to dementia severity: evidence for early neocortical degeneration. Neurobiol Aging. 2003;24:85–94. doi: 10.1016/s0197-4580(02)00044-1. [DOI] [PubMed] [Google Scholar]
- Teipel SJ, Ewers M, Wolf S, Jessen F, Kolsch H, Arlt S, Luckhaus C, Schonknecht P, Schmidtke K, Heuser I, Frolich L, Ende G, Pantel J, Wiltfang J, Rakebrandt F, Peters O, Born C, Kornhuber J, Hampel H. Multicentre variability of MRI-based medial temporal lobe volumetry in Alzheimer’s disease. Psychiatry Res. 2010;182:244–250. doi: 10.1016/j.pscychresns.2010.03.003. [DOI] [PubMed] [Google Scholar]
- Teipel SJ, Flatz WH, Heinsen H, Bokde AL, Schoenberg SO, Stockel S, Dietrich O, Reiser MF, Moller HJ, Hampel H. Measurement of basal forebrain atrophy in Alzheimer’s disease using MRI. Brain. 2005;128:2626–2644. doi: 10.1093/brain/awh589. [DOI] [PubMed] [Google Scholar]
- Teipel SJ, Grothe M, Lista S, Toschi N, Garaci FG, Hampel H. Relevance of magnetic resonance imaging for early detection and diagnosis of Alzheimer disease. Med Clin North Am. 2013;97:399–424. doi: 10.1016/j.mcna.2012.12.013. [DOI] [PubMed] [Google Scholar]
- Teipel SJ, Meindl T, Grinberg L, Grothe M, Cantero JL, Reiser MF, Moller HJ, Heinsen H, Hampel H. The cholinergic system in mild cognitive impairment and Alzheimer’s disease: an in vivo MRI and DTI study. Hum Brain Mapp. 2011;32:1349–1362. doi: 10.1002/hbm.21111. [DOI] [PMC free article] [PubMed] [Google Scholar]
- Thal DR, Rub U, Orantes M, Braak H. Phases of A beta-deposition in the human brain and its relevance for the development of AD. Neurology. 2002;58:1791–1800. doi: 10.1212/wnl.58.12.1791. [DOI] [PubMed] [Google Scholar]
- Villain N, Chetelat G, Grassiot B, Bourgeat P, Jones G, Ellis KA, Ames D, Martins RN, Eustache F, Salvado O, Masters CL, Rowe CC, Villemagne VL. Regional dynamics of amyloid-beta deposition in healthy elderly, mild cognitive impairment and Alzheimer’s disease: a voxelwise PiB-PET longitudinal study. Brain. 2012;135:2126–2139. doi: 10.1093/brain/aws125. [DOI] [PubMed] [Google Scholar]
- Villemagne VL, Burnham S, Bourgeat P, Brown B, Ellis KA, Salvado O, Szoeke C, Macaulay SL, Martins R, Maruff P, Ames D, Rowe CC, Masters CL. Amyloid beta deposition, neurodegeneration, and cognitive decline in sporadic Alzheimer’s disease: a prospective cohort study. Lancet Neurol. 2013;12:357–367. doi: 10.1016/S1474-4422(13)70044-9. [DOI] [PubMed] [Google Scholar]
- Vogels OJ, Broere CA, ter Laak HJ, ten Donkelaar HJ, Nieuwenhuys R, Schulte BP. Cell loss and shrinkage in the nucleus basalis Meynert complex in Alzheimer’s disease. Neurobiol Aging. 1990;11:3–13. doi: 10.1016/0197-4580(90)90056-6. [DOI] [PubMed] [Google Scholar]
- Wahlund LO, Almkvist O, Blennow K, Engedahl K, Johansson A, Waldemar G, Wolf H. Evidence-based evaluation of magnetic resonance imaging as a diagnostic tool in dementia workup. Top Magn Reson Imaging. 2005;16:427–437. doi: 10.1097/01.rmr.0000245463.36148.12. [DOI] [PubMed] [Google Scholar]
- Walhovd KB, Fjell AM, Brewer J, McEvoy LK, Fennema-Notestine C, Hagler DJ, Jr, Jennings RG, Karow D, Dale AM. Combining MR imaging, positron-emission tomography, and CSF biomarkers in the diagnosis and prognosis of Alzheimer disease. AJNR Am J Neuroradiol. 2010;31:347–354. doi: 10.3174/ajnr.A1809. [DOI] [PMC free article] [PubMed] [Google Scholar]
- Whitehouse PJ, Price DL, Clark AW, Coyle JT, Delong MK. Alzheimer disease: evidence for selective loss of cholinergic neurons in the nucleus basalis. Ann Neurol. 1981;10:122–126. doi: 10.1002/ana.410100203. [DOI] [PubMed] [Google Scholar]
- Yushkevich PA, Wang H, Pluta J, Das SR, Craige C, Avants BB, Weiner MW, Mueller S. Nearly automatic segmentation of hippocampal subfields in in vivo focal T2-weighted MRI. Neuroimage. 2010;53:1208–1224. doi: 10.1016/j.neuroimage.2010.06.040. [DOI] [PMC free article] [PubMed] [Google Scholar]
- Zaborszky L, Hoemke L, Mohlberg H, Schleicher A, Amunts K, Zilles K. Stereotaxic probabilistic maps of the magnocellular cell groups in human basal forebrain. Neuroimage. 2008;42:1127–1141. doi: 10.1016/j.neuroimage.2008.05.055. [DOI] [PMC free article] [PubMed] [Google Scholar]
Associated Data
This section collects any data citations, data availability statements, or supplementary materials included in this article.