Abstract
Organism size is controlled by interactions between genetic and environmental factors mediated by hormones with systemic and local effects. As changes in size are usually not isometric, a considerable diversity in shape can be generated through modifications in the patterns of ontogenetic allometry. In this study we evaluated the role of timing and dose of growth hormone (GH) release on growth and correlated shape changes in craniofacial bones. Using a longitudinal study design, we analyzed GH deficient mice treated with GH supplementation commencing pre- and post-puberty. We obtained 3D in vivo micro-CT images of the skull between 21 and 60 days of age and used geometric morphometrics to analyze size and shape changes among control and GH deficient treated and non-treated mice. The variable levels of circulating GH altered the size and shape of the adult skull, and influenced the cranial base, vault, and face differently. While cranial base synchondroses and facial sutures were susceptible to either the direct or indirect effect of GH supplementation, its effect was negligible on the vault. Such different responses support the role of intrinsic growth trajectories of skeletal components in controlling the modifications induced by systemic factors. Contrary to the expected, the timing of GH treatment did not have an effect on catch-up growth. GH levels also altered the ontogenetic trajectories by inducing changes in their location and extension in the shape space, indicating that differences arose before 21 days and were further accentuated by a truncation of the ontogenetic trajectories in GHD groups.
Keywords: lit/lit mice, geometric morphometrics, modularity, growth hormone, allometry, growth maturity gradient
INTRODUCTION
Organisms display a large range of variation in size within and among species, which arise from modifications of developmental processes in response to environmental and genetic variables (Nijhout 2003). Changes in size are usually not proportional or isometric resulting in shape variation that is correlated with size; a phenomenon known as allometry (Huxley 1950; Gould 1966). Consequently, a considerable diversity in shape can be generated through modifications in the pattern of ontogenetic growth either by extensions or truncations along common ontogenetic allometries or by alterations in the patterns of size-related shape changes. The developmental mechanisms that control the allometric relationships among traits are complex. They involve interactions between genes, metabolism, nutrition as well as signaling molecules with localized and systemic effects (Thissen et al. 1994; Singleton et al. 2007).
Recent advances suggest that the joint effect of local and systemic molecular factors play a significant role in regulating the timing and rate of organ growth (Parker 2011). On one hand, the size of morphological structures is dependent on intrinsic regulators of growth, such as extracellular signaling molecules (e.g. ligands of the Hedgehog, bone morphogenetic protein/transforming growth factor-□, epidermal and fibroblast growth factor families). Such molecules control cell proliferation and differentiation within developing organs, and thus their variable expression at local levels can modify the scaling relationships between morphological traits as well as between individual traits and body size. However, growth is also controlled by factors with a systemic effect on the organism. Growth hormone (GH), acting directly or by inducing the expression of insulin-like growth factor-1 (IGF-1), as well as the autocrine/paracrine release of IGF-1 are the major systemic factors inducing growth in most organs (Le Roith et al. 2001). Studying the interaction between systemic factors and the particular growth trajectories exhibited by different structures is relevant to understand the developmental underpinnings of relative growth, which can account for the magnitude and direction of local responses under the influence of common or nonspecific causes (e.g. nutrition and endocrine changes).
In this paper, we focus on the role of GH on the ontogenetic allometry of craniofacial bones. This hormone is one of the most important regulators of bone growth through the stimulation of chondrocyte proliferation at the endochondral growth plates and the induction of proliferation and differentiation of osteoblasts and osteoclasts (Giustina et al. 2008). Alterations in the GH pathway that either reduce the levels of circulating hormone or interfere with the binding to its receptor result in an overall reduction of skeletal growth. Supplementation with GH has the opposite effect although the magnitude of the response is highly variable depending on the time at which it begins and the target organs (Kasukawa et al. 2003). In terms of the craniofacial complex, GH treatment significantly increases some measurements such as cranial base length, facial height and mandibular size, while it has a much lower effect on other variables (Cantu et al. 1997; Rice et al. 1997; Vandeberg et al. 2004; Singleton et al. 2006; Bills et al. 2008). These results suggest that the level and timing of GH release can induce shape changes in the skull. However, the influence of variable levels of circulating GH on the ontogenetic allometry of craniofacial structures has not been thoroughly assessed, i.e., whether GH has the potential of altering the pattern of size-dependent shape changes during ontogeny.
We analyzed longitudinal growth of GH deficient mice treated with GH supplementation commencing pre- and post-puberty in order to evaluate the influence of GH on the development of craniofacial shape and size and to specifically test the effect of the timing of growth hormone treatment. We expected that the deficiency of GH resulted in a modification of craniofacial shape as a consequence of the allometric changes induced by the impairment of somatic growth. We also hypothesized that the treatment with GH would have a differential effect on the cranial vault, base and face. In particular, structures that mature later in ontogeny are expected to be more sensitive to GH treatment and thus, their growth is expected to increase in a greater extent compared to more mature structures. Accordingly, we predict an association between craniofacial shape and the timing of GH treatment. We expect this to occur because the early treatment with GH commencing pre-puberty will result in greater catch-up growth than late treatment commencing post-puberty. We further tested how the different levels of GH modify the ontogenetic trajectory of the skull. Finally, the significance of patterns of hormone release in morphological evolution is discussed.
MATERIALS AND METHODS
Experimental design
As a genetic model of GH deficiency we used homozygous mice for a mutation in the growth hormone–releasing hormone receptor (Ghrhr). The Ghrhr homozygous mouse, known as little (lit/lit), is a dwarf strain on a C57Bl/6 genetic background that is characterized by reduced levels of GH. The normal GH release is impaired due to a defect in the growth hormone releasing hormone (GHRH) pathway. The defect results from a mutation in the N-terminal extracellular domain of the GHRH receptor which impedes the normal binding of GHRH altering the synthesis of GH (Gaylinn et al. 1999). The heterozygous mouse (lit/+) has normal GH synthesis and release comparable to wild type C56Bl/6 and is thus suitable for use as a genetic control group.
Mice used in this experiment were bred in-house from breeding pairs purchased from the Jackson Laboratory. At 21 days old, male and female pups were weaned and divided into one of five experimental groups: heterozygous control representing GH sufficient (GHS, n=17); homozygous control representing GH deficient (GHD, n= 15); homozygous early (GHDe, n=10) and late treatment (GHDl, n=10), which received daily injections of 25 μg of mouse recombinant growth hormone from 21 and 35 days of age, respectively; and homozygous saline injection control (GHDs, n=7), which received daily subcutaneous injections of saline starting at 21 days of age to determine if there were effects of stress from daily injections (Kristensen et al. 2010). All injections ceased at 60 days of age.
Animals were separated by sex and housed in an accredited animal care facility under a 12-hour light/dark cycle and allowed ad libitum access to standard rodent chow and water. All animal procedures were reviewed and approved by the University of Calgary Health Sciences Animal Care Committee and experiments were conducted in compliance with this approval. Animals were cared for as per the guidelines of the Canada Council on Animal Care.
Morphometric data
In vivo micro-computed tomography images (μCT; vivaCT 40, Scanco Medical AG, Brüttisellen, Switzerland) of the skull were obtained at 21, 28, 35, 45 and 60 days of age, for all experimental groups. Fifty-four landmarks were digitized on the μCT scans of each mouse cranium using Analyze 3D 5.0 (USA). Table 1 and Figure 1 show the 23 bilateral and eight midline 3D landmarks digitized from the 3D reconstructions (Willmore et al. 2006). Each landmark was assigned to one of the three modules in which the skull was divided: base, face, and vault (Gonzalez et al. 2011). These modules were identified on the basis of the current knowledge about developmental processes and functional properties of the cranium. In this sense, it is well documented that these three cranial components differ in their embryological origin, mode of ossification and pattern of growth (Morriss-Kay 2001; McBratney-Owen et al. 2008). Consequently, we hypothesized that GH treatment will have a disparate effect on each module. This framework does not assume that these three modules fully represent the modular organization of the skull, which we know to be substantially more complex than this (Hallgrímsson et al. 2009). For the purposes of this study, it is not necessary that these three divisions of the skull are the salient features of the cranial variance-covariance matrix. We use them here because we hypothesize that these regions of the skull respond differentially to growth hormone, since each is differentially dependent on brain growth and chondrocranial growth (Enlow 1990).
Table 1.
Skull landmarks. L/R indicates that landmarks were selected on both the left and right sides of the skull, and M indicates that the landmarks were located on the midline.
| Landmark | Anatomical description |
|---|---|
| AIA | Anterior inferior auditory bulla (L/R) |
| AIF | Anterior margin of incisive foramen (L/R) |
| AIZ | Anterior inferior zygomatic (L/R) |
| ANM | Most anterior point along premaxilla nasal junction (L/R) |
| ASA | Anterior superior alveoli (L/R) |
| ATS | Auditory-temporal-sphenoid junction (L/R) |
| ATZ | Anterior temporal-zygomatic junction (L/R) |
| BRG | Bregma (M) |
| FC | Foramen caecum (M) |
| FTP | Fronto-temporal-parietal junction (L/R) |
| IOS | Intersection of frontal suture with orbital rim (L/R) |
| LAM | Lambda (M) |
| LFM | Lateral foramen magnum (L/R) |
| LFS | Lateral point along frontal suture (L/R) |
| MFM | Medial foramen magnum (M) |
| MMP | Medial maxilla-premaxilla junction (L/R) |
| MS | Superior margin of suture of temporal and zygomatic processes of zygomatic arch (L/R) |
| MSI | Midline superior incisor (L/R) |
| MSS | Midline presphenoid sphenoid synchondrosis (M) |
| MST | Point along occipomastoid suture (L/R) |
| NAS | Nasion (M) |
| OA | Occipital-auditory junction (L/R) |
| OAS | Occipital-auditory-sphenoid junction (L/R) |
| PIF | Posterior incisive foramen (L/R) |
| PM | Point of greatest curvature on the posterior margin of the malar process (L/R) |
| PSA | Posterior superior alveoli (L/R) |
| PTZ | Posterior temporal-zygomatic junction (L/R) |
| PZA | Point of greatest curvature along posterior edge of zygomatic process of temporal bone (L/R) |
| SES | Spheno-ethmoidal synchondrosis (M) |
| SOS | Spheno-occipital synchondrosis (M) |
Figure 1.
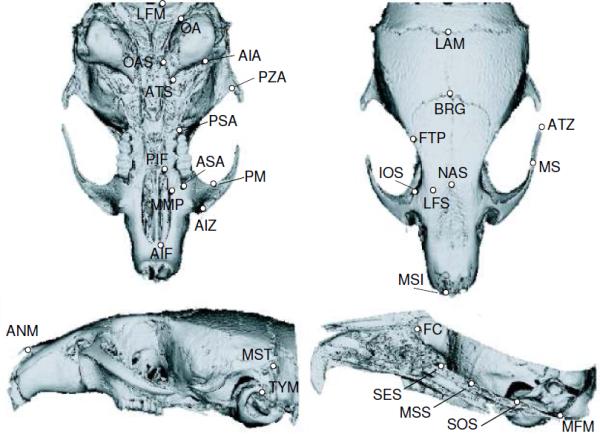
3D landmarks collected from mouse skulls as described in Table 1.
A generalized least-squares superimposition was performed using MorphoJ (Klingenberg 2011) on landmark configurations to obtain Procrustes coordinates. This procedure optimally translates, scales and rotates coordinates of landmarks (Rohlf and Slice 1990). Separated superimpositions were obtained for the skull and each module. The symmetric component, obtained by estimating the average of the left and right configurations of landmarks, was extracted and the resulting coordinates were used as shape variables (Klingenberg et al. 2002). We computed the centroid size as a measured of overall size of the skull. The centroid size is defined as the square root of the sum of squared distances of each landmark coordinate from the centroid (mean x, y, z, landmark for the configuration) of the configuration.
Statistical analyses
The effect of the different levels of growth hormone on adult skull size was investigated by applying a univariate analysis of variance to the natural logarithm of centroid size (logCS) at 60 days of age. Post hoc tests were then conducted to evaluate which groups displayed significant differences. The same analysis was then repeated for each cranial module (face, base and vault).
The pattern of shape differentiation in the adult skull was investigated by performing a between-group principal component analysis on the Procrustes coordinates at 60 days of age (called here between treatment PCA, btPCA). This is an alternative ordination method specifically recommended when the number of observations is smaller than the number of variables, as is usually the case of geometric morphometric data in 3D (Boulesteix 2005). This PCA is calculated by projecting the data onto the eigenvectors of the between-groups covariance matrix. The method leads to a better group separation than in ordinary PCA and allows a visual assessment of between-groups differences. Visualizations of shape changes among groups were performed by regressing the Procrustes coordinates onto the PC scores and then warping the scanned surface of a mouse skull, using the thin-plate spline procedure implemented by Landmark software (Wiley et al. 2005). The coordinates digitized on the surface of a GHS mouse were warped onto the coordinates that represented the shape changes along the negative and positive extremes of the first two principal components.
In addition, to test the effect of the different levels of GH on the skull shape attained at 60 days of age, we calculated univariate and multivariate analyses of variance using the PC scores as dependent variables and the experimental group as the factor with 5 levels. The PC scores were obtained from a PCA on the covariance matrix of the whole set of specimens at 60 days of age. The use of PC scores instead of the Procrustes coordinates as shape variables is a common method of dimensionality reduction in geometric morphometrics, where a large number of variables results from using 2 or 3 coordinates for each landmark (Sheets et al. 2006). To evaluate the effect of reducing the dimensionality we used as dependent shape variables the scores along the first principal component (PC1), the minimal set of PCs that jointly account for at least 80% of the total variance and the set of all PCs that individually account for at least 1% of variance.
In order to evaluate how GH modifies the entire ontogeny of shape during the age interval covered by the experiment we performed a between-group PCA based on the among-ages covariance matrix, called here between ages PCA (baPCA). This analysis allows the comparison of the ontogenetic trajectories among the five experimental groups in the shape space. A similar approach has been previously used for the comparison of inter-specific trajectories (Klingenberg and Spence 1993; Mitteroecker et al. 2004, 2005).
Then, we evaluated the effects of GH, age and size on skull shape by applying an analysis of variance. This procedure allowed to simultaneously test for the effect of size on shape (allometric effect), for the effect of age independent from size (ontogenetic effect) and for the effect of GH level independent from both size and ontogenetic-related shape changes. In addition, we evaluated for the consistency of the allometric effect among experimental groups (interaction logCS by group). Similar designs have been previously used to test for the effect of experimentally induced factors on the allometric and non-allometric components of shape and the comparison of inter-specific allometries (Klingenberg and Spence 1993; Debat et al. 2003). In the current study, a mixed-model was used in order to account for the temporal autocorrelation resulting from taking repeated measurements along individual ontogenies. Specimens were included as a random factor in the model following the procedures implemented in the nlme package (Pinheiro et al. 2012). The dimensionality of the data was first reduced by performing a PCA from the covariance matrix of the Procrustes coordinates of the ontogenetic series. PCs obtained from this analysis were then used as dependent shape variables for the analyses.
Additionally, to analyze the size-related shape changes along ontogeny (i.e., ontogenetic allometry) we performed multivariate regressions of the Procrustes coordinates on logCS for the whole skull and each module separately (face, base and vault) (Monteiro 1999). The amount of variation explained by the regression model was quantified as a percentage of the total shape variation, computed using the Procrustes metric. The statistical significance of the regressions was evaluated with permutation tests against the null hypothesis of independence. In this case the pattern of shape variation related to ontogenetic allometry was depicted by warping the coordinates digitized on the surface of a GHS mouse onto the coordinates that represented the shape changes predicted for the smallest and largest sizes. The thin-plate spline procedure implemented by Landmark software was used for this purpose.
To compare the direction of ontogenetic allometries of the skull between groups with different levels of circulating GH we computed the pairwise angles between the regression vectors. The components of these vectors are regression coefficients for the Procrustes coordinates on logCS and thus represent the shape changes related to size for each coordinate of landmarks. The estimation of the angle between vectors is a method widely used in geometric morphometric studies aiming at comparing ontogenetic trajectories both among and within species (Zelditch et al. 2003, Drake and Klingenberg 2008; Gonzalez et al. 2011). Angles of 0.0° are expected when the ontogenetic allometries being compared overlap or are parallel. To test the null hypothesis that the vectors have random directions we followed the procedure implemented in MorphoJ (Klingenberg 2011). In that case the angles between vectors are expected to be 90° and the corresponding P-values are 1.0. In addition, to evaluate whether the shape changes between adults of the five treatments were similar to size-related shape changes along ontogeny, we estimated the angle between the first eigenvector of the btPCA and the regression coefficients of Procrustes coordinates on logCS from the interval 21-60 days for the control group.
Lastly, endocranial volume was measured at days 21, 28, 35, 45 and 60 from the 3D scans and used as an estimate of brain size. To calculate endocranial volume, all images were reduced by a factor of two in each of the x, y, z dimensions, resulting in an isotropic voxel size of 76μm. Both median (radius=3) and maximum (radius=1) filtering were applied to these images to remove sutures (ImageJ, v1.43, US National Institutes of Health, Bethesda MD). The volume of the virtual casts was calculated and statistically significant differences among groups at the age of 60 days were determined using an ANOVA test.
All morphometric and statistical analyses were performed using MorphoJ (Klingenberg 2011) and R software 2.13.0 (R Development Core Team, 2011 which is freely available at http://www.r-project.org).
RESULTS
Size increased in each experimental group over the study period, consistent with growth, although the groups displayed remarkable differences in size at every age (Fig. 2). At the 60 day-old stage there were statistically significant differences in skull size between groups (F4, 52= 223.2; P< 0.001). A post hoc test showed that the heterozygous (GHS) and the four homozygous groups (GHD), without and with GH treatment, differed significantly in the size attained at 60 days old (post hoc Tukey's HSD: P<0.01 for the pairwise comparisons with GHS). Therefore, the GHD resulted in significantly reduced skull growth as compared with heterozygous controls. The homozygous control and homozygous saline control groups had similar sizes as well as the two homozygous groups treated with GH (post hoc Tukey's HSD: P=0.96 and P=0.99, respectively). This indicates that there were no detectable effects due to the stress of daily injections, and that the two groups injected with GH had a similar increase in skull size regardless of the age of onset of treatment.
Figure 2.
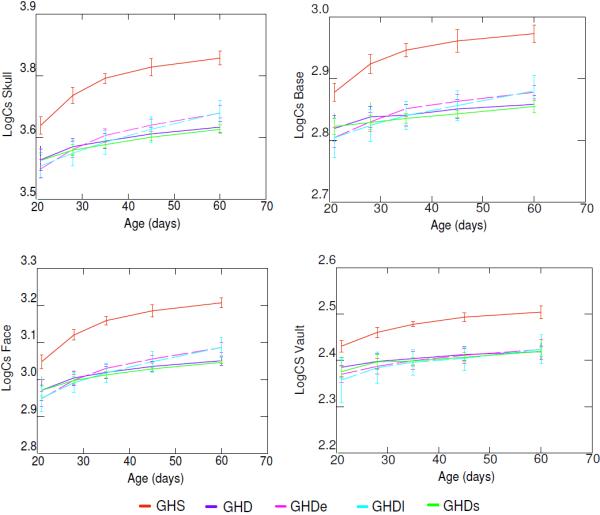
Log Centroid size (LogCS) ± standard error for GHS (GH sufficient), GHD (homozygous control or GH deficient), GHDe (homozygous early treatment), GHDl (homozygous late treatment), GHDs (homozygous saline control) groups at the five time points studied (days 21, 28, 35, 45, 60).
When the cranial modules were analyzed separately, similar results were found for the centroid size of the base and the face, but not for the vault (Fig. 2). At the 60 day-old stage there were statistically significant differences between groups in the size of the base (F4, 52=147.801; P< 0.001), face (F4, 52=280.015; P< 0.001) and vault (F4, 52=66.223; P< 0.001). The post hoc tests showed that the four GHD groups were significantly smaller than the GHS group (post hoc Tukey's HSD: P<0.01 for the pairwise comparisons with GHS). Likewise, the base and face of the GHD groups with GH treatment were significantly larger than in the GHD groups without hormonal treatment (post hoc Tukey's HSD: P<0.01) while there were no significant differences between the early and late treatment with GH (Base: P=0.998; Face: P=1). Conversely, the only significant differences observed for the vault were between the GHS and the four GHD groups (post hoc Tukey's HSD: P<0.01 for the pairwise comparisons with GHS). According to this result, the growth of the vault was not increased by either the late or the early GH treatment (post hoc Tukey's HSD: P=0.961 and P=0.946 for the comparisons between GHD group and GHDe, and GHDl, respectively).
We also analyzed the endocranial volumes at 60 days of age for each experimental group and found that the homozygous control, early treatment and late treatment groups had significantly smaller brain sizes than the heterozygous control group (Fig. 3), with no differences between the GHD groups. Thus, growth hormone treatment appears to have no effect on brain size when administered daily from age 21 days and onwards.
Figure 3.
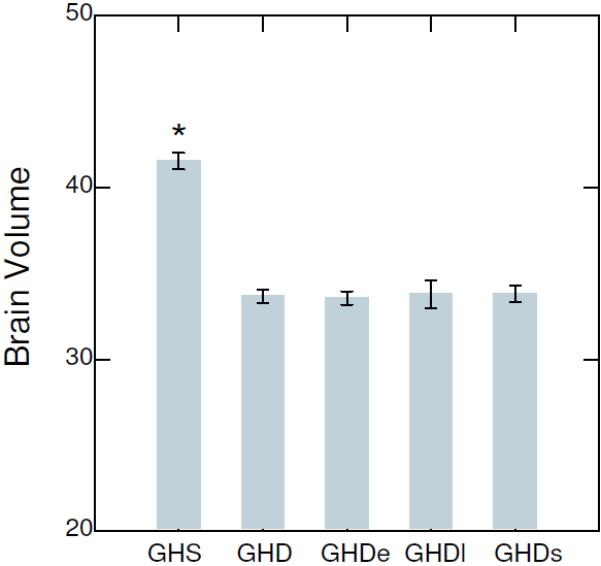
Endocranial volume ± standard error for GH sufficient heterozygous control (GHS), homozygous control or GH deficient (GHD), homozygous early and late treatments (GHSe, GHSl) and homozygous saline (GHDs) groups at 60 days old. *P<0.01 compared to the four GHD groups.
Accordingly, the centroid size values showed that the three modules of the skull had a different pattern of size reduction relative to the GHS group. Compared to GHS, the face was 15% smaller in the two untreated GHD groups and 12% smaller in the two GHD treated groups. The base displayed a reduction in size of 11% for the GHD groups with no treatment and 9% for the GHD treated groups compared to GHS. Finally, the four GHD groups showed a similar reduction of vault size compared to GHS, which was around 8%.
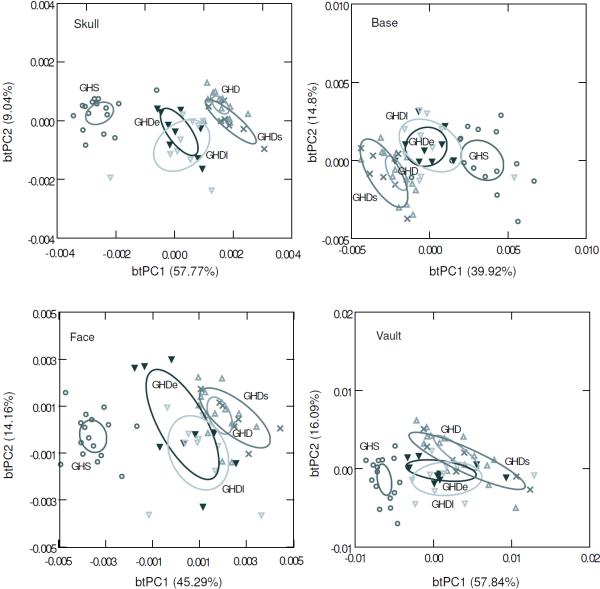
Between treatment PCA (btPCA) of the skull at the 60 day time point is shown in Figure 4. The first two components account for 94.94% of the variation between group means. The GHS group is clearly separated from the GHD groups along the first btPC. It can also be noted that the groups with early and late GH treatment overlap along this axis, while they are separated from the GHD groups with no GH treatment. Shape variation between treatments at 60 days of age is manifested primarily in the reduction of the relative width of the vault and the base, and the increasing length of the face with the level of GH (Fig. 5). Similar ordinations were found for the base and face, where the two groups treated with GH are separated from the untreated GHD groups (Fig. 4). Conversely, the four GHD groups overlapped significantly along the first btPC obtained for the vault (Fig. 4). This indicates that the increase in size in the face and base induced by GH treatment affects their shape, meaning that the growth within each module was not isometric or equal in all directions.
Figure 4.
Between-treatments principal component analysis (btPCA) of Procrustes shape coordinates of three-dimensional landmarks of the 5 groups analyzed at 60 days old for the whole skull and by cranial module. GHS: GH sufficient heterozygous control; GHD: homozygous control or GH deficient; GHDe and GHDl: homozygous early and late treatment; GHDs: homozygous saline injection control.
Figure 5.
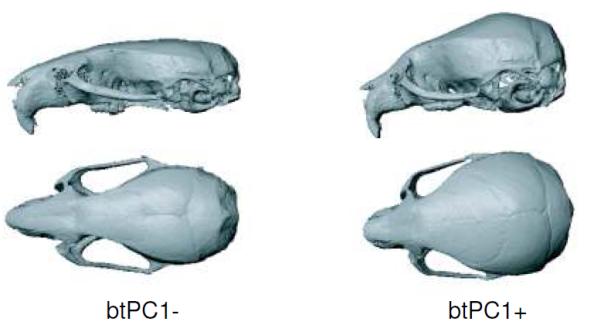
Shape changes corresponding to the observed extremes in the positive and negative directions of the between-treatments first principal component (btPC1) shown as a warped surface of a mouse skull.
The ANOVA test performed for the group of 60 days of age indicated a highly significant effect of the GH level on the skull shape summarized by the PC1, which explained 51.32% of total variance (F4,52=84.909; P<0.01). The post-hoc Tukey's HSD showed that the four GHD groups differed significantly from the heterozygous control (P<0.01) Moreover, the only not significant pairwise comparisons were between the early and late GH treatment groups, and between the group without GH treatment and the one that received saline solution (post hoc Tukey's HSD: P>0.90). PC1 was significantly correlated with logCS (r = 0.957), meaning that a large percentage of shape variation between groups was size-related. The allometric component was summarized by the first PC, while the other components displayed a low and not significant correlation with size. The MANOVA test based on the first 7 PCs, which accounted for a reasonable large amount of the variation between specimens (80%), was found to be highly significant (Wilk’s λ=0.019; F28,167=11.94; P<0.01) as well as the test of the first 13 PCs that individually explain more than 1% of total variation (Wilk’s λ=0.0049; F52,152=8.86; P<0.01). The pairwise comparisons also showed significant differences between the heterozygous control and the four groups with GH deficiency in both multivariate analyses, although no differences were found between groups with and without GH treatment. Overall, these results confirmed that neither the late nor the early GH treatments were able to restore the skull shape by the age of 60 days.
The between group principal component based on the ontogenetic series is shown in Figure 6. The first baPC describes a predominant linear trend and represents shape variation related to growth within each group, while the second baPC describes differences between groups with variable levels of GH. The first component accounts for a large amount of variation among group means (87.39%), while the second component accounts for 4.57% of variation. This plot reveals that the ontogenetic trajectories of the GHS and GHD groups in the shape space do not overlap although they follow the same direction. It can also be seen that the GHD groups already differ from the GHS at the earliest stage analyzed. Differences between GHS and non-treated GHD groups increase with age due to a larger extension of the ontogenetic trajectory in the control group. Although the ontogenetic trajectories of the GH treated groups are extended compared to the non-treated ones, they do not catch up with the GHS specimens.
Figure 6.
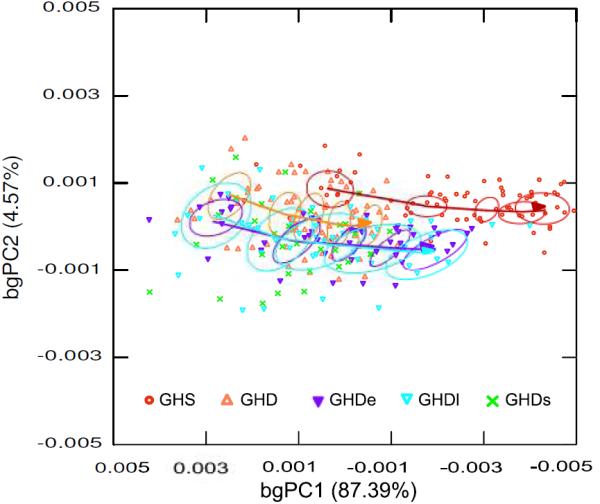
Between-age PCA (baPCA) of the ontogenetic series. The first two components account for 91.96% of variation between group means. Circles represent the centroid (0.95) of each age stage by treatment. Centroids corresponding to GHDs were not included in order to make easier the visualization of the trajectories of the GHD groups not treated and treated with GH. Arrows indicate the progression of age within each group, increasing from left to right, and show the overall ontogenetic trajectory in the shape space.
For the linear mixed-model we used the first PC which explained a large amount of total variation (around 50% for the skull, face and base, and 36% for the base) and was highly and significantly associated with size and age, while the remaining PCs explained small percentages of total variation and did not show a significant allometric effect. Both size and age effects were found to be significant in the univariate linear mixed-model of the skull where PC1, which accounted for 57.5% of total variation, was used as dependent shape variable. This suggested both a significant allometric effect (F1, 207 = 29548.620; P<0.01) and significant ontogenetic-related shape changes (F1, 207 = 174.843; P<0.01) in the skull along the axis that summarized the highest amount of shape variation in the ontogenetic series. The GH level also had a significant effect on skull shape (F14,54 = 163.698; P<0.01). In addition, the interaction term logCS by group was significant (F4, 207 = 28.619; P<0.01) indicating that the allometric effect did not remain consistent along the experimental groups. Similar results were obtained for the face in which the three independent variables as well as the interaction of logCS by group had a significant effect on PC1, which accounted for 56.3% of total variation (Table 3). Conversely, we did not find a significant interaction between size and GH treatment for the base or vault, suggesting that the allometric effect on PC1 remained consistent along the experimental groups (Table 3).
Table 3.
Linear mixed-model. Analysis of the effects of size (logCS), age and GH level (group) on craniofacial shape summarized by PCI.
| Group | LogCS | Age | LogCS*Group | |
|---|---|---|---|---|
| Skull |
F4,54=94.24 P<0.01 |
F1,207=5353.66 P<0.01 |
F1,207=406.09 P<0.01 |
F4,207=16.17 P<0.01 |
| Base |
F4,54=63.45 P<0.01 |
F1,207=3447.79 P<0.01 |
F1,207=4.74 P=0.03 |
F4,207=1-88 P=0.11 |
| Face |
F4,54=88.38 P<0.01 |
F1,207=8625.90 P<0.01 |
F1,207=72.27 P<0.01 |
F4,207=20.61 P<0.01 |
| Vault |
F4,54=22.29 P<0.01 |
F1,207=2246.49 P<0.01 |
F1,207=100.81 P<0.01 |
F4,207=1-32 P=0.26 |
We further analyzed the size-related shape changes in order to compare the allometric ontogenies between groups. The results of the multivariate regressions of the Procrustes shape coordinates on logCS indicated that between 29% and 53% of the ontogenetic shape variation within each group was related to size (Fig. 7). The largest values were found in the heterozygous control and early GH treated groups (Fig. 7). A strong association between skull shape and size was found in the ontogenetic series, which is illustrated in the scatter plot that depict the regression shape scores as a function of size for GHS, GHD and GHDe groups (Fig. 8). Allometric trajectories of the two GH deficient groups overlap while exhibit some differences with the control group.
Figure 7.
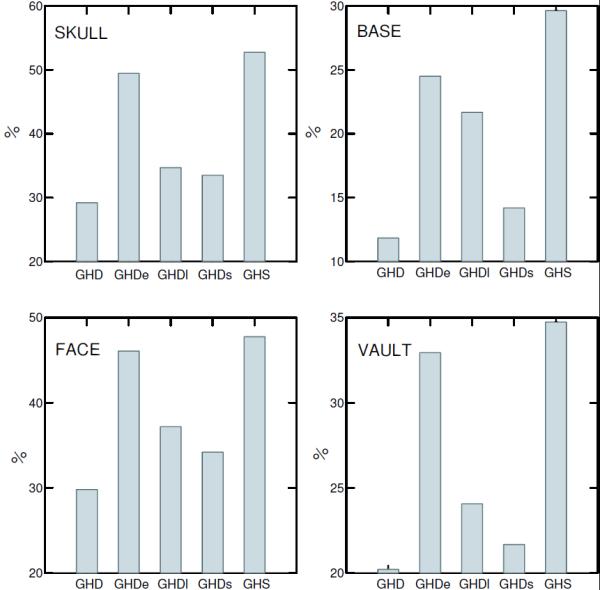
Ontogenetic allometries. Percentage of shape variation explained by size within each longitudinal series.
Figure 8.
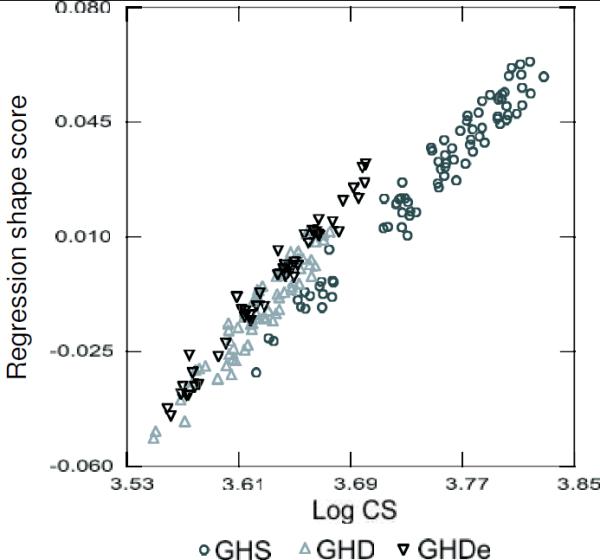
Ontogenetic allometries. Regression scores, obtained from the multivariate regression of Procrustes shape coordinates on log centroid size (logCS), as a function of size. GH sufficient heterozygous control (GHS), homozygous control or GH deficient (GHD) and homozygous early treatment (GHSe) groups are represented.
Pairwise comparisons of within-group allometric regression vectors of the skull indicated that the GHD groups differed from the control group by angles ranging from 12 to 24 degrees (Table 2). The highest values were found between GHS and the two GHD groups not treated with GH. Similar results were found for the face, base and vault (Table 2). Except for the comparison between GHS-GHDl for the vault, the regression vectors of non-treated groups displayed the highest angles with the regression vectors of heterozygous control group. This means that the direction of allometric trajectories of GH treated groups were more similar to GHS group than those from non-treated groups. Nevertheless, the statistical assessment of the resulting angles indicated that all pairwise comparisons were significantly different from the expected for random vectors.
Table 2.
Pairwise angles between regression vectors of ontogenetic allometries. GHS: GH sufficient heterozygous control; GHD: homozygous control or GH deficient; GHDe and GHDl: homozygous early and late treatment; GHDs: homozygous saline injection control. Values are in degrees.
| Pairwise comparisons |
Skull | Face | Base | Vault |
|---|---|---|---|---|
| GHS- GHD | 24.604 | 22.337 | 48.806 | 30.308 |
| GHS - GHDe | 12.496 | 15.274 | 19.054 | 20.494 |
| GHS - GHD1 | 15.324 | 16.708 | 24.992 | 46.825 |
| GHS - GHDs | 24.256 | 26.617 | 48.675 | 27.437 |
| GHDe - GHDl | 12.552 | 13.809 | 18.356 | 30.091 |
Within each group, the size-related shape changes throughout ontogeny were characterized by a flattened and elongated braincase and an increased facial length (Fig. 9). Similar shape changes were found between treatments at 60 days, where the GHD groups appeared immature with a shorter face and rounded braincase (Fig. 5). This similarity was also reflected in the angle between the ontogenetic allometric regression vectors and the first eigenvector of the btPCA which was 18.14° and smaller than expected for pairs of random vectors (P<0.001). The comparisons with the remaining components showed larger values and not significantly different from the expected right angle for pairs of random vectors (P>0.5).
Figure 9.
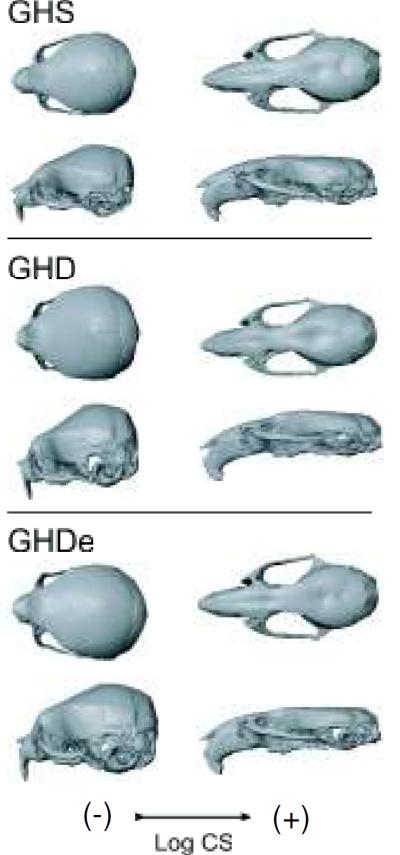
Shape change associated with ontogenetic allometry, estimated from the regression of Procrustes coordinates on log centroid size (logCS) in the ontogenetic series. Shape changes associated with the extreme values of centroid size within each group are shown as warped surfaces of a mouse skull. GHS: GH sufficient; GHD: homozygous control or GH deficient; GHDe: homozygous early treatment.
discussion
Our results support the prediction that GH deficiency alters craniofacial shape due to allometric changes induced by the impairment of growth. We also found that the effect of GH differed among the three cranial regions analyzed. The face displayed a larger reduction in size in the GHD mice, indicating that the growth of facial bones was more dependent on the GH stimulus than the cranial base or vault bones. Likewise, the response to GH supplementation was different between modules. GH treatment stimulated growth of the cranial base and face to different extents in these two modules; however its effect was negligible in the vault.
Contrary to our expectation, the timing of GH treatment did not have an effect on catch-up growth of the skull as long as it started after weaning and before puberty. By day 60 the early and late treatment groups did not exhibit differences in size or shape. This lack of significant differences in growth between the early and late treatments suggests a non-linear response to GH supplementation within the ontogenetic stage analyzed here (i.e., between 21 and 35 days). This means that injecting the same dose of GH for a longer period did not have an accumulative effect on bone growth, which is consistent with a non-linear relationship between dose and effect commonly observed for biological phenomena (Nijhout 2008). It remains to be determined whether increasing the daily dose or starting treatment at an earlier time point would have a differential effect on growth. Previous studies on the same mice have shown that both pre-pubertal and post-pubertal GH treatment failed to fully restore femoral and vertebral bone macrostructure, leading to compromised bone mechanical properties. Some aspects of vertebral trabecular microarchitecture were fully rescued with pre-pubertal treatment, resulting in normalized trabecular bone mechanical properties independent of bone size (Kristensen et al. 2010, 2012). The differential response of anatomical structures to GH reduction observed here has also been described in humans with Ghr insensitivity, humans carrying mutations that result in lower levels of circulating GH as well as in GH deficient rats (Rice et al. 1997; Vandeberg et al. 2004). Particularly, these studies find a correlation between the growth maturity gradient (i.e. as an animal grows, the rate of maturation of its boney structures varies) (Buschang et al. 1983) exhibited by different structures and their response to GH impairment, with the more mature traits less affected by GH treatment and vice versa. The mechanisms underlying such correlations can be related to the role of GH during pre and postnatal life as well as to the interaction between this systemic factor and local regulators of growth in each organ. Although the action of pituitary GH on fetal growth during the later period of gestation is well supported (Waters and Kaye 2002), the prenatal growth is primarily controlled by locally secreted IGFs and non-pituitary GH secreted by several fetal tissues. IGF-I and IGF-II are expressed from zygote formation and implantation until birth, with IGF-II expression being more extensive from mid to late gestation (Randhawa and Cohen 2005). After birth, GH assumes a prominent role in regulating growth and stimulating the production of systemic and local IGF-I. Consequently, structures that display a relative extended period of postnatal growth will be more affected by the reduction of GH release than those with a larger proportion of growth occurring prenatally. These mechanisms can account for the larger size reduction observed in the GHD group in less mature structures such as the face.
The effect of pre- and post-puberal GH supplementation on facial size can also be related to a greater susceptibility to GH in those structures that exhibit a more extended period of postnatal growth. The effects of GH on bone growth are mediated by the up-regulation of a large number of genes associated with the GH-IGF axis and other signaling pathways such as Wnt and BMP (Krishnan et al. 2006). Previous studies have shown that the treatment with GH in hormone deficient models induces significant changes on the gene expression of long bones. However, expression patterns are highly variable according to the type of tissue analyzed and the growth period in which tissues are sensitive to GH (Flores-Morales et al. 2001; Kasukawa et al. 2003). To the best of our knowledge, the response of different cranial bones to GH has not been yet evaluated, although a heterogeneous effect might be expected given the complex embryological origin and mode of ossification displayed by the skull. This is supported, for example, by the differential FGFs and FGFRs expression pattern observed in bones that display intramembranous or endonchondral ossification and between neural crest or mesoderm derived bones (Rice et al. 2003; Quarto et al. 2009).
Our results point out that cranial base synchondroses and facial sutures are susceptible to GH and/or IGF1 action and that their responses to experimentally altered hormone levels are thus integrated. Conversely, the lack of phenotypic changes in the vault suggests independence in its response to GH levels. This is probably linked to the epigenetic effect of brain growth in promoting the cellular proliferation and differentiation in the coronal, saggital and lambdoid sutures. The morphogenesis and maintenance of bone growth in cranial sutures are regulated by the secretion of several factors by the dura mater in response to the forces produced by the expanding brain (Opperman et al. 1995; Kim et al. 1998). As the GH supplementation did not increase brain growth, the events stimulated by this process could not been rescued by the hormone treatments applied here. Variations in the epigenetic regulation of complex structures are fundamental for understanding the degree of phenotypic integration and independence to hormone signal displayed by different traits (Ketterson et al. 2009).
Another issue addressed in this paper was to evaluate the influence of different levels of GH on the ontogenetic trajectory of the skull. This is relevant because there are different ways in which genetic, endocrine and environmental factors can alter the ontogenetic trajectories of skeletal structures and thus result in the patterns of size and shape variation observed among adults (Drake and Klingenberg 2008; Nijhout and German 2012). The between group PCA based on the ontogenetic dataset showed non-overlapping trajectories between GH sufficient control mice and GH deficient groups (Fig. 6). These trajectories were different in origin but not in direction in the shape space, indicating that differences arose before the first age stage analyzed here. Shape differences between GHD and control groups were further accentuated by a truncation of the ontogenetic trajectories of non-treated groups. Although the trajectories of the two GHD groups that received early and late GH treatments displayed an important elongation compared to the non treated groups, they did not catch up with control group. The analysis of the allometric component of shape showed that directions of regression vectors were significantly different from the expected for pairs of random vectors (Table 2), indicating that directions of ontogenetic allometry of GHD groups were similar to heterozygous control. Nevertheless, we found a significant interaction between logCS and treatment on shape changes summarized by the first PC based on the ontogenetic series of the skull and the face (Table 3). This suggests that the allometric effect did not remain consistent along the experimental groups. Conversely, non-significant interaction was observed for the base neither for the vault, which further support the differential response of cranial components to a common systemic factor.
Due to their role in the processes that control growth, hormones are thought to be an important source of intra- and interspecific morphological diversification. Over evolutionary time, hormones can induce phenotypic changes in two main ways: hormone signals may vary in their strength and/or pattern of release, or the target tissues may be modified resulting in a greater or lower sensitivity to hormone signals (Hau 2007; Ketterson et al. 2009). Comparative studies have mostly measured circulating hormone levels and assessed their relationship with body size and life history traits (Bernstein 2005; Bernstein et al. 2008). However, the distribution and concentration of receptors in target tissues and the autocrine and paracrine production of growth factors are more likely responsible for evolutionary changes in ontogenetic trajectories (e.g. extension, truncation, changes in direction), which in turn, result in the patterns of shape and size diversity observed among adults. One interesting example is the discovery of a single IGF1 single-nucleotide polymorphism haplotype which is associated with the diversity in body size exhibited by domestic dogs (Sutter et al. 2007). Based on our results, it is expected that such modifications of the GH-IGF axis not only affect overall body size but also induce shape changes in the skull as a consequence of both alterations of ontogenetic trajectories and the dissimilar effect of GH levels on craniofacial traits. It is worth noting that similar patterns of allometric change in the skull can be produced by environmental factors, such as the reduction of energy intake in early life (Gonzalez et al. 2011). This suggests that systemic factors such as hormones and external stimuli can induce the same response in morphological traits, and that the nature of this response depends on the timing of the perturbation in relation to the intrinsic trajectory of growth of each structure. Clearly, the regulation of growth through systemic factors along with environmental interactions is a major source of phenotypic variation in complex morphological structures which is still only beginning to be understood.
ACKNOWLEDGMENTS
We thank Wei Liu for technical assistance. This work was supported by the CIHR Training Program in Genetics, Child Development (Alberta Children’s Hospital Research Institute for Child, Maternal Health), a fellowship award from Alberta Innovates Health Solutions (P.N.G) and Natural Science and Engineering Research Council (NSERC), Canadian Foundation for Innovation, Alberta Innovates – Health Solutions and the University of Calgary grants to B.H. This work was supported by Canadian Institutes of Health Research grant to S.B.
REFERENCES CITED
- Bernstein RM. Growth-related hormones in great apes. Am. J. Phys. Anthropol. 2005;40:73–74. [Google Scholar]
- Bernstein RM, Leigh SR, Donovan SM, Monaco MH. Hormonal correlates of ontogeny in baboon (Papio hamadryas anubis) and mangabeys (Cercocebus atys) Am. J. Phys. Anthropol. 2008;136:156–168. doi: 10.1002/ajpa.20791. [DOI] [PubMed] [Google Scholar]
- Bills GC, Buschang PG, Ceen R, Hinton RJ. Timing effects of growth hormone supplementation on rat craniofacial growth. Eur. J. Orthod. 2008;30:153–162. doi: 10.1093/ejo/cjm101. [DOI] [PubMed] [Google Scholar]
- Boulesteix AL. A note on between-group PCA. International Journal of Pure and Applied Mathematics. 2005;19:359–366. [Google Scholar]
- Buschang PH, Baume RM, Nass GG. A craniofacial growth maturity gradient for males and females between 4 and 16 years of age. Am. J. Phy. Anthropol. 1983;61:373–81. doi: 10.1002/ajpa.1330610312. [DOI] [PubMed] [Google Scholar]
- Cantu G, Buschang PH, Gonzalez JL. Differential growth and maturation in idiopathic growth-hormone-deficient children. Eur. J. Orthod. 1997;19:131–139. doi: 10.1093/ejo/19.2.131. [DOI] [PubMed] [Google Scholar]
- Debat V, Béagin M, Legout H, David JR. Allometric and nonallometric components of Drosophila wing shape respond differently to developmental temperature. Evolution. 2003;57:2773–2784. doi: 10.1111/j.0014-3820.2003.tb01519.x. [DOI] [PubMed] [Google Scholar]
- Drake AG, Klingenberg CP. The pace of morphological change: historical transformation of skull shape in St. Bernard dogs. Proc R Soc Lond [Biol] 2008;275:71–76. doi: 10.1098/rspb.2007.1169. [DOI] [PMC free article] [PubMed] [Google Scholar]
- Flores-Morales A, Ståhlberg N, Tollet-Egnell P, Lundeberg J, Malek RL, Quackenbush J, Lee NH, Norstedt G. Microarray analysis of the in vivo effects of hypophysectomy and growth hormone treatment on gene expression in the rat. Endocrinology. 2001;142:3163–76. doi: 10.1210/endo.142.7.8235. [DOI] [PubMed] [Google Scholar]
- Enlow DH. Facial growth. Saunders; Philadelphia: 1990. [Google Scholar]
- Gaylinn BD, Dealmeida VI, Lyons CE, Jr, Wu KC, Mayo KE, Thorner MO. The mutant growth hormone-releasing hormone (GHRH) receptor of the little mouse does not bind GHRH. Endocrinology. 1999;140:5066–74. doi: 10.1210/endo.140.11.7092. [DOI] [PubMed] [Google Scholar]
- Giustina A, Mazziotti G, Canalis E. Growth hormone, insulin-like growth factors, and the skeleton. Endocr. Rev. 2008;29:535–59. doi: 10.1210/er.2007-0036. [DOI] [PMC free article] [PubMed] [Google Scholar]
- Gonzalez PN, Oyhenart E, Hallgrímsson B. Effects of environmental perturbations during postnatal development on the phenotypic integration of the skull. J. Exp. Zool. B Mol. Dev. Evol. 2011;316:547–61. doi: 10.1002/jez.b.21430. [DOI] [PMC free article] [PubMed] [Google Scholar]
- Hallgrímsson B, Jamniczky H, Young N, Rolian C, Parsons T, Boughner J, Marcucio R. Deciphering the palimpsest: studying the relationship between morphological integration and phenotypic covariation. Evol. Biol. 2009;36:355–376. doi: 10.1007/s11692-009-9076-5. [DOI] [PMC free article] [PubMed] [Google Scholar]
- Gould SJ. Allometry and size in ontogeny and phylogeny. Biol. Rev. 1966;41:587–640. doi: 10.1111/j.1469-185x.1966.tb01624.x. 587. [DOI] [PubMed] [Google Scholar]
- Hau M. Regulation of male traits by testosterone: implications for the evolution of vertebrate life histories. Bioessays. 2007;29:133–44. doi: 10.1002/bies.20524. [DOI] [PubMed] [Google Scholar]
- Huxley JS. A discussion on the measurement of growth and form; relative growth and form transformation. Proc. R. Soc. London Ser. B Biol. Sci. 1950;137:465–469. doi: 10.1098/rspb.1950.0055. [DOI] [PubMed] [Google Scholar]
- Kasukawa Y, Baylink DJ, Guo R, Mohan S. Evidence that sensitivity to Growth Hormone (GH) is growth period and tissue type dependent: Studies in GH-deficient lit/lit Mice. Endocrinology. 2003;144:3950–3957. doi: 10.1210/en.2002-0123. [DOI] [PMC free article] [PubMed] [Google Scholar]
- Ketterson ED, Atwell JW, McGlothlin JW. Phenotypic integration and independence: hormones, performance, and response to environmental change. Integrative and Comparative Biology. 2009;49:365–379. doi: 10.1093/icb/icp057. [DOI] [PMC free article] [PubMed] [Google Scholar]
- Kim HJ, Rice DP, Kettunen PJ. FGF-, BMP- and Shh-mediated signalling pathways in the regulation of cranial suture morphogenesis and calvarial bone development. Development. 1998;125:1241–1251. doi: 10.1242/dev.125.7.1241. [DOI] [PubMed] [Google Scholar]
- Klingenberg CP. MorphoJ: an integrated software package for geometric morphometrics. Mol. Ecol. Resour. 2011;11:353–357. doi: 10.1111/j.1755-0998.2010.02924.x. [DOI] [PubMed] [Google Scholar]
- Klingenberg CP, Spence JR. Heterochrony and allometry: lessons from the water strider genus Limnoporus. Evolution. 1993;47:1834–1853. doi: 10.1111/j.1558-5646.1993.tb01273.x. [DOI] [PubMed] [Google Scholar]
- Klingenberg CP, Barluenga M, Meyer A. Shape analysis of symmetric structures: quantifying variation among individuals and asymmetry. Evolution. 2002;56:1909–1920. doi: 10.1111/j.0014-3820.2002.tb00117.x. [DOI] [PubMed] [Google Scholar]
- Kristensen E, Hallgrímsson B, Morck DW, Boyd SK. Timing of growth hormone treatment affects trabecular bone microarchitecture and mineralization in growth hormone deficient mice. Bone. 2010;47:295–300. doi: 10.1016/j.bone.2010.04.587. [DOI] [PubMed] [Google Scholar]
- Kristensen E, Hallgrímsson B, Morck DW, Boyd SK. Microarchitecture, but not bone mechanical properties, is rescued with growth hormone treatment in a mouse model of growth hormone deficiency. Int. J. Endocrinology. 2012 doi: 10.1155/2012/294965. Accepted for publication. [DOI] [PMC free article] [PubMed] [Google Scholar]
- Krishnan V, Bryant HU, MacDougald OA. Regulation of bone mass by Wnt signaling. J Clin. Invest. 2006;116:1202–1209. doi: 10.1172/JCI28551. [DOI] [PMC free article] [PubMed] [Google Scholar]
- Le Roith D, Bondy C, Yakar S, Liu JL, Butler A. The somatomedin hypothesis. Endocr. Rev. 2001;22:53–74. doi: 10.1210/edrv.22.1.0419. [DOI] [PubMed] [Google Scholar]
- McBratney-Owen B, Iseki S, Bamforth SD, Olsen BR, Morriss-Kay GM. Development and tissue origins of the mammalian cranial base. Dev. Biol. 2008;322:121–132. doi: 10.1016/j.ydbio.2008.07.016. [DOI] [PMC free article] [PubMed] [Google Scholar]
- Mitteroecker P, Gunz P, Bernhard M, Schaefer K, Bookstein FL. Comparison of cranial ontogenetic trajectories among hominoids. J. Hum. Evol. 2004;46:679–698. doi: 10.1016/j.jhevol.2004.03.006. [DOI] [PubMed] [Google Scholar]
- Mitteroecker P, Gunz P, Bookstein FL. Heterochrony and geometric morphometrics: a comparison of cranial growth in Pan paniscus versus Pan troglodytes. Evol. Dev. 2005;7:244–258. doi: 10.1111/j.1525-142X.2005.05027.x. [DOI] [PubMed] [Google Scholar]
- Monteiro LR. Multivariate regression models and geometric morphometrics: The search for causal factors in the analysis of shape. Syst. Biol. 1999;48:192–199. doi: 10.1080/106351599260526. [DOI] [PubMed] [Google Scholar]
- Morriss-Kay GM. Derivation of the mammalian skull vault. J. Anat. 2001;199:143–151. doi: 10.1046/j.1469-7580.2001.19910143.x. [DOI] [PMC free article] [PubMed] [Google Scholar]
- Nijhout HF. The control of growth. Development. 2003;130:5863–5867. doi: 10.1242/dev.00902. [DOI] [PubMed] [Google Scholar]
- Nijhout HF. Developmental phenotypic landscapes. Evol. Biol. 2008;35:100–103. [Google Scholar]
- Nijhout HF, German RZ. Developmental causes of allometry: new models and implications for phenotypic plasticity and evolution. Int. Comp. Biol. 2012;52:43–52. doi: 10.1093/icb/ics068. [DOI] [PMC free article] [PubMed] [Google Scholar]
- Opperman LA, Passarelli RW, Morgan EP. Cranial sutures require tissue interactions with dura mater to resist osseous obliteration in vitro. J. Bone Miner. Res. 1995;10:1978–1987. doi: 10.1002/jbmr.5650101218. [DOI] [PubMed] [Google Scholar]
- Parker J. Morphogens, nutrients, and the basis of organ scaling. Evol. Dev. 2011;13:3–304. doi: 10.1111/j.1525-142X.2011.00481.x. 314. [DOI] [PubMed] [Google Scholar]
- Quarto N, Behr B, Li S, Longaker MT. Differential FGF ligands and FGF receptors expression pattern in frontal and parietal calvarial bones. Cells Tissues Organs. 2009;190:158–69. doi: 10.1159/000202789. [DOI] [PMC free article] [PubMed] [Google Scholar]
- Pinheiro J, Bates D, DebRoy S, Sarkar D, R Development Core Team nlme: Linear and Nonlinear Mixed Effects Models. R package version 3. 2012:1–104. [Google Scholar]
- Randhawa R, Cohen P. The role of the insulin-like growth factor system in prenatal growth. Mol. Genet. Metab. 2005;86:84–90. doi: 10.1016/j.ymgme.2005.07.028. [DOI] [PubMed] [Google Scholar]
- Rice DPC, Roberts GJ, Thomas ML. Catch-up growth induced by growth hormone in the craniofacial skeleton of the Snell strain of the hypopituitary dwarf mouse. Eur. J. Orthod. 1997;19:141–150. doi: 10.1093/ejo/19.2.141. [DOI] [PubMed] [Google Scholar]
- Rice DP, Rice R, Thesleff I. Fgfr mRNA isoforms in craniofacial bone development. Bone. 2003;33:14–27. doi: 10.1016/s8756-3282(03)00163-7. [DOI] [PubMed] [Google Scholar]
- Rohlf FJ, Slice DE. Extensions of the Procrustes Method for the optimal superimposition of landmarks. Syst. Zool. 1990;39:40–59. [Google Scholar]
- Sheets HD, Covino KM, Panasiewicz JM, Morris SR. Comparison of geometric morphometric outline methods in the discrimination of age-related differences in feather shape. Front. Zool. 2006;3:15. doi: 10.1186/1742-9994-3-15. [DOI] [PMC free article] [PubMed] [Google Scholar]
- Singleton DA, Buschang PH, Behrents RG, Hinton RJ. Craniofacial growth in growth hormone-deficient rats after growth hormone supplementation. Am. J. Orthod. Dentofacial Orthop. 2006;130:69–82. doi: 10.1016/j.ajodo.2005.02.016. [DOI] [PubMed] [Google Scholar]
- Sutter NB, Bustamante CD, Chase K, Gray MM, Zhao K, Zhu L, Padhukasahasram B, Karlins E, Davis S, Jones PG, et al. A single IGF1 allele is a major determinant of small size in dogs. Science. 2007;316:112–115. doi: 10.1126/science.1137045. [DOI] [PMC free article] [PubMed] [Google Scholar]
- Thissen JP, Keteslegers JM, Underwood LE. Nutritional regulation of the insulin-like growth factors. Endocr. Rev. 1994;15:80–101. doi: 10.1210/edrv-15-1-80. [DOI] [PubMed] [Google Scholar]
- Vandeberg JR, Buschang PH, Hinton RJ. Craniofacial growth in growth hormone-deficient rats. Anat. Rec. A Discov. Mol. Cell. Evol. Biol. 2004;278:561–70. doi: 10.1002/ar.a.20051. [DOI] [PubMed] [Google Scholar]
- Waters MJ, Kaye PL. The role of growth hormone in fetal development. Growth Hormone & IGF Research. 2002;12:137–46. doi: 10.1016/s1096-6374(02)00018-7. [DOI] [PubMed] [Google Scholar]
- Wiley DF, Amenta N, Alcantara DA, Ghosh D, Kil YJ, Delson E, Harcourt-Smith W, Rohlf FJ, St. John K, Hamann B. Evolutionary morphing; Proceedings of the IEEE Visualization 2005 (VIS ’05); Minneapolis. 2005. pp. 431–438. [Google Scholar]
- Willmore KE, Leamy L, Hallgrímsson B. Effects of developmental and functional interactions on mouse cranial variability through late ontogeny. Evol. Dev. 2006;8:550–567. doi: 10.1111/j.1525-142X.2006.00127.x. [DOI] [PubMed] [Google Scholar]
- Zelditch M, Lundrigan B, Sheetsà D, Garland T., Jr. Do precocial mammals develop at a faster rate?? A comparison of rates of skull development in Sigmodon fulviventer and Mus musculus domesticus. J. Evol. Biol. 2003;16:708–720. doi: 10.1046/j.1420-9101.2003.00568.x. [DOI] [PubMed] [Google Scholar]


