Abstract

Heme-carbonyl complexes are widely exploited for the insight they provide into the structural basis of function in heme-based proteins, by revealing the nature of their bonded and nonbonded interactions with the protein. This report presents two novel results which clearly establish a FeCO vibrational signature for crystallographically verified pentacoordination. First, anisotropy in the NRVS density of states for νFe–C and δFeCO in oriented single crystals of [Fe(OEP)(CO)] clearly reveals that the Fe–C stretch occurs at higher frequency than the FeCO bend and considerably higher than any previously reported heme carbonyl. Second, DFT calculations on a series of heme carbonyls reveal that the frequency crossover occurs near the weak trans O atom donor, furan. As νFe–C occurs at lower frequencies than δFeCO in all heme protein carbonyls reported to date, the results reported herein suggest that they are all hexacoordinate.
Carbon monoxide (CO) is an important molecule in biology. In addition to its well-known toxicity, it serves roles with survival value, including cardiovascular1 and circadian2 signaling in humans. Additionally, it is the target of several two-component bacterial signaling systems wherein changes in its partial pressure elicit changes in gene transcription.3 As a research tool, heme-carbonyl complexes are widely exploited for the insight they provide into the structural basis of function in heme-based proteins.4−7 Their FeCO vibrational signatures constitute a sensitive probe of the ligand trans to CO, FeCO bonding, and electrostatic landscape of the distal pockets of heme proteins. Herein we present a novel vibrational signature for the pentacoordinate (5-c) [Fe(OEP)(CO)], along with computational evidence that it is generally diagnostic for pentacoordination.
The fundamental basis for FeCO vibrational trends is important insofar as their sensitivities to protein and enzyme environments reveal correlations between structure, bonding, and function. However, as the breadth of recognized heme protein functions grows, pursuit of their structural bases through carbonyl spectroscopy will depend increasingly on a firm understanding of their bonding, consistent with both theory and experiment. We have explored the intrinsic relationships between L–Fe–CO bonding and the vibrational signature of the FeCO moiety through complementary experimental and theoretical approaches. This report presents two novel results relevant to structure and bonding in heme carbonyls.
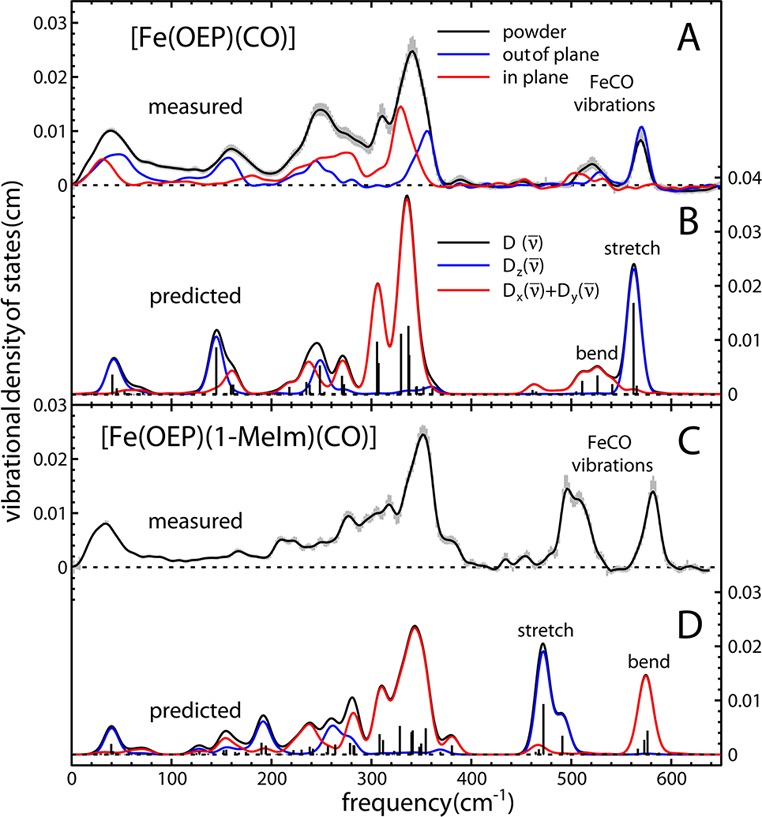
First, vibrational spectra were recorded by nuclear resonance vibrational spectroscopy (NRVS) from a single crystal of [Fe(OEP)(CO)] oriented with the porphyrin planes either parallel or perpendicular to the propagation direction of the X-ray beam.8,9 Thus, based on orientation, bands arising from modes in which the iron atom has in-plane and out-of-plane momentum can be unambiguously assigned. The experimental VDOS are shown in Figure 1A. Iron-CO vibrations dominate the Fe VDOS determined for heme carbonyls above 400 cm–1 with bands at 505 and 573 cm–1, within the frequency range where νFe–C and δFeCO bands occur. Figure 1A shows that the 573 cm–1 band is only present in the spectrum recorded with the porphyrin planes oriented perpendicular (blue) to the X-ray beam. Iron motion perpendicular to the porphyrin plane clearly identifies νFe–C at a frequency higher than the δFeCO modes, for which Fe moves parallel to the plane. In-plane signal for the 505 cm–1 band (red) indicates iron momentum parallel to the porphyrin plane, providing for its unambiguous assignment to the FeCO bending modes, δFeCO. Good agreement with the computed VDOS in Figure 1B confirms the character of the observed vibrational contributions in Figure 1A. These data establish a unique vibrational signature for the 5-c heme carbonyl and constitute the first experimental verification that νFe–C occurs at higher energy than δFeCO in 5-c heme carbonyls. An analogous frequency inversion takes place between five- and six-coordinate heme nitrosyls.10 Hence, the 573 cm–1 frequency establishes a new upper limit for the range of νFe–C modes in heme carbonyls. Figure 1C shows the NRVS spectrum recorded from a polycrystalline powder of [Fe(OEP)(1-MeIm)(CO)] with the computed parallel and perpendicular spectra being shown in Figure 1D. In contrast to the [Fe(OEP)(CO)] spectra, the Fe VDOS determined from NRVS measurements on the powder in conjunction with their predicted directional contributions reveal the νFe–C frequency to be significantly lower than the δFeCO frequency, as observed for other hexacoordinate (6-c) heme carbonyls.9,11 Thus, the assignments for the hexacoordinate complex have the ordinary frequency ordering wherein the stretch occurs lower than the bend. The DFT-basis for these assignments is confirmed by those for [Fe(TPP)(1-MeIm)(CO)], which were based on NRVS measurements on oriented single crystals.9
Figure 1.

Experimental and calculated NRVS vibrational density of states (VDOS) for the Fe atom in [Fe(OEP)(CO)] and [Fe(OEP)(1-MeIm)(CO)] versus wavenumber shift. (A) Experimental VDOS derived from NRVS measurements on single crystal [Fe(OEP)(CO)]. These measurements yield the directional contributions to the Fe VDOS of a polycrystalline powder (gray error bars with black trace). (B) Calculated VDOS for parallel (red), perpendicular (blue), and powder (black). (C) Experimentally derived VDOS for powdered [Fe(OEP)(1-MeIm)(CO)]. (D) Oriented VDOS predicted from DFT calculations, revealing the νFe–C frequency below that of δFeCO.
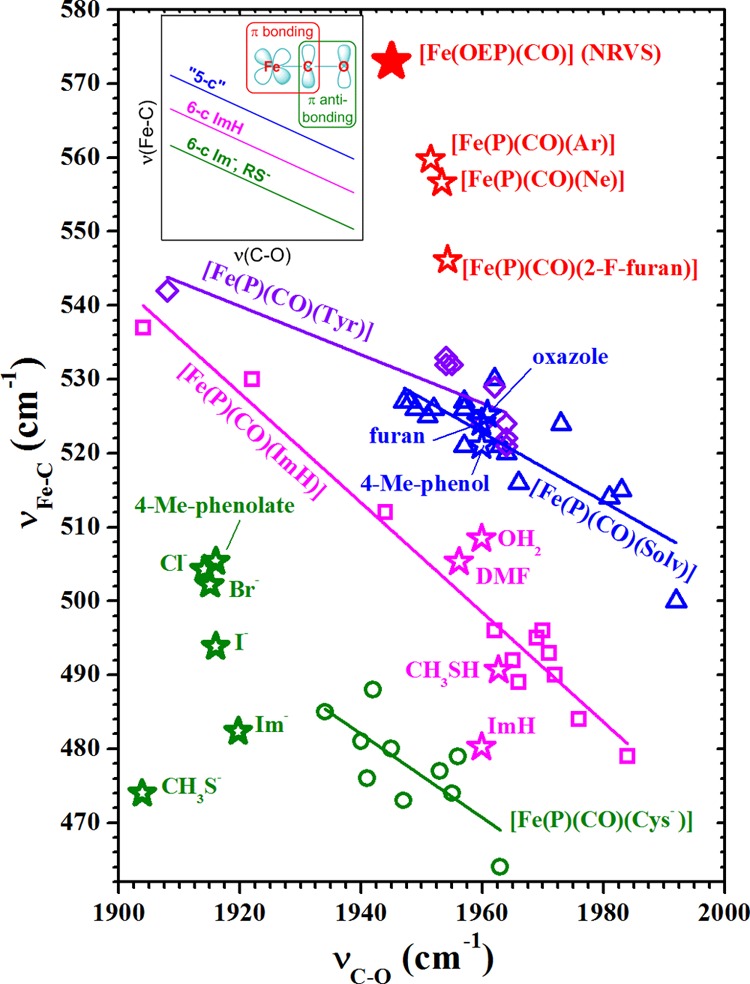
As the HOMOs of heme carbonyls are π bonding with respect to Fe–C and π antibonding with respect to C–O, polarizing influences on π-e– density strengthens and weakens the Fe–C and C–O π bonds, respectively, or vice versa. Thus, a plot of RFe–C vs RC–O has a negative slope.12 As frequency differences for νFe–C and νC–O of different carbonyls report differences in their Fe–C and C–O bond strengths, a plot of νFe–C vs νC–O reveals them to be inversely correlated as well.4,5 Heme carbonyls having the same or similar trans ligands fall on the same line. The observation of multiple lines has been rationalized in terms of a trans effect. These relationships are illustrated in the inset of Figure 2. The lowest and middle lines correlate 6-c heme carbonyls having proximal imidazolate (Im–) or thiolate (RS–) ligands and imidazole (ImH) ligands, respectively. The highest line has been attributed to 5-c heme carbonyls.13 Location toward the left end of a line indicates strong distal H-bond donation to CO or positive electrostatic potential. Locations toward the right are typical of weak or no H-bond donation. Structural and vibrational data are sparse for 5-c heme carbonyls. In the reported systems, νFe–C frequencies lie ∼25 cm–1 higher than those for 6-c complexes; νC–O falls in the same range. No band clearly assignable to δFeCO has been reported for a 5-c CO adduct. A number of heme carbonyls in proteins21−23 and in weakly or noncoordinating solvents4,13 have been shown to fall along the highest backbonding correlation line and concluded to be 5-c.
Figure 2.

Backbonding correlation plot showing the position of [Fe(OEP)(CO)] (solid red star, νCO from FTIR)15 with its uniquely high experimental νFe–C frequency, which along with 2-F-furan, Ne and Ar (open red stars), lies well above the correlation lines shown in the inset backbonding scheme. The open round (green, anionic), square (magenta, neutral), and triangular (blue, trans-O-bound) points were taken from ref (9). The diamond (violet, trans-Tyr) points are Tyr-liganded proteins.7,18 The νFe–C and νC–O frequencies for the trans-ligands next to the open star-shaped points were calculated via DFT [B3LYP/6-311G(d,p)]19 in this study. Frequencies were scaled to those of [Fe(OEP)(CO)]. Table S3 lists unscaled νFe–C and δFeCO. Scaling factors given in text.
Figure 2 shows the extraordinarily high position of [Fe(OEP)(CO)] on the backbonding correlation plot relative to reported and calculated (this study, open stars) complexes, including some synthetic heme carbonyls (blue) assigned earlier as 5-c.4,13 It has been suggested that elevated νFe–C frequencies can be caused by steric compression of the FeCO triatomic unit.14 Neither of the two reported [Fe(OEP)(CO)] crystal structures show nearest-neighbor interactions that could compress the FeCO bond.15 The high δFe–C frequency in 6-c heme carbonyls has been attributed to diminished pseudo-Jahn–Teller instability along the e symmetry displacement because of an increased energy gap between a1 and e orbitals caused by σ* interaction between the iron dz2 orbital and the σ orbital from the trans axial ligand.16,17
Many investigations have established the negative slopes shown in Figure 2. These π-backbonding correlation lines are offset along the νFe–C axis according to the nature of the trans ligand. The physical basis of the offset is thought to be modulation of Fe–C σ bonding and HOMO electron density on FeCO by ligand charge and basicity. The extraordinarily high position of [Fe(OEP)CO] in Figure 2 and the ordinary frequency ordering of νFe–C and δFeCO for all reported heme carbonyls constitute compelling evidence that heme-CO complexes previously assigned as 5-c have significant trans ligand fields. Thus, we reconsider the coordination chemistry of heme-CO.
As a means of probing the relationship between trans ligand field and frequency ordering of the FeCO bend and stretch, DFT calculations were carried out for a series of in silico porphine complexes, [Fe(P)(L)(CO)], in which the trans ligand, L, ranged in strength from CH3S– and Im– to Ne and Ar atoms. In order to calibrate this approach, minimized structures and vibrational frequencies of [Fe(P)(ImH)(CO)] and [Fe(P)(CO)] were calculated using a number of GGA and hybrid DFT methods. Tables S1 and S2 list calculated FeCO bond length and vibrational parameters for the 6-c ImH and 5-c complexes, respectively, with experimental values listed for comparison. Overall agreement between computed and experimental values in Tables S1 and S2 is satisfactory.15 The optimized structure and vibrational frequencies were also calculated for [Fe(OEP)(CO)], the molecule used in the NRVS experiments described above. Calculated parameters are in good agreement with experiment (Table S2), lending validity to the relative bond lengths and frequencies calculated for the simpler 6-c ImH and 5-c heme carbonyls. All methods yield changes in bond lengths consistent with available crystal structure data.12,15 Consistent with the NRVS data in Figure 1, all show reversal of the νFe–C and δFeCO frequencies between the 6-c and 5-c complexes. Overall agreement with experimental values of FeCO bond lengths and vibrational frequencies leads us to use the B3LYP results in the ensuing discussion. However, whether one considers values calculated by a GGA method, such as BLYP, or a hybrid method like B3LYP, the conclusions are unchanged.
Points corresponding to the in silicotrans-ligand complexes in Figure 2 fall into two narrow νC–O frequency ranges, one for neutral ligands near 1960 cm–1 and the other between 1900 and 1920 cm–1 for anionic ligands. The νC–O regions are narrow because there are no nonbonded interactions to influence backbonding in these isolated molecules and they are relatively insensitive to the σ-donor effects thought to be the origin of the trans-ligand effect on νFe–C frequency. The separation based on charge is attributed to increased electrostatic polarization of the d-π electrons toward CO by anionic trans ligands with the result of weakening the CO bond. Distribution of the anionic ligand points along the νFe–C axis is attributable to their range of σ donor strengths (i.e., Brønsted basicity). These correlations suggest that all complexes on the blue and violet correlation lines in Figure 2, including the Tyr-liganded proteins, contain neutral O atom donor ligands.
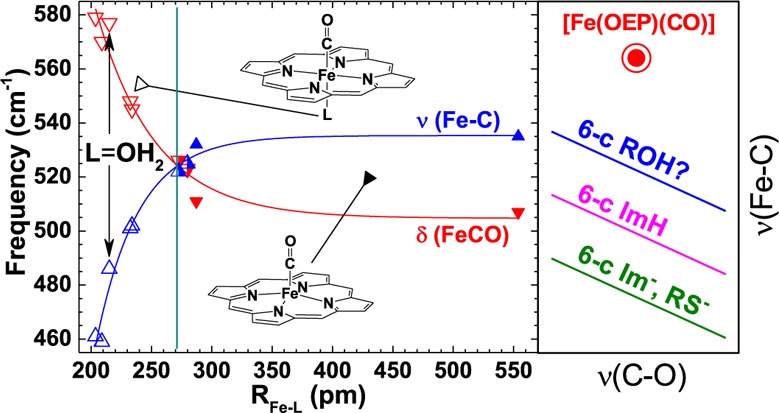
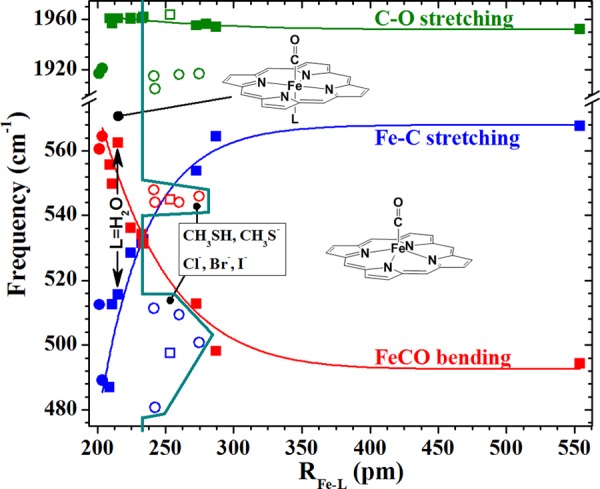
These results reveal systematic interplay between Fe–L bond distance (RFe–L) and (a) RFe–C and νFe–C frequency, (b) δFeCO frequency, and (c) displacement of the Fe atom from the mean 4-Npyrrole plane of the porphyrin (RFe–Ct, see Figure S1). Figure 3 shows plots of calculated νFe–C, δFeCO, and νC–O frequencies versus RFe–L (Table S3). The calculated νFe–C, δFeCO, and νC–O frequencies were scaled by 1.061, 0.9749, and 0.9342, respectively, to calibrate them to the experimental NRVS frequencies. This plot reveals that the νFe–C and δFeCO lines cross at a value of RFe–L near furan. As an exceedingly weak base, furan is likely a weaker ligand than water, which is corroborated by their calculated Fe–L bond lengths. Positions along the curves to the left of the crossover point are characterized by νFe–C occurring at lower frequency than δFeCO. To the right of the crossover point, that frequency ordering is reversed. These curves provide insight into the strength of the trans ligand field required to drive the νFe–C below that of δFeCO. Although the positions of ligands that bond through atoms from below the second row are offset from the curves toward longer RFe–L, their νFe–C, δFeCO frequency ordering is characteristic of hexacoordination. These offsets are attributed to their large covalent radii and, in the case of the halides and thiolate, their negative charge. Note that this plot also reflects the effect of negative charge on the νC–O frequencies seen in Figure 2.
Figure 3.

Calculated Fe–C stretching (blue), FeCO bending (red), and C–O stretching (green) frequencies, showing correlations with calculated trans-Fe–L bond distances. Neutral and anionic ligands are indicated by squares and circles, respectively. Solid points indicate ligands that coordinate through atoms from the second row of the periodic table. Ligands having coordinating atoms from the third to fifth rows are shown by open symbols. Negative charge significantly reduces the otherwise nearly invariant νC–O frequencies but has little effect on the correlation of νFe–C and δFeCO. Heavy atom ligands are shown as open points. Frequencies and RFe–L values are listed in Table S3. The turquoise line marks RFe–L at the bend–stretch crossover and extends around the heavier-atom ligands to show that they form 6-c heme carbonyls, albeit on different, but currently indeterminant trend lines.
Interest in authentic 5-c heme carbonyls has been refocused in part through pursuit of the structural basis of mechanism in the NO receptor, soluble guanylyl cyclase (sGC).20−22 The cyclase activity of sGC is triggered by release of the proximal His ligand from its heme upon coordination of NO to yield a 5-c {FeNO}7 complex. In contrast, exposure of the enzyme to CO forms a 6-c complex in which the proximal His remains coordinated to iron with little induction of activity. Effector molecules have been shown to drive formation of a new CO adduct characterized by intermediate enzyme activity along with higher νFe–C and lower νC–O frequencies, +33 and −12 cm–1, respectively.20,22 Addition of the substrate, GTP, increases the population of that sGC–CO form,20 which falls on the highest backbonding correlation line in Figure 2. Other CO complexes of heme-containing proteins and enzymes also fall on that correlation line, including cytochrome c oxidase,23 the heme catalases,18 and a number of recently discovered bacterial heme trafficking proteins having proximal Tyr ligands.7,24 A number of tetraarylporphyrin derivatives, prepared in wet organic solvents, also fall on that line.13 Except for the proteins having proximal Tyr ligands, a position along that line has heretofore been taken as diagnostic for either a 5-c or distally compressed heme carbonyl.4,23 By virtue of the FeCO frequency shifts and the inducement of sGC–CO activity in the presence of effector, the active state of sGC–CO has also been concluded to be 5-c.20,21 However, given that their correlation line falls between the authentic 5-c point reported herein and the two lowest correlation lines on the νFe–C axis (Figure 2), their coordination sites trans to CO are likely to be occupied by a relatively weak ligand. We suggest that such ligands must drive π-electron density into the FeCO region of the HOMO, such that the π-bonding character of the Fe–C bond is increased. A list of candidate ligands would include charge-neutral π-donor ligands, such as water, alcohols, ethers, and phenols. Of these, water and the phenol side chain of Tyr7,24 are the most likely ligands in a heme protein. All of these ligands are weakly π donating and, consequently, occupy low to intermediate positions in the classical spectrochemical series. Thus, the bias effects of proximal ligand bonding on the heights of the correlation lines along the νFe–C axis appear more nuanced than previously thought.
A previous DFT result predicted νFe–C to occur at higher energy than δFeCO in a 5-c heme carbonyl.16 We have reproduced that result using a variety of DFT functionals. However, NRVS evidence of authentic pentacoordination appears tenuous.22 The 520 and 550 cm–1 frequencies assigned to νFe–C and δFeCO would put their complex far below the position shown in Figure 2 for a 5-c heme carbonyl. This may be due to coordination of H2O from addition of aqueous dithionite. However, small NRVS bands were observed at ∼505 and ∼580 cm–1. Even though the authors did not discuss these bands16 and the directionalities of their Fe motions were not discernible in frozen toluene solution, their VDOS suggest a small amount of the 5-c heme carbonyl.
In summary, the experimental results presented herein demonstrate with unprecedented clarity that the FeCO vibrational signature of crystallographically verified 5-c [Fe(OEP)(CO)]15 is distinct from any previously reported heme carbonyl. Its νFe–C band occurs at higher frequency than δFeCO. We attribute this distinction to the absence of any bound ligand trans to CO. Computational evidence strongly suggests that any exogenous or endogenous axial ligands relevant to heme proteins are strong enough to drive νFe–C to lower frequency than δFeCO. This work brings us to the hypothesis that all heme carbonyls reported to date, whether synthetic or in heme proteins, are hexacoordinate.
Acknowledgments
This work was supported by grants from the NIH; AI072719 (K.R.R.), GM38401 (W.R.S.), and from the NSF; CHE-1026369 (J.T.S.). The Advanced Photon Source is supported by the U.S. DOE under contract no. DE-AC02-06CH11357.
Supporting Information Available
Materials and methods, Tables S1–S3, Figure S1, complete ref (19). This material is available free of charge via the Internet at http://pubs.acs.org.
Author Present Address
# Deptment of Chemistry and Physics, Southwestern Oklahoma State University, Weatherford, OK 73096.
Author Present Address
∥ Moscow Institute of Physics and Technology, Moscow, Russia.
The authors declare no competing financial interest.
Funding Statement
National Institutes of Health, United States
Supplementary Material
References
- Rochette L.; Cottin Y.; Zeller M.; Vergely C. Pharmacol. Ther. 2013, 137, 133. [DOI] [PubMed] [Google Scholar]; Marcantoni E.; Di Francesco L.; Dovizio M.; Bruno A.; Patrignani P. Int. J. Hypertens. 2012, 127910. [DOI] [PMC free article] [PubMed] [Google Scholar]; Gullotta F.; Masi A. d.; Ascenzi P. IUBMB Life 2012, 64, 378. [DOI] [PubMed] [Google Scholar]; Motterlini R.; Otterbein L. E. Nat. Rev. Drug Discovery 2010, 9, 728. [DOI] [PubMed] [Google Scholar]; Siow R. C. M.; Sato H.; Mann G. E. Cardiovasc. Res. 1999, 41, 385. [DOI] [PubMed] [Google Scholar]
- Lukat-Rodgers G. S.; Correia C.; Botuyan M. V.; Mer G.; Rodgers K. R. Inorg. Chem. 2010, 49, 6349. [DOI] [PMC free article] [PubMed] [Google Scholar]; Ozkan H.; Tuzun F.; Kumral A.; Yesilirmak D.; Duman N. Med. Hypotheses 2008, 71, 879. [DOI] [PubMed] [Google Scholar]; Kitanishi K.; Igarashi J.; Hayasaka K.; Hikage N.; Saiful I.; Yamauchi S.; Uchida T.; Ishimori K.; Shimizu T. Biochemistry 2008, 47, 6157. [DOI] [PubMed] [Google Scholar]; Uchida T.; Sato E.; Sato A.; Sagami I.; Shimizu T.; Kitagawa T. J. Biol. Chem. 2005, 280, 21358. [DOI] [PubMed] [Google Scholar]; Dioum E. M.; Rutter J.; Tuckerman J. R.; Gonzalez G.; Gilles-Gonzalez M. A.; McKnight S. L. Science 2002, 298, 2385. [DOI] [PubMed] [Google Scholar]
- Karunakaran V.; Benabbas A.; Youn H.; Champion P. M. J. Am. Chem. Soc. 2011, 133, 18816. [DOI] [PMC free article] [PubMed] [Google Scholar]; Marvin K. A.; Kerby R. L.; Youn H.; Roberts G. P.; Burstyn J. N. Biochemistry 2008, 47, 9016. [DOI] [PMC free article] [PubMed] [Google Scholar]; Komori H.; Inagaki S.; Yoshioka S.; Aono S.; Higuchi Y. J. Mol. Biol. 2007, 367, 864. [DOI] [PubMed] [Google Scholar]; Ibrahim M.; Kuchinskas M.; Youn H.; Kerby R. L.; Roberts G. P.; Poulos T. L.; Spiro T. G. J. Inorg. Biochem. 2007, 101, 1776. [DOI] [PMC free article] [PubMed] [Google Scholar]; Lanzilotta W. N.; Schuller D. J.; Thorsteinsson M. V.; Kerby R. L.; Roberts G. P.; Poulos T. L. Nat. Struct. Biol. 2000, 7, 876. [DOI] [PubMed] [Google Scholar]; Shelver D.; Thorsteinsson M. V.; Kerby R. L.; Chung S. Y.; Roberts G. P.; Reynolds M. F.; Parks R. B.; Burstyn J. N. Biochemistry 1999, 38, 2669. [DOI] [PubMed] [Google Scholar]; Rodgers K. R. Curr. Opin. Chem. Biol. 1999, 3, 158. [DOI] [PubMed] [Google Scholar]
- Spiro T. G.; Soldatova A. V.; Balakrishnan G. Coord. Chem. Rev. 2013, 257, 511. [DOI] [PMC free article] [PubMed] [Google Scholar]
- Spiro T. G.; Wasbotten I. H. J. Inorg. Biochem. 2005, 99, 34. [DOI] [PubMed] [Google Scholar]; Linder D. P.; Rodgers K. R.; Banister J.; Wyllie G. R. A.; Ellison M. K.; Scheidt W. R. J. Am. Chem. Soc. 2004, 126, 14136. [DOI] [PMC free article] [PubMed] [Google Scholar]
- Vogel K. M.; Kozlowski P. M.; Zgierski M. Z.; Spiro T. G. J. Am. Chem. Soc. 1999, 121, 9915. [Google Scholar]; Streit B. R.; Blanc B.; Lukat-Rodgers G. S.; Rodgers K. R.; DuBois J. L. J. Am. Chem. Soc. 2010, 132, 5711. [DOI] [PMC free article] [PubMed] [Google Scholar]
- Lukat-Rodgers G. S.; Rodgers K. R.; Caillet-Saguy C.; Izadi-Pruneyre N.; Lecroisey A. Biochemistry 2008, 47, 2087. [DOI] [PubMed] [Google Scholar]
- Lehnert N.; Sage J. T.; Silvernail N.; Scheidt W. R.; Alp E. E.; Sturhahn W.; Zhao J. Inorg. Chem. 2010, 49, 7197. [DOI] [PMC free article] [PubMed] [Google Scholar]
- Leu B. M.; Silvernail N. J.; Zgierski M. Z.; Wyllie G. R. A.; Ellison M. K.; Scheidt W. R.; Zhao J.; Sturhahn W.; Alp E. E.; Sage J. T. Biophys. J. 2007, 92, 3764. [DOI] [PMC free article] [PubMed] [Google Scholar]
- Zeng W.; Silvernail N. J.; Wharton D. C.; Georgiev G. Y.; Leu B. M.; Scheidt W. R.; Zhao J.; Sturhahn W.; Alp E. E.; Sage J. T. J. Am. Chem. Soc. 2005, 127, 11200. [DOI] [PMC free article] [PubMed] [Google Scholar]; Pavlik J. W.; Barabanschikov A.; Oliver A. G.; Alp E. E.; Sturhahn W.; Zhao J.; Sage J. T.; Scheidt W. R. Angew. Chem., Int. Ed. 2010, 49, 4400. [DOI] [PMC free article] [PubMed] [Google Scholar]
- Rai B. K.; Durbin S. M.; Prohofsky E. W.; Sage J. T.; Ellison M. K.; Roth A.; Scheidt W. R.; Sturhahn W.; Alp E. E. J. Am. Chem. Soc. 2003, 125, 6927. [DOI] [PubMed] [Google Scholar]
- Silvernail N. J.; Roth A.; Schulz C. E.; Noll B. C.; Scheidt W. R. J. Am. Chem. Soc. 2005, 127, 14422. [DOI] [PMC free article] [PubMed] [Google Scholar]
- Vogel K. M.; Kozlowski P. M.; Zgierski M. Z.; Spiro T. G. Inorg. Chim. Acta 2000, 297, 11. [Google Scholar]
- Ray G. B.; Li X. Y.; Ibers J. A.; Sessler J. L.; Spiro T. G. J. Am. Chem. Soc. 1994, 116, 162. [Google Scholar]; Hashimoto T.; Baldwin J. E.; Basolo F.; Dyer R. L.; Crossley M. J. J. Am. Chem. Soc. 1982, 104, 2101. [Google Scholar]
- Silvernail N. J.; Noll B. C.; Schulz C. E.; Scheidt W. R. Inorg. Chem. 2006, 45, 7050. [DOI] [PMC free article] [PubMed] [Google Scholar]
- Ohta T.; Liu J.-G.; Saito M.; Kobayashi Y.; Yoda Y.; Seto M.; Naruta Y. J. Phys. Chem. B 2012, 116, 13831. [DOI] [PubMed] [Google Scholar]
- Ghosh A.; Bocian D. F. J. Phys. Chem. 1996, 100, 6363. [DOI] [PubMed] [Google Scholar]
- Hu S.; Kincaid J. R. FEBS Lett. 1992, 314, 293. [DOI] [PubMed] [Google Scholar]
- Frisch M. J.et al. , Gaussian 03, version B.05 or C.02; Gaussian, Inc.: Wallingford, CT, 2004.
- Pal B.; Tanaka K.; Takenaka S.; Kitagawa T. J. Raman Spectrosc. 2010, 41, 1178. [Google Scholar]
- Ibrahim M.; Derbyshire E. R.; Marletta M. A.; Spiro T. G. Biochemistry 2010, 49, 3815. [DOI] [PMC free article] [PubMed] [Google Scholar]
- Li Z.; Pal B.; Takenaka S.; Tsuyama S.; Kitagawa T. Biochemistry 2005, 44, 939. [DOI] [PubMed] [Google Scholar]; Makino R.; Obayashi E.; Homma N.; Shiro Y.; Hori H. J. Biol. Chem. 2003, 278, 11130. [DOI] [PubMed] [Google Scholar]
- Wang J.; Takahashi S.; Hosler J. P.; Mitchell D. M.; Ferguson-Miller S.; Gennis R. B.; Rousseau D. L. Biochemistry 1995, 34, 9819. [DOI] [PubMed] [Google Scholar]; Das T. K.; Tomson F. L.; Gennis R. B.; Gordon M.; Rousseau D. L. Biophys. J. 2001, 80, 2039. [DOI] [PMC free article] [PubMed] [Google Scholar]
- Eakanunkul S.; Lukat-Rodgers G. S.; Sumithran S.; Ghosh A.; Rodgers K. R.; Dawson J. H.; Wilks A. Biochemistry 2005, 44, 13179. [DOI] [PubMed] [Google Scholar]
Associated Data
This section collects any data citations, data availability statements, or supplementary materials included in this article.


