

Abstract
Context:
The effect of obesity and concomitant insulin resistance on pubertal development is incompletely elucidated.
Objective:
To determine how measures of adiposity and insulin resistance are associated with pubertal maturation in boys and girls.
Setting and Design:
Breast and pubic hair Tanner stage and testicular volume by orchidometry were determined by physical examination in 1066 children. Ovarian volume was estimated by trans-abdominal ultrasound. Fat mass, skeletal age, and fasting serum for insulin and glucose, total T, estradiol, estrone, dehydroepiandrosterone-sulfate, and androstenedione were measured at the National Institutes of Health Clinical Research Center. Convenience sample; 52% obese, 59% female.
Results:
Logistic regression identified a significant interaction between sex and obesity for prediction of pubertal development (P ≤ .01). There was a negative association between boys' testicular volume and body mass index (BMI)/fat mass but a positive association between girls' breast stage and BMI/fat mass. Ovarian volume in girls was positively associated with insulin resistance but not with BMI/fat mass. There was a positive association between obesity and measures of estrogen exposure (breast development and skeletal age) in both sexes. Positive correlations were seen for girls between BMI and pubic hair development and between insulin resistance and T production, whereas adiposity was negatively associated with pubic hair in boys.
Conclusions:
Significant sexual dimorphisms in the manifestations of pubertal development are seen in obese girls and boys. Two known effects of obesity, increased peripheral conversion of low-potency androgens to estrogens by adipose tissue-aromatase and increased insulin resistance, may be in large part responsible for these differences.
Analyses of secular trends in the United States (1) suggest that the average age for thelarche, the secondary sexual characteristic most associated with gonadarche in girls, decreased during the latter half of the twentieth century. During this same interval, the prevalence of pediatric obesity, defined as a body mass index (BMI) at or above the 95th percentile for age and sex based on United States national standards, tripled (2), leading to speculation that excessive adiposity might be one of the important causes for earlier pubertal development (3). Many cross-sectional studies of girls have demonstrated a link between more advanced breast development and higher BMI (4–13) or fat mass (8, 9, 11). Longitudinal analyses demonstrate that obesity precedes the earlier pubertal development in girls (14–19) and that obese girls achieve menarche earlier than their leaner counterparts (13, 20–27). In contrast to the unanimity of results among girls, the association between pubertal development and adiposity in boys has been less consistently reported, with studies finding a positive association (5, 28–30), lack of association (7, 31), and a negative association (4, 32) between obesity and testicular volume or onset of testicular enlargement.
Data from adults suggest a strong positive association between body weight and capacity to convert androstenedione to estrone (33–35). Adipose tissue expresses aromatase (36, 37) that catalyzes the conversion of low-potency androgens to higher-potency estrogens. Aromatase activity seems to be stimulated by macrophage-derived proinflammatory factors that are commonly increased in obesity (38). Androgen-to-estrogen conversion rates and estrogen concentrations are proportional to excess body weight among male and female adults (33, 35, 39). Thus, obesity might predispose children to produce estrogens without gonadal axis activation, leading to progression of estrogen-mediated physical growth. Consistent with this hypothesis, skeletal maturation, which seems closely linked to estrogen action (40, 41), has been found to be advanced in obese children as a group (20, 42–45) and when analyzed separately in boys (7, 28, 46–48) and girls (7, 47–49). Another sign of estrogen effect, gynecomastia in males, is also more prevalent among obese than among nonobese males (14, 50, 51), although it may be difficult to distinguish from lipomastia.
The associations between excess body weight and androgen concentrations are less clear. Whether weight is associated with the timing of adrenarche is controversial. Obese females demonstrate higher T (7, 52) and dehydroepiandrosterone-sulfate (DHEA-S) (7, 53, 54) than lean females; obese males also have higher DHEA-S (7, 28, 54) but lower T even at the same Tanner stage as their lean peers (7, 35, 55). Pubic hair, a manifestation of androgen exposure, shows unclear associations with weight. Several studies have found a lack of association between these parameters (7, 9), or even later onset of pubic hair in obese children (56), although some studies have reported earlier development of pubic hair in both obese girls and boys (10, 29, 30, 57, 58). Data from the National Health and Nutrition Examination Survey (NHANES) III showed a positive association in girls but no association in boys (13).
High adiposity typically leads to increased insulin resistance (IR), which may affect sex hormone concentrations. In females such a relationship is seen in polycystic ovary syndrome, where the degree of IR is positively correlated with androgen concentrations (59, 60). Furthermore, in vitro, insulin stimulates ovarian androgen production (61). In adult men, the IR seen in type 2 diabetes mellitus and obesity often is inversely associated with androgen concentrations (62–64), and T therapy may improve IR (65). Whether IR plays a role, independent of adiposity, in pubertal development is unknown.
To examine the relationships of adiposity, IR, and puberty, we analyzed a large cohort of children and adolescents oversampled for subjects with severe obesity to demonstrate the effects of high adiposity more convincingly. We hypothesized that obesity would be associated with alterations in secondary sexual characteristics and gonadal development consistent with elevated nongonadal estrogen production.
Materials and Methods
Participants
A convenience, cross-sectional sample of children (ages 5–17 years) was constructed from subjects studied between July 1996 and September 2010 (ClinicalTrials.gov IDs: NCT00001195, NCT00001522, NCT00001723, NCT00005669, NCT00320177, NCT00263536, NCT00680979, NCT00315172, and NCT00631644). Participants were recruited through notices mailed to children in local school districts, advertisements in local newspapers, and mailings to local family physicians and pediatricians requesting participation of children willing to undergo phlebotomy and imaging assessments for studies investigating hormones and metabolic functioning in children or for studies investigating the prevention or treatment of obesity. For this analysis, data exclusively from visits before initiation of any treatment were included. Participants in nontreatment studies were financially compensated for their time and inconvenience. All studies were approved by the Eunice Kennedy Shriver National Institute of Child Health and Human Development Institutional Review Board. Children provided written assent and parents or guardians gave written consent for study participation. Subjects were eligible if they were 5–17 years old at the time of study entry, generally healthy, and medication free for at least 2 weeks prior to baseline evaluation.
Physical measurements
Participants were seen at the Clinical Research Center at the National Institutes of Health (NIH). An endocrinologist or trained nurse practitioner performed a medical history and a physical examination on all subjects. Height (cm), measured three times, and weight (kg) were obtained using calibrated instruments. Breast development was assigned according to the five stages of Tanner (66) based on inspection that were corrected using the results of direct breast palpation (67), which is suggested as the technique to distinguish lipomastia from true gynecomastia in boys (68). Testicular volume (cc) was measured by using a set of orchidometer beads as standards according to Prader (69). In cases where the stage/size was discordant between the right and left breasts/testes, the higher stage/size was assigned. To facilitate analyses combining girls and boys, testicular volume was further classified into stages as follows: I (1–3 cc), II (>3–6 cc), III (>6–10 cc), IV (>10–15 cc), and V (>15–25 cc). Subjects were considered prepubertal if they were classified as stage I. Ratings of pubic hair also were made in both girls and boys according to the five stages of Tanner (66, 70), but breast/genital measures were used to determine entry into clinical puberty because these are held to be the most accurate single indicators of sexual maturity (71).
Measures of weight and adiposity
Height and weight were used to compute BMI (kg/m2) and BMI SD (BMI z) scores (72). Subjects were considered obese if BMI z was ≥1.65 (BMI ≥95th percentile for age and sex) (73). Total body fat mass (kg) and percentage fat mass (%) were assessed either with air-displacement plethysmography (Life Measurement Inc) after an overnight fast with participants wearing only underclothes or with whole-body dual energy x-ray absorptiometry (DXA) using the QDR200 pencil beam, QDR4500A, or Delphi fan beam densitometers (Hologic). When measurements from both techniques were available, results were averaged. Subjects were considered overfat if the total body fat or percentage body fat was ≥75th percentile for age based on DXA scan data from NHANES 1999–2004 (74). This cut point has been suggested to identify most children with BMI ≥95th percentile as overfat and relatively few children with normal BMI as overfat (75).
Radiologic measures
Skeletal age was determined by a left-hand roentgenogram and assessed by a radiologist according to the technique of Gruelich and Pyle (76). Skeletal age advancement was calculated as skeletal age minus chronological age. Transabdominal ultrasonography was performed on girls and read by a single radiologist to assess ovarian volume, calculated as 0.52 × length × width × depth. Average ovarian volume was calculated as the mean of the right and left ovary if both were visualized, but ovaries with cysts greater than 1 cm in any dimension were not included in the analysis. Ultrasonography was also used to identify uterine length. Ovarian volumes and uterine lengths were converted to z scores for age using previously published standards (77, 78).
Serum measures
Serum estradiol was measured by electrochemiluminescence immunoassay on a Roche Cobas analyzer (sensitivity, 5 pg/mL; interassay CV, 1.6–2.5%; intraassay CV, 3.5–5.7%). Chemiluminescent immunoassays on a Siemens Immulite 2500 analyzer were used to measure total T (sensitivity, 20ng/dL; interassay CV, 10.1–10.9%; intraassay CV, 5.1–10.1%) and DHEA-S (sensitivity, 0.03 ug/mL; interassay CV, 5.87–16.3%; intraassay CV, 4.15–8.82%). High-performance liquid chromatography /tandem mass spectrometry was used to determine estrone (sensitivity, 5 pg/mL; interassay CV, <6%; intraassay CV, <8%) (79) and androstenedione (sensitivity, 13 ng/mL; interassay CV, <8%; intraassay CV, <8%) (80). Fasting plasma glucose (analyzed with a colorimetric assay with glucose oxidase) and insulin (analyzed with a chemiluminescence immunoassay) were collected as previously described (81); participants had been instructed to adhere to at least an 8-h overnight fast prior to testing. Fasting samples were used to estimate IR by the homeostasis model assessment–insulin resistance index (HOMA-IRI), insulin (mU/mL) × glucose (mmol/L)/22.5.
Statistical analysis
All analyses were conducted using SPSS for Windows, 18.0.0 (SPSS, Inc.). The main study hypothesis was that the prevalence of stage II or greater pubertal development (defined by breast stage for girls and testicular volume for boys) would show different patterns for girls and boys based on participant's degree of obesity. A series of logistic regressions was therefore conducted to determine whether there was a significant interaction between sex and measures of weight (BMI z score) or adiposity (fat mass and percentage fat mass) for the prediction of pubertal status (stage I vs. stage II–V). Age and race were used as covariates to account for age-dependent pubertal progression and differences in pubertal timing in Blacks vs. Whites. When this primary hypothesis was confirmed, each sex was then analyzed separately using logistic regression and analyses of covariance (ANCOVAs), retaining age and race as covariates, in order to examine differences between obese and nonobese groups in pubertal development, skeletal maturation, pelvic ultrasound results, and hormone values. Continuous variables were analyzed for skew and kurtosis; estradiol and T were noted to have outliers, which were adjusted to fall 1.5 times the interquartile range below or above the 25th or 75th percentile (82). Percentage fat mass was transformed using the arcsin square root function. Total fat mass and ovarian volumes were log transformed. Height squared (m2) was used as a covariate in analyses that included fat mass to normalize for body size. BMI z, percentage fat mass, total fat mass, skeletal age, skeletal age advancement, testicular size, and all serum values were considered as continuous variables. Breast and pubic hair Tanner stage were evaluated as discrete variables and thus were always entered into models as an independent variable in relevant analyses; however, to obtain β-coefficients, these variables were classified as continuous. For each dependent variable, a family of four comparisons was performed; thus, P values less than .0125 were considered significant.
Results
A total of 1066 children, 59% female, were studied (Table 1). BMI z scores ranged widely, with approximately half the sample considered obese (55% of girls and 47% of boys), defined by a BMI ≥95th percentile for age (BMI z score ≥1.65), or overfat (58% of girls and 46% of boys), defined by total body fat mass or percentage fat mass ≥75th percentile for age. Distribution of pubertal stages within nonobese and obese girls and boys, as well as unadjusted means for skeletal age, skeletal age advancement, and sex hormone concentrations are presented in Table 1.
Table 1.
Characteristics of the Study Population
| Characteristic | Females (n = 627) |
Males (n = 439) |
||
|---|---|---|---|---|
| Non-Obese | Obese | Non-Obese | Obese | |
| n | 285 | 342 | 231 | 208 |
| Age (y)a | 11.7 ± 3.3 12.0 (5.0–17.97) |
12.4 ± 3.1 13.0 (6.0–17.7) |
11.2 ± 3.4 10.5 (5.9–17.99) |
11.7 ± 2.9 11.7 (5.5–17.8) |
| Raceb | ||||
| NH White (%) | 53 | 40 | 62 | 51 |
| NH Black (%) | 33 | 53 | 28 | 44 |
| Hispanic (%) | 7 | 5 | 3 | 2 |
| Weight (kg)a | 46.2 ± 18.0 45.6 (15.6–85.5) |
86.7 ± 30.5 84.2 (21.9–199.9) |
42.4 ± 17.7 35.3 (17.6–94.9) |
89.1 ± 38.9 83.1 (26.9–225.6) |
| Height (cm)a | 147.5 ± 17.3 150.8 (108.3–180.7) |
154.8 ± 13.8 158.0 (101.0–182.6) |
147.2 ± 20.6 143.3 (107.3–197.1) |
155.1 ± 16.6 156.2 (117.7–191.5) |
| BMI (kg/m2)a | 20.3 ± 4.2 19.6 (12.9–30.1) |
35.2 ± 8.6 33.9 (20.7–66.9) |
18.6 ± 2.8 18.0 (13.9–26.7) |
35.5 ± 11.0 33.4 (19.3–88.1) |
| BMI z Scorea | 0.5 ± 0.9 0.8 (−2.5–1.6) |
2.4 ± 0.3 2.4 (1.7–3.1) |
0.3 ± 0.7 0.4 (−2.0–1.6) |
2.5 ± 0.4 2.6 (1.7–3.4) |
| Total Fat Mass (kg)a,c | 13.7 ± 8.2 12.2 (1.7–36.7) |
41.5 ± 17.4 38.0 (11.1–109.8) |
7.6 ± 3.9 6.7 (1.2–26.5) |
42.3 ± 21.3 38.7 (6.8–110.4) |
| ≥75th Percentile (%) | 15.7 | 95.9 | 2.1 | 94 |
| Percentage Fat Mass (%)a,c | 27.2 ± 8.2 26.9 (8.3–46.7) |
44.9 ± 6.0 44.6 (26.8–65.3) |
17.8 ± 6.7 17.2 (4.2–35.8) |
43.6 ± 8.4 44.3 (16.4–64.5) |
| ≥75th Percentile (%) | 12.3 | 90.2 | 3.6 | 92 |
| Breast Tanner Stage (%)d | ||||
| 1 | 30 | 13 | 95 | 43 |
| 2 | 12 | 17 | 4 | 39 |
| 3 | 19 | 16 | 1 | 12 |
| 4 | 16 | 13 | 0 | 1 |
| 5 | 23 | 41 | 0 | 5 |
| Ovarian Volume (cc)a,e | 2.3 ± 3.1 1.3 (0.2–16.0) |
5.9 ± 4.1 5.7 (0.2–25.5) |
||
| Uterine Length (cm)a,f | 3.7 ± 1.6 3.3 (2.2–8.0) |
6.5 ± 1.7 7.0 (2.5–10.5) |
||
| Testes Stage (%)g | ||||
| 1 (1–3 cc) | 52 | 37 | ||
| 2 (>3–6 cc) | 11 | 22 | ||
| 3 (6–10 cc) | 5 | 15 | ||
| 4 (10–15 cc) | 7 | 10 | ||
| 5 (15–25 cc) | 25 | 16 | ||
| Pubic Hair Tanner Stage (%)h | ||||
| 1 | 34 | 18 | 54 | 40 |
| 2 | 12 | 12 | 8 | 21 |
| 3 | 12 | 13 | 9 | 12 |
| 4 | 19 | 16 | 12 | 11 |
| 5 | 23 | 41 | 17 | 16 |
| Skeletal Age (y)a,i | 10.2 ± 3.3 9.4 (5.0–18.0) |
13.2 ± 3.2 13.2 (4.0–19.0) |
10.4 ± 3.1 10.0 (6.0–19.0) |
13.0 ± 2.9 13.0 (6.0–19.0) |
| Skeletal Age Advancement (y)a,i | 0.2 ± 1.1 0.1 (−3.7–3.2) |
1.2 ± 1.2 1.1 (−1.9–4.7) |
0.5 ± 0.9 0.5 (−1.6–3.1) |
1.4 ± 1.2 1.3 (−1.8–5.0) |
| Estradiol (pg/mL)a,j | 37.8 ± 66.8 13.5 (3.5–493.0) |
54.6 ± 49.5 45.4 (3.4–305.0) |
15.0 ± 11.7 9.6 (3.5–53.4) |
24.3 ± 18.2 20.0 (2.9–83.6) |
| Estrone (pg/mL)a,k | 32.6 ± 27.3 23.4 (10.0–155.0) |
33.0 ± 26.1 25.1 (4.7–130.0) |
22.5 ± 18.9 17.0 (10.0–164.0) |
20.9 ± 15.3 17.0 (9.0–109.0) |
| T (ng/dL)a,l | 22.8 ± 13.6 20.0 (0.6–70.0) |
32.0 ± 24.5 26.0 (3.7–148.0) |
96.7 ± 180.2 16.0 (0.6–725.0) |
83.0 ± 115.1 20.0 (0.6–612.0) |
| Androstenedione (ng/dL)a,m | 68.9 ± 62.1 44.4 (6.5–404.0) |
73.8 ± 54.1 59.0 (10.0–308.0) |
47.1 ± 37.2 39.7 (10.0–220.0) |
40.9 ± 24.6 32.9 (10.0–120.0) |
| DHEA-S (mcg/dL)a,n | 73.7 ± 67.3 54.6 (5.0–365.0) |
111.0 ± 78.6 90.0 (6.0–488.0) |
81.1 ± 86.8 49.4 (4.0–632.0) |
127.3 ± 87.2 110.0 (13.0–533.0) |
| HOMA-IRIa,o | 1.8 ± 1.8 1.5 (0.2–23.4) |
4.9 ± 3.1 4.1 (0.3–25.7) |
1.2 ± 0.9 1.0 (0.3–5.2) |
4.7 ± 3.4 3.9 (0.4–18.9) |
NH, non-hispanic.
Mean ± sd, Median (range).
Available for 622 girls (282 non-obese) and 436 boys (229 non-obese).
Available for 559 girls (261 non-obese) including 172 with DXA, 134 with air-displacement plethysmography, and 253 with both; and available for 369 boys (193 non-obese) including 76 with DXA, 123 with air-displacement plethysmography, and 170 with both.
Available for 609 girls (273 non-obese) and 402 boys (212 non-obese).
Available for 190 girls (32 non-obese).
Available for 185 girls (31 non-obese).
Available for 417 boys (219 non-obese).
Available for 591 girls (266 non-obese) and 422 boys (222 non-obese).
Available for 413 girls (142 non-obese of average age 10 y and 271 obese of average age 12.1 y) and 323 boys (143 non-obese of average age 9.9 y and 180 obese of average age 11.6 y).
Available for 348 girls (137 non-obese) and 274 boys (134 non-obese).
Available for 202 girls (130 non-obese) and 188 boys (125 non-obese).
Available for 412 girls (149 non-obese) and 312 boys (131 non-obese).
Available for 222 girls (124 non-obese) and 189 boys (111 non-obese).
Available for 400 girls (132 non-obese) and 311 boys (132 non-obese).
Available for 601 girls (273 non-obese) and 422 boys (218 non-obese).
Logistic regression for entry into puberty in girls and boys
Using logistic regression to study factors associated with entry into puberty, and adjusting for age and race, there was a significant interaction between sex and BMI z (P < .001) and between sex and percentage fat mass (P ≤ .01) for the prediction of entry into clinical puberty. Given that these results suggested a different association between measures of adiposity and puberty in each sex, we conducted the remaining analyses separately for girls and boys.
In sex-specific logistic regression models that were adjusted for age and race, BMI z (P < .001, OR = 1.86), total fat mass adjusted for height squared (P = .025, OR = 4.47), and percentage fat mass (P < .001, OR = 110.98) were each positively associated with significantly greater odds of being pubertal (Tanner II–V) vs. prepubertal (Tanner I) in girls. This result suggests that among girls of the same age and race, there is almost 2-fold greater odds of having entered puberty for every one point increase in BMI z. However, no significant association was seen among boys.
Linear models examining measures of adiposity as predictors of gonadal size
Once puberty begins, gonad size increases with age throughout adolescence. We used generalized linear models, adjusting for age and race, to examine measures of weight (BMI z score, total fat mass adjusted for height squared, and percentage fat mass) for associations with gonadal volume. BMI z scores, total fat mass, and percentage fat mass were not significantly associated with ovarian volume, whether expressed as age-adjusted z-score or as raw ovarian volume (Table 2A). In contrast, BMI z scores, total fat mass, and percentage fat mass were negatively associated with testicular volume (P's < 0.01, Table 2B). The average testicular volume in the group of boys considered obese was 7.5 cc (95% confidence interval (CI), 6.9–8.1) compared with 9.2 cc (95% CI, 8.6–9.8) in those boys considered nonobese (P < .001). Testicular volume was plotted against skeletal age, and regressions were determined for obese and nonobese boys (Figure 1). Beyond a skeletal age of 13, obese boys demonstrated significantly smaller testicular size compared with the nonobese boys of the same skeletal age, suggesting more delayed puberty despite similar skeletal maturation.
Table 2.
Associations Between Measures of Adiposity and Markers of Central Puberty, Estrogen Concentration, Estrogenization, Androgen Concentration, and Pubarche
| BMI z Score | Total Fat Mass | Percentage Fat Mass | |
|---|---|---|---|
| A) Girls | |||
| Ovarian Volume | NS | NS | NS |
| Ovarian Volume z | NS | NS | NS |
| Breast Tanner Stage | β 0.41, P < .001 | β 0.06, P < .001 | β 0.03, P < .001 |
| Uterine Length | β 0.59, P < .001 | β 1.66, P = .001 | β 3.38, P = .002 |
| Uterine Length z | β 0.51, P < .001 | β 1.51, P < .001 | β 3.16, P = .001 |
| Skeletal Age | β 0.35, P < .001 | β 2.26, P < .001 | β 0.03, P < .001 |
| Skeletal Age Advancement | β 0.35, P < .001 | β 0.72, P < .001 | β 0.03, P < .001 |
| Estradiol | NS | NS | NS |
| Estrone | NS | NS | NS |
| Androstenedione | NS | NS | NS |
| DHEA-S | NS | NS | NS |
| T | NS | NS | NS |
| Pubic Hair Tanner Stage | β 0.29, P < .001 | NS | NS |
| B) Boys | |||
| Testicular Stage | β −0.44, P = .01 | β −4.39, P < .001 | β −0.11, P < .001 |
| Breast Tanner Stage | β 0.75, P < .001 | β 0.26, P < .001 | β 0.11, P < .001 |
| Skeletal Age | β 0.41, P < .001 | β 0.10, P < .001 | β 0.05, P < .001 |
| Skeletal Age Advancement | β 0.40, P < .001 | β 0.09, P < .001 | β 0.04, P < .001 |
| Estradiol | NS | β 6.67, P = .01 | NS |
| Estrone | NS | NS | NS |
| Androstenedione | NS | NS | NS |
| DHEA-S | NS | NS | NS |
| T | NS | β −0.002, P < .001 | β −0.002, P < .001 |
| Pubic Hair Tanner Stage | β −0.1, P = .01 | β −0.13, P < .001 | β −0.05, P < .001 |
NS, no statistically significant association.
All analyses adjusted for age and race; fat mass analysis also adjusted for height2.
Figure 1.
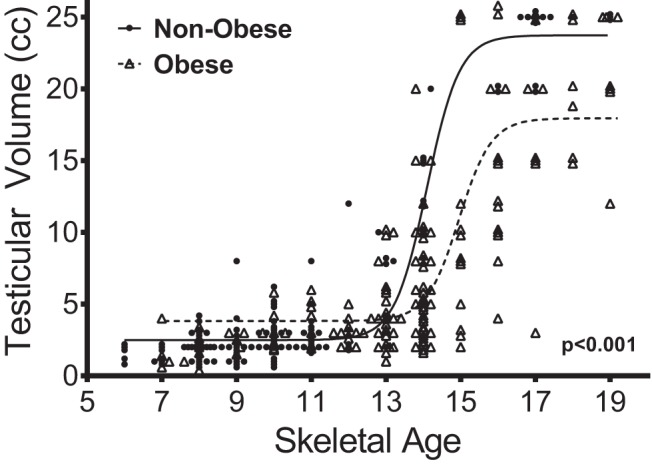
Relationship between testicular volume and skeletal age. Lines indicate sigmoidal curve fits. The P value indicates a statistically significant different relationship between skeletal age and testicular volume in obese boys vs. the relationship in nonobese boys after the age of 13 years.
Linear models examining IR as a predictor of gonadal size
We also evaluated the association of IR with gonadal size. IR was positively associated with ovarian volume, whether expressed as raw ovarian volume (β 0.02, P < .001) or age-adjusted z-score (β 0.27, P < .001). This relationship remained statistically significant even when data were adjusted for BMI z (β 0.02, P = .001 for ovarian volume and β 0.26, P = .001 for ovarian volume z-score) or percentage fat mass (β 0.03, P < .001 for ovarian volume and β 0.29, P < .001 for ovarian volume z-score). When adjusted for total fat mass, the relationship remained significant for raw ovarian volume (β 0.02, P = .01), but not for ovarian volume z-score. A higher degree of IR was associated with significantly less advanced testicular development (β −0.34, P < .001). The relationship between HOMA-IRI and testicular development remained significant when adjusted for BMI-z (β −0.08, P = .002) but not when adjusted for total or percentage fat mass.
ANCOVA models examining measures of adiposity as predictors of estrogen concentrations or markers of estrogenization
Estrogen exposure leads to skeletal maturation and breast development in both sexes, as well as uterine development in girls. Among girls, BMI z scores, total fat mass, and percentage fat mass were each found to have significant positive associations with breast development, uterine length (absolute or z score), skeletal age (Figure 2A), and skeletal age advancement, but did not show significant associations with estradiol or estrone concentrations (Table 2A). The mean values, adjusted for age and race, for uterine length, skeletal age, and skeletal age advancement, were higher in the group of girls considered obese compared with the girls considered nonobese (Table 3A). Similarly, body weight and adiposity in boys had significant positive associations with skeletal age (Figure 2B) and skeletal age advancement (Table 2B). In addition, body weight and adiposity were positively associated with boys' Tanner breast stage and the presence of gynecomastia (Table 2B). Total fat mass had a significant positive association with boys' serum estradiol concentrations (Table 2B); the relationships between BMI z scores or percentage fat mass and serum estradiol had nominal P values <.05 that did not remain statistically significant after adjustment for multiple comparisons. The mean values, adjusted for age and race, for skeletal age, and skeletal age advancement were higher in the group of boys considered obese compared with the boys considered nonobese (Table 3B).
Figure 2.
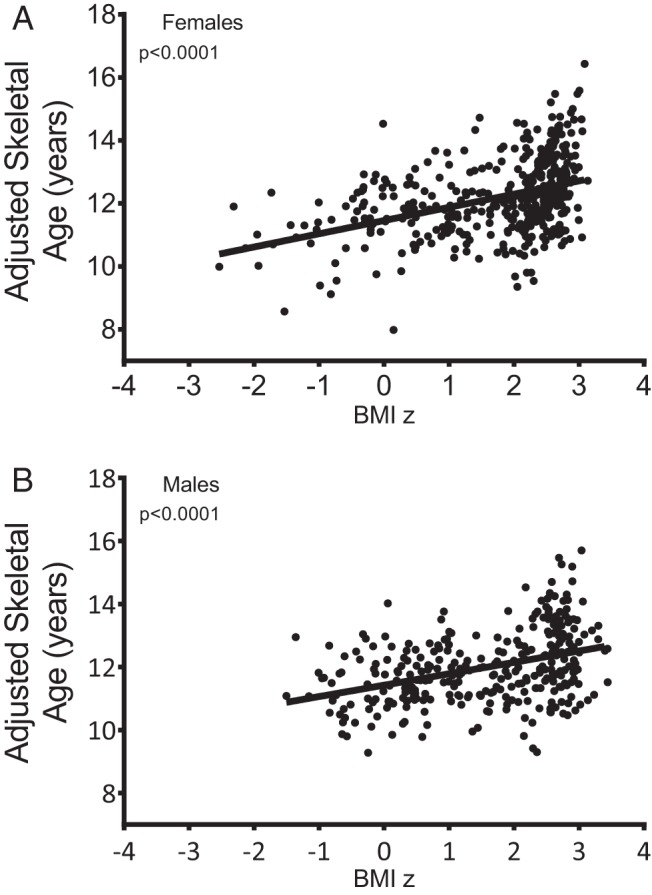
Relationship between BMI z score and skeletal age in girls A), and boys (B). Skeletal age was adjusted for age and race.
Table 3.
Adjusted Mean Values for Markers of Estrogenization Among Non-Obese and Obese Groups
| Non-Obese (BMI z < 1.66) | Obese (BMI z ≥ 1.66) | P Value | |
|---|---|---|---|
| A) Girls | |||
| Uterine Length (cm) | 5.3 (4.8–5.7) | 6.2 (6.0–6.3) | .001 |
| Skeletal Age (y) | 11.6 (11.4–11.8) | 12.5 (12.4–12.6) | <.001 |
| Skeletal Age Advancement (y) | 0.2 (0.0–0.4) | 1.2 (1.0–1.3) | <.001 |
| B) Boys | |||
| Skeletal Age (y) | 11.4 (11.2–11.6) | 12.3 (12.1–12.4) | <.001 |
| Skeletal Age Advancement (y) | 0.6 (0.4–0.8) | 1.4 (1.2–1.6) | <.001 |
All analyses adjusted for age and race.
Adjusted means (95% CI) shown.
ANCOVA models examining measures of adiposity as predictors of androgen concentrations or pubic hair development
Pubic hair development is mediated by androgen exposure. Among girls, higher BMI z scores were significantly associated with a more advanced pubic hair stage (Table 2A). Additionally several of the associations between fat mass and pubic hair, DHEA-S, or T had nominal P values <.05 that did not reach statistical significance after adjustment for multiple comparisons. Androstenedione was not significantly associated with any weight measurement in girls. In boys, higher BMI z scores, total fat mass, and percentage fat mass were negatively correlated with pubic hair stage (Table 2B). Fat mass was associated with lower T concentrations (Table 2B); again, several other associations among androgen concentrations and adiposity did not reach statistical significance when adjusted for multiple comparisons.
Models examining IR as a predictor of androgen concentrations or pubic hair development
Among girls, IR was positively correlated with T concentrations (β 0.04, P < .001), and remained so even after adjusting for BMI z score (β 1.76, P < .001), total fat mass (β 0.92, P = .009), or percentage fat mass (β 1.01, P = .002), suggesting a correlation between IR and T independent of weight. However, IR was not significantly correlated with pubic hair or other androgen concentrations. In boys, there were no significant relationships between IR and androgen concentrations. There was a negative relationship between HOMA-IRI and pubic hair Tanner stage (β −0.040, P = .01), but this remained significant only when adjusting for BMI z score (β −0.22, P = .003), but not for total or percentage fat mass.
Discussion
Our results confirm that there are sexual dimorphisms in the relationship of adiposity with markers of pubertal development. We found that there was a negative relationship between measures of adiposity and testicular volume in boys, but no such relationship between adiposity and ovarian volume in girls. In association with higher degrees of adiposity, both sexes manifested increased signs of estrogenization, including skeletal age advancement, breast Tanner stage advancement, and, in girls, increased uterine length. However, BMI z showed opposing associations with pubic hair development, in the positive direction for girls but negative direction for boys, who also displayed a negative association between fat mass and T concentrations. IR, independent of adiposity, was also found to have sexually dimorphic associations. In girls, higher degrees of IR were associated with increased ovarian volume and T concentrations, even independent of BMI z or fat mass. In boys, also independent of BMI z, there was a negative association between HOMA-IR and both testicular volume and pubic hair Tanner stage.
In girls, the lack of association between adiposity and ovarian volume observed in this study implies that adiposity per se may not lead to significant early activation of the central hypothalamic-pituitary-gonadal pulse generator. Such a hypothesis is consistent with one prior study of pelvic ultrasonography in girls (83) and is also supported by studies demonstrating lower luteinizing hormone secretion in early pubertal obese girls compared with their normal weight counterparts despite earlier breast maturation (52, 84). We suggest that the advanced breast development observed among early pubertal obese girls may be primarily due to peripheral conversion of relatively inactive androgens to more bioactive estrogens by aromatase in adipose tissues (85–88), while the central axis remains relatively inactive. This speculation is not supported by our lack of association between adiposity and estrogen concentrations, although this may be due to limitations of the biochemical assays. However, as many other studies have demonstrated, obese girls do experience somewhat earlier menarche; thus, central puberty eventually is initiated and obese girls progress more rapidly to the onset of menses.
Obesity leads to an earlier increase in leptin concentrations that may permit the onset of central puberty (89), possibly through increased kisspeptin synthesis (90). We propose an additional reason for earlier menses in obese girls: We speculate that, as with other forms of premenarchal hyperandrogenism in girls such as congenital adrenal hyperplasia, the hypothalamic pulse generating unit may eventually be stimulated or derepressed by the elevated androgens produced by obese females. This androgen production may be induced by IR, as suggested by the association between HOMA-IRI and T, even independent of BMI z or fat mass. Such a relationship has been seen in other studies when examining IR and adrenarche (91). In addition, our data show a relationship between IR and ovarian volume, and prior studies suggest the ability of insulin to stimulate ovarian androgen production (92–94) and increase ovarian volume (95). After androgens allow for the onset of central puberty, the insulin-stimulated ovaries and the peripheral estrogen-exposed uterus and breast tissue may respond more robustly, allowing for a more rapid pubertal progression and earlier menarche. In other studies, metformin has slowed the progression of thelarche and onset of menarche in girls with premature adrenarche, suggesting that early insulin resistance and androgen production may be responsible for earlier progression to central puberty (96). Furthermore, the independence of the relationship between insulin and androgen production from adiposity may also account for some of the phenotypic variation in pubarche observed among obese girls.
In boys, excess fat mass seems to delay the onset of central puberty as evidenced by the smaller testicular volumes in obese boys. This effect is similarly believed to be caused by elevations in circulating estrogens produced by adipose tissue aromatase (35) as evidenced by signs of estrogen-mediated changes such as gynecomastia and skeletal advancement. However, as with the girls, the lack of association between adiposity and estrogen concentrations in our data did not lend support to this hypothesis, nor can our data prove that the source of the estrogens was adipose tissue. Increased estrogenic compounds, which we found were not accompanied by an increase in boys' adrenal or gonadal androgens, may inhibit gonadotropin production. As IR was not independently associated with testicular volume when adjusted for adiposity, we speculate that IR may mediate this differential effect of obesity on androgen production observed between boys and girls.
The present study is limited by its cross-sectional nature, which can only establish correlation, not causation. We did not perform interobserver correlations for our assessments of pubertal staging, although our prior study found excellent interobserver correlations for breast and pubic hair staging (97). Our study was also limited by the low sensitivity of some of the hormone assays employed. In particular, estradiol, estrone, and T were not measured with high-sensitivity assays, which may explain why we did not find significant associations between adiposity and these hormone concentrations. We also lacked data on high-sensitivity luteinizing hormone and follicle-stimulating hormone concentrations, which might have provided useful insights into the timing of central pubertal activation. The presence of true breast tissue vs. lipomastia may have been overdiagnosed due to the difficulty distinguishing between these tissue types in obese subjects, even with palpation. Finally, given the retrospective nature of this analysis, we were limited by the data available at the time of collection. We did not have measurements available for hormone concentrations or radiologic data on all subjects, or data on menses onset among girls, limiting the power to detect some of these associations. Future studies could evaluate these questions in prospective, longitudinal analyses. Strengths of the study include its large sample size and the careful measurements of pubertal development and of body composition. This study also adds to the overall understanding of the physiology of obesity and puberty by synthesizing data regarding measures of weight, fat mass, and IR with markers of androgen and estrogen production, and by using gonadal size to distinguish central pubertal activation from peripheral production; all of these elements have not been examined in one study of this nature before.
In sum, there are significant sexual dimorphisms in the signs of pubertal development seen in obese girls and boys. We propose that these differences can largely be explained by humoral changes caused by obesity: increased estrogens via aromatase activity and increased insulin resistance.
Acknowledgments
This work was supported by Intramural Research Program, NIH, grant 1ZIAHD000641 (to J.A.Y.) from NICHD with supplemental funding from the National Institute for Minority Health and Health Disparities and the Division of Nutrition Research Coordination, NIH. N.M.S. was supported by the Division of Nutrition Research Coordination and the National Institute of Diabetes and Digestive and Kidney Diseases. Dr Yanovski is a Commissioned Officer in the U.S. Public Health Service, DHHS. The first draft of the manuscript was written by Drs Crocker and Yanovski.
This study was registered in ClinicalTrials.gov as trial numbers NCT00001195, NCT00001522, NCT00001723, NCT00005669, NCT00320177, NCT00263536, NCT00680979, NCT00315172, and NCT00631644.
Disclosure Summary: The authors have nothing to disclose.
Footnotes
- ANCOVA
- analysis of covariance
- BMI
- body mass index
- CI
- confidence interval
- DHEA-S
- dehydroepiandrosterone-sulfate
- DXA
- dual energy x-ray absorptiometry
- HOMA-IRI
- homeostasis model assessment–insulin resistance index
- IR
- insulin resistance.
References
- 1. Euling SY, Herman-Giddens ME, Lee PA, et al. Examination of US puberty-timing data from 1940 to 1994 for secular trends: panel findings. Pediatrics 121 Suppl. 2008;3:S172–191 [DOI] [PubMed] [Google Scholar]
- 2. Ogden CL, Carroll MD, Curtin LR, Lamb MM, Flegal KM. Prevalence of high body mass index in US children and adolescents, 2007–2008. JAMA. 2010;303:242–249 [DOI] [PubMed] [Google Scholar]
- 3. Kaplowitz P. Pubertal development in girls: secular trends. Curr Opin Obstet Gynecol. 2006;18:487–491 [DOI] [PubMed] [Google Scholar]
- 4. Wang Y. Is obesity associated with early sexual maturation? A comparison of the association in American boys versus girls. Pediatrics. 2002;110:903–910 [DOI] [PubMed] [Google Scholar]
- 5. Ribeiro J, Santos P, Duarte J, Mota J. Association between overweight and early sexual maturation in Portuguese boys and girls. Ann Hum Biol. 2006;33:55–63 [DOI] [PubMed] [Google Scholar]
- 6. Pirke KM, Wurmser H, Angst A, Laessle R, Trimborn SE. Early pubertal development and overweight in girls. Ann N Y Acad Sci. 1999;892:327–329 [DOI] [PubMed] [Google Scholar]
- 7. Denzer C, Weibel A, Muche R, Karges B, Sorgo W, Wabitsch M. Pubertal development in obese children and adolescents. Int J Obes (Lond). 2007;31:1509–1519 [DOI] [PubMed] [Google Scholar]
- 8. Morrison JA, Barton B, Biro FM, Sprecher DL, Falkner F, Obarzanek E. Sexual maturation and obesity in 9- and 10-year-old black and white girls: the National Heart, Lung, and Blood Institute Growth and Health Study. J Pediatr. 1994;124:889–895 [DOI] [PubMed] [Google Scholar]
- 9. Himes JH, Obarzanek E, Baranowski T, Wilson DM, Rochon J, McClanahan BS. Early sexual maturation, body composition, and obesity in African-American girls. Obes Res. 2004;12 Suppl:64S–72S [DOI] [PubMed] [Google Scholar]
- 10. Wolff OH. Obesity in childhood; a study of the birth weight, the height, and the onset of puberty. Q J Med. 1955;24:109–123 [PubMed] [Google Scholar]
- 11. Kaplowitz PB, Slora EJ, Wasserman RC, Pedlow SE, Herman-Giddens ME. Earlier onset of puberty in girls: relation to increased body mass index and race. Pediatrics. 2001;108:347–353 [DOI] [PubMed] [Google Scholar]
- 12. Juul A, Teilmann G, Scheike T, et al. Pubertal development in Danish children: comparison of recent European and US data. Int J Androl. 2006;29:247–255; discussion 286–290 [DOI] [PubMed] [Google Scholar]
- 13. Rosenfield RL, Lipton RB, Drum ML. Thelarche, pubarche, and menarche attainment in children with normal and elevated body mass index. Pediatrics. 2009;123:84–88 [DOI] [PubMed] [Google Scholar]
- 14. Voors AW, Harsha DW, Webber LS, Berenson GS. Obesity and external sexual maturation—the Bogalusa Heart Study. Prev Med. 1981;10:50–61 [DOI] [PubMed] [Google Scholar]
- 15. Davison KK, Susman EJ, Birch LL. Percent body fat at age 5 predicts earlier pubertal development among girls at age 9. Pediatrics. 2003;111:815–821 [DOI] [PMC free article] [PubMed] [Google Scholar]
- 16. Lee JM, Appugliese D, Kaciroti N, Corwyn RF, Bradley RH, Lumeng JC. Weight status in young girls and the onset of puberty. Pediatrics. 2007;119:e624–630 [DOI] [PubMed] [Google Scholar]
- 17. Wang Y, Dinse GE, Rogan WJ. Birth weight, early weight gain and pubertal maturation: a longitudinal study. Pediatric obesity. 2012;7:101–109 [DOI] [PMC free article] [PubMed] [Google Scholar]
- 18. Wronka I. Growth and development of overweight and obese girls. Pediatric endocrinology, diabetes, and metabolism. 2011;17:125–128 [PubMed] [Google Scholar]
- 19. Biro FM, Greenspan LC, Galvez MP, et al. 2013 Onset of Breast Development in a Longitudinal Cohort. Pediatrics [DOI] [PMC free article] [PubMed] [Google Scholar]
- 20. Garn SM, Haskell JA. Fat and growth during childhood. Science. 1959;130:1711–1712 [DOI] [PubMed] [Google Scholar]
- 21. de Ridder CM, Thijssen JH, Bruning PF, Van den Brande JL, Zonderland ML, Erich WB. Body fat mass, body fat distribution, and pubertal development: a longitudinal study of physical and hormonal sexual maturation of girls. J Clin Endocrinol Metab. 1992;75:442–446 [DOI] [PubMed] [Google Scholar]
- 22. St George IM, Williams S, Silva PA. Body size and the menarche: the Dunedin Study. J Adolesc Health. 1994;15:573–576 [DOI] [PubMed] [Google Scholar]
- 23. Freedman DS, Khan LK, Serdula MK, Dietz WH, Srinivasan SR, Berenson GS. Relation of age at menarche to race, time period, and anthropometric dimensions: the Bogalusa Heart Study. Pediatrics. 2002;110:e43. [DOI] [PubMed] [Google Scholar]
- 24. Anderson SE, Dallal GE, Must A. Relative weight and race influence average age at menarche: results from two nationally representative surveys of US girls studied 25 years apart. Pediatrics. 2003;111:844–850 [DOI] [PubMed] [Google Scholar]
- 25. Wattigney WA, Srinivasan SR, Chen W, Greenlund KJ, Berenson GS. Secular trend of earlier onset of menarche with increasing obesity in black and white girls: the Bogalusa Heart Study. Ethn Dis. 1999;9:181–189 [PubMed] [Google Scholar]
- 26. Jaruratanasirikul S, Mo-suwan L, Lebel L. Growth pattern and age at menarche of obese girls in a transitional society. J Pediatr Endocrinol Metab. 1997;10:487–490 [DOI] [PubMed] [Google Scholar]
- 27. Currie C, Ahluwalia N, Godeau E, Nic Gabhainn S, Due P, Currie DB. Is obesity at individual and national level associated with lower age at menarche? Evidence from 34 countries in the Health Behaviour in School-aged Children Study. J Adolesc Health. 2012;50:621–626 [DOI] [PubMed] [Google Scholar]
- 28. Fu JF, Dong GP, Liang L, Jiang YJ, Chen LQ, Dayan C. Early activation of the inhibin B/FSH axis in obese Tanner stage G1PH1 boys. Clin Endocrinol (Oxf). 2006;65:327–332 [DOI] [PubMed] [Google Scholar]
- 29. Herman-Giddens ME, Steffes J, Harris D, et al. 2012 Secondary Sexual Characteristics in Boys: Data From the Pediatric Research in Office Settings Network. Pediatrics [DOI] [PubMed] [Google Scholar]
- 30. Sørensen K, Aksglaede L, Petersen JH, Juul A. Recent changes in pubertal timing in healthy Danish boys: associations with body mass index. J Clin Endocrinol Metab. 2010;95:263–270 [DOI] [PubMed] [Google Scholar]
- 31. Herman-Giddens ME, Wang L, Koch G. Secondary sexual characteristics in boys: estimates from the national health and nutrition examination survey III, 1988–1994. Arch Pediatr Adolesc Med. 2001;155:1022–1028 [DOI] [PubMed] [Google Scholar]
- 32. Lee JM, Kaciroti N, Appugliese D, Corwyn RF, Bradley RH, Lumeng JC. Body mass index and timing of pubertal initiation in boys. Arch Pediatr Adolesc Med. 2010;164:139–144 [DOI] [PMC free article] [PubMed] [Google Scholar]
- 33. MacDonald PC, Edman CD, Hemsell DL, Porter JC, Siiteri PK. Effect of obesity on conversion of plasma androstenedione to estrone in postmenopausal women with and without endometrial cancer. Am J Obstet Gynecol. 1978;130:448–455 [DOI] [PubMed] [Google Scholar]
- 34. Grodin JM, Siiteri PK, MacDonald PC. Source of estrogen production in postmenopausal women. J Clin Endocrinol Metab. 1973;36:207–214 [DOI] [PubMed] [Google Scholar]
- 35. Kley HK, Deselaers T, Peerenboom H, Krüskemper HL. Enhanced conversion of androstenedione to estrogens in obese males. J Clin Endocrinol Metab. 1980;51:1128–1132 [DOI] [PubMed] [Google Scholar]
- 36. Cleland WH, Mendelson CR, Simpson ER. Aromatase activity of membrane fractions of human adipose tissue stromal cells and adipocytes. Endocrinology. 1983;113:2155–2160 [DOI] [PubMed] [Google Scholar]
- 37. Simpson ER, Mendelson CR. Effect of aging and obesity on aromatase activity of human adipose cells. Am J Clin Nutr. 1987;45:290–295 [DOI] [PubMed] [Google Scholar]
- 38. Subbaramaiah K, Howe LR, Bhardwaj P, et al. Obesity is associated with inflammation and elevated aromatase expression in the mouse mammary gland. Cancer Prev Res (Phila). 2011;4:329–346 [DOI] [PMC free article] [PubMed] [Google Scholar] [Retracted]
- 39. Schneider G, Kirschner MA, Berkowitz R, Ertel NH. Increased estrogen production in obese men. J Clin Endocrinol Metab. 1979;48:633–638 [DOI] [PubMed] [Google Scholar]
- 40. Cutler GB., Jr The role of estrogen in bone growth and maturation during childhood and adolescence. J Steroid Biochem Mol Biol. 1997;61:141–144 [PubMed] [Google Scholar]
- 41. Grumbach MM. Mutations in the synthesis and action of estrogen: the critical role in the male of estrogen on pubertal growth, skeletal maturation, and bone mass. Ann N Y Acad Sci. 2004;1038:7–13 [DOI] [PubMed] [Google Scholar]
- 42. De Simone M, Farello G, Palumbo M, et al. Growth charts, growth velocity and bone development in childhood obesity. Int J Obes Relat Metab Disord. 1995;19:851–857 [PubMed] [Google Scholar]
- 43. Sopher AB, Jean AM, Zwany SK, et al. Bone age advancement in prepubertal children with obesity and premature adrenarche: possible potentiating factors. Obesity (Silver Spring). 2011;19:1259–1264 [DOI] [PMC free article] [PubMed] [Google Scholar]
- 44. Klein KO, Larmore KA, de Lancey E, Brown JM, Considine RV, Hassink SG. Effect of obesity on estradiol level, and its relationship to leptin, bone maturation, and bone mineral density in children. J Clin Endocrinol Metab. 1998;83:3469–3475 [DOI] [PubMed] [Google Scholar]
- 45. Russell DL, Keil MF, Bonat SH, et al. The relation between skeletal maturation and adiposity in African American and Caucasian children. J Pediatr. 2001;139:844–848 [DOI] [PubMed] [Google Scholar]
- 46. Nathan BM, Sedlmeyer IL, Palmert MR. Impact of body mass index on growth in boys with delayed puberty. J Pediatr Endocrinol Metab. 2006;19:971–977 [DOI] [PubMed] [Google Scholar]
- 47. van Lenthe FJ, Kemper CG, van Mechelen W. Rapid maturation in adolescence results in greater obesity in adulthood: the Amsterdam Growth and Health Study. Am J Clin Nutr. 1996;64:18–24 [DOI] [PubMed] [Google Scholar]
- 48. Guo SS, Chumlea WC, Roche AF, Siervogel RM. Age- and maturity-related changes in body composition during adolescence into adulthood: the Fels Longitudinal Study. Int J Obes Relat Metab Disord. 1997;21:1167–1175 [DOI] [PubMed] [Google Scholar]
- 49. Beunen GP, Malina RM, Lefevre JA, Claessens AL, Renson R, Vanreusel B. Adiposity and biological maturity in girls 6–16 years of age. Int J Obes Relat Metab Disord. 1994;18:542–546 [PubMed] [Google Scholar]
- 50. Georgiadis E, Papandreou L, Evangelopoulou C, et al. Incidence of gynaecomastia in 954 young males and its relationship to somatometric parameters. Ann Hum Biol. 1994;21:579–587 [DOI] [PubMed] [Google Scholar]
- 51. Niewoehner CB, Nuttal FQ. Gynecomastia in a hospitalized male population. Am J Med. 1984;77:633–638 [DOI] [PubMed] [Google Scholar]
- 52. McCartney CR, Blank SK, Prendergast KA, et al. Obesity and sex steroid changes across puberty: evidence for marked hyperandrogenemia in pre- and early pubertal obese girls. J Clin Endocrinol Metab. 2007;92:430–436 [DOI] [PMC free article] [PubMed] [Google Scholar]
- 53. Charkaluk ML, Trivin C, Brauner R. Premature pubarche as an indicator of how body weight influences the onset of adrenarche. Eur J Pediatr. 2004;163:89–93 [DOI] [PubMed] [Google Scholar]
- 54. Corvalán C, Uauy R, Mericq V. Obesity is positively associated with dehydroepiandrosterone sulfate concentrations at 7 y in Chilean children of normal birth weight. Am J Clin Nutr. 2013;97:318–325 [DOI] [PMC free article] [PubMed] [Google Scholar]
- 55. Moriarty-Kelsey M, Harwood JE, Travers SH, Zeitler PS, Nadeau KJ. Testosterone, obesity and insulin resistance in young males: evidence for an association between gonadal dysfunction and insulin resistance during puberty. J Pediatr Endocrinol Metab. 2010;23:1281–1287 [DOI] [PMC free article] [PubMed] [Google Scholar]
- 56. Kleber M, Schwarz A, Reinehr T. Obesity in children and adolescents: relationship to growth, pubarche, menarche, and voice break. J Pediatr Endocrinol Metab. 2011;24:125–130 [DOI] [PubMed] [Google Scholar]
- 57. de Ferran K, Paiva IA, Garcia Ldos S, Gama Mde P, Guimarães MM. Isolated premature pubarche: report of anthropometric and metabolic profile of a Brazilian cohort of girls. Horm Res Paediatr. 2011;75:367–373 [DOI] [PubMed] [Google Scholar]
- 58. Neville KA, Walker JL. Precocious pubarche is associated with SGA, prematurity, weight gain, and obesity. Arch Dis Child. 2005;90:258–261 [DOI] [PMC free article] [PubMed] [Google Scholar]
- 59. Yildiz BO, Gedik O. Insulin resistance in polycystic ovary syndrome: hyperandrogenemia versus normoandrogenemia. Eur J Obstet Gynecol Reprod Biol. 2001;100:62–66 [DOI] [PubMed] [Google Scholar]
- 60. Chang RJ, Nakamura RM, Judd HL, Kaplan SA. Insulin resistance in nonobese patients with polycystic ovarian disease. J Clin Endocrinol Metab. 1983;57:356–359 [DOI] [PubMed] [Google Scholar]
- 61. Barbieri RL, Makris A, Randall RW, Daniels G, Kistner RW, Ryan KJ. Insulin stimulates androgen accumulation in incubations of ovarian stroma obtained from women with hyperandrogenism. J Clin Endocrinol Metab. 1986;62:904–910 [DOI] [PubMed] [Google Scholar]
- 62. Biswas M, Hampton D, Turkes A, Newcombe RG, Aled Rees D. Reduced total testosterone concentrations in young healthy South Asian men are partly explained by increased insulin resistance but not by altered adiposity. Clin Endocrinol (Oxf). 2010;73:457–462 [DOI] [PubMed] [Google Scholar]
- 63. Li C, Ford ES, Li B, Giles WH, Liu S. Association of testosterone and sex hormone-binding globulin with metabolic syndrome and insulin resistance in men. Diabetes Care. 2010;33:1618–1624 [DOI] [PMC free article] [PubMed] [Google Scholar]
- 64. Osuna JA, Gómez-Pérez R, Arata-Bellabarba G, Villaroel V. Relationship between BMI, total testosterone, sex hormone-binding-globulin, leptin, insulin and insulin resistance in obese men. Arch Androl. 2006;52:355–361 [DOI] [PubMed] [Google Scholar]
- 65. Cornoldi A, Caminiti G, Marazzi G, et al. Effects of chronic testosterone administration on myocardial ischemia, lipid metabolism and insulin resistance in elderly male diabetic patients with coronary artery disease. Int J Cardiol. 2010;142:50–55 [DOI] [PubMed] [Google Scholar]
- 66. Marshall WA, Tanner JM. Variations in pattern of pubertal changes in girls. Arch Dis Child. 1969;44:291–303 [DOI] [PMC free article] [PubMed] [Google Scholar]
- 67. Kaplowitz PB, Oberfield SE. Reexamination of the age limit for defining when puberty is precocious in girls in the United States: implications for evaluation and treatment. Drug and Therapeutics and Executive Committees of the Lawson Wilkins Pediatric Endocrine Society. Pediatrics. 1999;104:936–941 [DOI] [PubMed] [Google Scholar]
- 68. Nuttall FQ. Gynecomastia as a physical finding in normal men. J Clin Endocrinol Metab. 1979;48:338–340 [DOI] [PubMed] [Google Scholar]
- 69. Zachmann M, Prader A, Kind HP, Häfliger H, Budliger H. Testicular volume during adolescence. Cross-sectional and longitudinal studies. Helv Paediatr Acta. 1974;29:61–72 [PubMed] [Google Scholar]
- 70. Marshall WA, Tanner JM. Variations in the pattern of pubertal changes in boys. Arch Dis Child. 1970;45:13–23 [DOI] [PMC free article] [PubMed] [Google Scholar]
- 71. Mueller WH, Cho SD, Meininger JC, Liehr P, Chan W. Strategies for combining and scaling sexual maturity indicators: the Heartfelt Study. Ann Hum Biol. 2001;28:422–430 [DOI] [PubMed] [Google Scholar]
- 72. Kuczmarski RJ, Ogden CL, Guo SS, et al. 2000 CDC Growth Charts for the United States: methods and development. Vital Health Stat. 2002;11:1–190 [PubMed] [Google Scholar]
- 73. Barlow SE. Expert committee recommendations regarding the prevention, assessment, and treatment of child and adolescent overweight and obesity: summary report. Pediatrics 120 Suppl. 2007;4:S164–S192 [DOI] [PubMed] [Google Scholar]
- 74. Ogden CL, Li Y, Freedman DS, Borrud LG, Flegal KM. 2011 Smoothed percentage body fat percentiles for U.S. children and adolescents, 1999–2004. Natl Health Stat Report:1–7 [PubMed] [Google Scholar]
- 75. Flegal KM, Ogden CL, Yanovski JA, et al. High adiposity and high body mass index-for-age in US children and adolescents overall and by race-ethnic group. Am J Clin Nutr. 2010;91:1020–1026 [DOI] [PMC free article] [PubMed] [Google Scholar]
- 76. Gruelich WW, Pyle S. 1959 Radiographic atlas of skeletal development of the hand and wrist. Stanford, CA: Stanford University Press; 1–256 [Google Scholar]
- 77. Buzi F, Pilotta A, Dordoni D, Lombardi A, Zaglio S, Adlard P. Pelvic ultrasonography in normal girls and in girls with pubertal precocity. Acta Paediatr. 1998;87:1138–1145 [DOI] [PubMed] [Google Scholar]
- 78. Haber HP, Mayer EI. Ultrasound evaluation of uterine and ovarian size from birth to puberty. Pediatr Radiol. 1994;24:11–13 [DOI] [PubMed] [Google Scholar]
- 79. Anari MR, Bakhtiar R, Zhu B, Huskey S, Franklin RB, Evans DC. Derivatization of ethinylestradiol with dansyl chloride to enhance electrospray ionization: application in trace analysis of ethinylestradiol in rhesus monkey plasma. Anal Chem. 2002;74:4136–4144 [DOI] [PubMed] [Google Scholar]
- 80. Taylor RL, Machacek D, Singh RJ. Validation of a high-throughput liquid chromatography-tandem mass spectrometry method for urinary cortisol and cortisone. Clin Chem. 2002;48:1511–1519 [PubMed] [Google Scholar]
- 81. Shomaker LB, Tanofsky-Kraff M, Stern EA, et al. Longitudinal study of depressive symptoms and progression of insulin resistance in youth at risk for adult obesity. Diabetes Care. 2011;34:2458–2463 [DOI] [PMC free article] [PubMed] [Google Scholar]
- 82. Behrens JT. Principles and procedures of exploratory data analysis. Psychol Methods. 1997;2:131–160 [Google Scholar]
- 83. Salardi S, Orsini LF, Cacciari E, et al. Pelvic ultrasonography in girls with precocious puberty, congenital adrenal hyperplasia, obesity, or hirsutism. J Pediatr. 1988;112:880–887 [DOI] [PubMed] [Google Scholar]
- 84. McCartney CR, Prendergast KA, Blank SK, Helm KD, Chhabra S, Marshall JC. Maturation of luteinizing hormone (gonadotropin-releasing hormone) secretion across puberty: evidence for altered regulation in obese peripubertal girls. J Clin Endocrinol Metab. 2009;94:56–66 [DOI] [PMC free article] [PubMed] [Google Scholar]
- 85. Longcope C, Baker R, Johnston CC., Jr Androgen and estrogen metabolism: relationship to obesity. Metabolism. 1986;35:235–237 [DOI] [PubMed] [Google Scholar]
- 86. de Ridder CM, Bruning PF, Zonderland ML, et al. Body fat mass, body fat distribution, and plasma hormones in early puberty in females. J Clin Endocrinol Metab. 1990;70:888–893 [DOI] [PubMed] [Google Scholar]
- 87. Schindler AE, Ebert A, Friedrich E. Conversion of androstenedione to estrone by human tissue. J Clin Endocrinol Metab. 1972;35:627–630 [DOI] [PubMed] [Google Scholar]
- 88. Longcope C, Pratt JH, Schneider SH, Fineberg SE. Aromatization of androgens by muscle and adipose tissue in vivo. J Clin Endocrinol Metab. 1978;46:146–152 [DOI] [PubMed] [Google Scholar]
- 89. Ahmed ML, Ong KK, Dunger DB. Childhood obesity and the timing of puberty. Trends Endocrinol Metab. 2009;20:237–242 [DOI] [PubMed] [Google Scholar]
- 90. Pita J, Barrios V, Gavela-Pérez T, et al. Circulating kisspeptin levels exhibit sexual dimorphism in adults, are increased in obese prepubertal girls and do not suffer modifications in girls with idiopathic central precocious puberty. Peptides. 2011;32:1781–1786 [DOI] [PubMed] [Google Scholar]
- 91. Ibáñez L, Potau N, Carrascosa A. Insulin resistance, premature adrenarche, and a risk of the Polycystic Ovary Syndrome (PCOS). Trends Endocrinol Metab. 1998;9:72–77 [DOI] [PubMed] [Google Scholar]
- 92. Dunaif A. Insulin resistance and the polycystic ovary syndrome: mechanism and implications for pathogenesis. Endocr Rev. 1997;18:774–800 [DOI] [PubMed] [Google Scholar]
- 93. Barbieri RL, Makris A, Ryan KJ. Insulin stimulates androgen accumulation in incubations of human ovarian stroma and theca. Obstet Gynecol. 1984;64:73S–80S [DOI] [PubMed] [Google Scholar]
- 94. Nestler JE, Jakubowicz DJ, de Vargas AF, Brik C, Quintero N, Medina F. Insulin stimulates testosterone biosynthesis by human thecal cells from women with polycystic ovary syndrome by activating its own receptor and using inositolglycan mediators as the signal transduction system. J Clin Endocrinol Metab. 1998;83:2001–2005 [DOI] [PubMed] [Google Scholar]
- 95. Musso C, Shawker T, Cochran E, Javor ED, Young J, Gorden P. Clinical evidence that hyperinsulinaemia independent of gonadotropins stimulates ovarian growth. Clin Endocrinol. 2005;63:73–78 [DOI] [PubMed] [Google Scholar]
- 96. Ibáñez L, Ong K, Valls C, Marcos MV, Dunger DB, de Zegher F. Metformin treatment to prevent early puberty in girls with precocious pubarche. J Clin Endocrinol Metab. 2006;91:2888–2891 [DOI] [PubMed] [Google Scholar]
- 97. Bonat S, Pathomvanich A, Keil MF, Field AE, Yanovski JA. Self-assessment of pubertal stage in overweight children. Pediatrics. 2002;110:743–747 [DOI] [PubMed] [Google Scholar]