Abstract
The detection of radioactive compounds by liquid scintillation has revolutionized modern biology, yet few investigators make full use of the power of this technique. Even though multiple isotope counting is considerably more difficult than single isotope counting, many experimental designs would benefit from using more than one isotope. The development of accurate isotope counting techniques enabling the simultaneous use of three β-emitting tracers has facilitated studies in our laboratory using the multiple tracer indicator dilution technique for assessing rates of transmembrane transport and cellular metabolism. The details of sample preparation, and of stabilizing the liquid scintillation spectra of the tracers, are critical to obtaining good accuracy. Reproducibility is enhanced by obtaining detailed efficiency/quench curves for each particular set of tracers and solvent media. The numerical methods for multiple-isotope quantitation depend on avoiding error propagation (inherent to successive subtraction techniques) by using matrix inversion. Experimental data obtained from triple-label β counting illustrate reproducibility and good accuracy even when the relative amounts of different tracers in samples of protein/electrolyte solutions, plasma, and blood are changed.
The simultaneous use of multiple β labels in tracer experiments can increase the information obtained for analysis. A second or even a third tracer allows the kinetics of transport, binding, or metabolism of multiple compounds to be observed simultaneously. However, liquid scintillation (LS)1 counting of even a single β-emitting radiotracer is subject to errors from emission statistics, variation in counting efficiency, and effects of quench. Systematic and random errors are compounded by having more than one tracer. Errors and artifacts in the final result are influenced by the choices of scintillation cocktail, the type of vial, the method of sample preparation, and the liquid scintillation counter itself. Despite the increased sources of error, triple-label β counting has the virtue of obviating the use of various chemical and physical separation techniques (such as precipitation, centrifugation, combustion, and trapping of products) that require multiple steps in handling each sample. Although simultaneous counting of three β-emitting radionuclides has been used in demonstration (1) and under experimental conditions (2), a systematic description of methods of sample preparation and sources of error has not been presented.
It is the purpose of this paper to present accurate, practical techniques for determination of the individual activities for each of three β-labeled tracers present in the same sample. Quenching, a diminution in the efficiency of counting disintegrations, may be due to optical absorbance (color quench) or to inhibition of fluorescence of the fluor in the scintillation fluid (chemical quench). These quenching mechanisms have similar effects on the spectra; both shift the spectra to lower energy levels and broaden the peaks. Standard LS counting systems use a variety of indices to estimate the degree of quench in a sample; in the LS5801, H number (a Beckman Co. trademark) provides the measure of quench.
Triple label counting of low- and high-quench samples is routinely performed in this laboratory to determine the concentrations of β tracers in the outflow from isolated, retrograde-perfused hearts in protein/electrolyte perfusates and in blood. Commonly used tracers are 3H- and 14C-labeled diffusible markers and 131I-labeled bovine serum albumin. These tracers have energy spectra sufficiently separated to allow clear distinction among their contributions to the mixed isotonic spectra. 125I is less well distinguished from 3H and 14C because its bimodal energy spectrum strongly overlaps those of both 3H and 14C. Additional problems in accurate counting are caused by the nature of indicator dilution experiments, where the concentrations of the tracers change 10,000-fold during the time period of the experiment; the ratios of their concentrations may also change by as much as 100-fold. The methods presented permit analysis of several hundred samples with reasonable ease and with good reproducibility. Preparation procedures are described for tracers in samples of physiological perfusion media, as well as plasma, whole blood, and tissue.
METHODS
General
Studies were performed using a Beckman LS5801 liquid scintillation counter and commercially available cocktails, vials, and radionuclides. Quench (H number) was determined from the inflection point on the upper edge of the Compton spectra (3). Isotopes used were L-[3H]glucose, [14C]adenosine, 125I- and 131I-albumin, and [125I]- and [131I]iododesmethylimipramine (IDMI). Count rate and quench data were collected from the counter using a Zenith AT-compatible computer running Smartterm 400 (Persoft, Inc., Madison, WI).
Standard disintegrations per minute (dpm) for 3H and 14C quench curve calibrations are obtained from the technical data sheet from the manufacturer. The standard dpm for 131I quench curve calibrations was obtained on a CRC 7 ionization chamber radioisotope calibrator (Capintel, Inc.).
Sample Preparation
Saline perfusates from organ perfusion studies
This is the least complicated technique, as it does not require digestion or decolorization. Depending on the combination of tracers to be counted, one of two counting systems was selected. For samples containing tracers giving rise to spectra that remain stable over many hours to days, the method of choice is a liquid phase counting system consisting of a 100-μl sample aliquot in 4.2 ml scintillation cocktail (RediSolv MP). Such samples have low quench with H numbers of 80 to 90. We used mainly one scintillant, RediSolv MP, which remains in liquid phase when the proportion of water or physiological saline is less than 10%, but forms a gel at water contents above 20%. The same product is now marketed under the name “Redigel” (Beckman) and behaves exactly the same as the older RediSolv MP.
If any of the three tracers exhibits spectral changes with time, a gel phase counting system is preferable since it gives better stability. Increasing the water content in the scintillation mixture leads to gel formation. To promote homogeneity of the samples so that they will exhibit a narrow quench range of about 10 H numbers, small amounts of the color quenching agent picric acid were added. The scintillation mixture consisted of 100 μl sample, 3.6 ml RediSolv MP, plus 2.3 ml of a 1:8000 dilution of saturated picric acid. The sample was vigorously shaken to homogeneity, yielding an amber-colored clear gel; for this we used a commercial paint shaker. Care was taken that no density gradients (Schlieren lines) remained observable in the gel matrix, ensuring complete sample dispersion within the vial. The process resulted in samples being moderately quenched with H numbers of 160 to 180. The external surfaces of the vials were cleaned with acetone and a static-free cloth prior to counting in order to remove any light scattering or absorption due to fingerprints or dirt.
Blood samples
Heparinized blood was stirred or shaken thoroughly before 100-μl samples were smoothly discharged onto the bottom of a slightly tilted liquid scintillation minivial without touching the sides of the vial. A 100-μl aliquot of 60% HClO4 was added and the mixture swirled until homogeneous. While the sample was gently swirled, 200 μl of 30% H2O2 was added, slowly, to avoid excessive foaming. About 1 min later, the time not being critical, 40 μl of 15% ascorbic acid in water was added to the mixture to reduce chemiluminescence. The vials were tightly capped and incubated for 45–60 min at 70°C to promote decolorizing by the perchlorate/hydrogen peroxide mixture, yielding a light straw-colored product. For a liquid phase counting system, we added 3.5 ml scintillation cocktail (RediSolv MP) to the decolorized sample. This resulted in highly quenched samples with H numbers around 200. The samples exhibited moderate chemiluminescence, which decreased with time. Chemiluminescence was accurately detected on the LS5801 through use of the random coincidence monitor algorithm (4,5). There was little chemiluminescence after 72 h, but the background tended to remain at twice the normal background, or about 40 counts per minute (cpm).
Plasma samples
The same method as that used for blood samples was used to prepare plasma samples. The decolorization is less critical for plasma samples, but was useful in reducing the heterogeneity of the samples. The quenching of plasma samples was slightly less than that for blood samples.
Tissue samples
Tissue samples between 0.1 and 0.2 g were placed in Wheaton glass minivials. After successive additions of 250 μl of 60% perchloric acid, 200 μl of 30% hydrogen peroxide, and 40 μl of 15% ascorbic acid, the vials were tightly capped and 2 to 4 h at 80 to 90°C was allowed for tissue digestion. After the first 10 min, the caps were retightened, if necessary. After cooling to room temperature, 0.7 ml of deionized water was added, giving a cumulative sample volume of 1.2 ml. Finally, 4.8 ml RediSolv MP was added and the vials were capped and shaken vigorously. This gave a clear gel with high quench (H numbers of 200 to 250). Chemiluminescence was much less of a problem with tissue samples than with blood.
Count Acquisition
The fluors in liquid scintillation cocktails have a residual fluorescent activity that is activated by sunlight or fluorescent lighting and can be about twice background counts; it decays to background after 5 to 10 min in the dark. Vials were set in the LS counter, protected from room light, for at least 20 min to allow the decay of luminescence, and the radioactivity was measured. Two methods were used: either the cpm was recorded in each of three spectral ranges (windows) or the whole spectrum of 1024 channels was recorded. For samples containing three tracers, in order to maximize count rates we set the upper limit of the window for the highest energy isotope to just above its highest energy channel. The upper edges for the lower energy isotopes were such that 1% of the area of its spectrum was above this cutoff and was counted in the higher energy window.
The lower edge of window 1, the window for the lowest energy tracer, was set at channel 1 or somewhat higher to avoid the spurious counts due to electronic noise in channel 0. The lower edges of windows 2 and 3 were set at the upper limits for windows 1 and 2. Window positions may be calculated from the spectra using an optimizing routine that takes into account the relative amounts of each tracer and the form of their spectra, the objective being to minimize the error in estimated tracer concentrations and the susceptibility to detector drift. In general, if the windows are set so there is little spillup (by which we mean counts due to a lower energy isotope appearing in a window covering a higher energy range, not including the peak for this isotope) and the edges are not set on a steep portion of the spectrum, then the separation error is close to minimal.
Quench Curves
Quench phenomena can be divided into two groups: chemical or color quench. Chemical quench occurs prior to the production of light and through physical processes that reduce the efficiency of the energy transfer between scintillation components. Color quench is due to absorption of light photons after emission and occurs in the presence of substances with absorption spectra that overlap the emission spectrum of the fluor. Representative scintillation spectra for 131I, 14C, and 3H at low and high quench are illustrated in Fig. 1. 131I is the highest energy emitter with a β emission of 0.6 MeV and an abundance of 90%, and it stands out at the high-energy end of the spectra by itself; the spectrum spreads with a smooth tail down to the lowest energies. The 14C spectrum is essentially similar in shape, but positioned at about three-quarters of the energy of 131I, although its fundamental β-emission energy is 0.156 MeV. The 3H energy peak, with its β emission of 0.0186 MeV, is at about one-half that of 14C. With high quenching the spectra are squeezed to lower energy levels and the lower energy components are reduced more than are high-energy components so that the tailing toward lower energies is reduced. In particular, 3H counting efficiency is reduced.
FIG. 1.
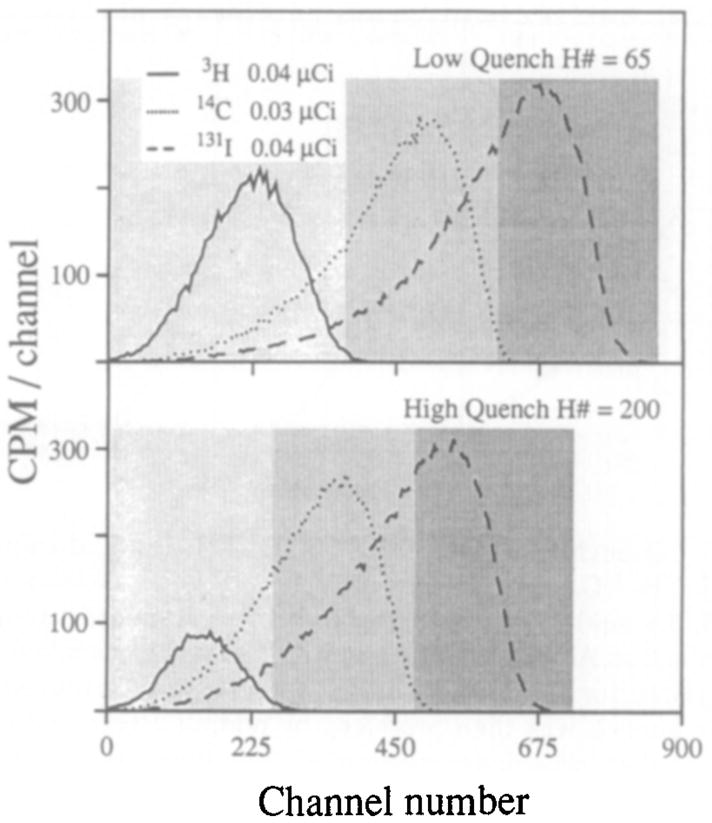
Liquid scintillation spectra at low and high quench. Samples were 50 ml in 4.2 ml scintillation fluid. For high quench 60 ml carbon tetrachloride was used. With low quench the windows were window 1 (5–370), window 2 (370–610), and window 3 (610–860). With high quench the windows were window 1 (5–260), window 2 (260–480), and window 3 (480–730). Spectra were acquired for 10 min.
Quench curves are the curves of counting efficiency versus H number. The efficiency is the observed cpm minus the background count rate and divided by the dpm. The curves differ from system to system and even from day to day and were therefore determined regularly. To obtain accurate estimates of the true tracer activity of individual isotopes in a sample one needs precise determination of the relationship between counting efficiency and quench for the given set of isotopes, window settings, quenching agent and machine settings (automatic quench correction on or off, etc.), and type of sample fluid. Calibrated samples were prepared meticulously and counted with every set of experimental samples.
Quench curves consisted of 20 background and 20 samples for each isotope, each at a different level of quench. First, the desired volume (3.5 or 4.8 ml) of scintillator fluid was placed in 100 vials and counted for 10 min each; any odd vials (high background or quench) were discarded. Second, a fixed aliquot of known activity, dpm, of an isotope was added to each of 20 vials. The activity level of each of the 20 vials was measured and any vial with activity more than 1% different from the mean of the other vials was discarded. Any other arbitrary limit for precision could be chosen. These vials were counted to one million counts, making the counting error about 0.1%. Third, various amounts of the quenching agent (buffer, solubilized tissue, CCl4, etc.) were added; the largest amounts were chosen to exceed the range of quenching encountered in the experiment. To keep constant, and minimal, the additional quenching secondary to dilution of the fluor, we used minimal volumes of the quenching agent and by using a wide range of dilutions of the quenching agent were able to keep the volume addition to the vials nearly constant over the full range of quench.
The vials were counted and the apparent activity, cpm, in each window was divided by the known calibrated activity, dpm, in each vial. The efficiency is the observed activity corrected for background, divided by the known activity, cpm/dpm. Efficiency is plotted as a function of quench or H number. A smooth curve was fitted through the data and was designated the “quench curve.” We make a point of plotting the quench curve and the data together in order to be sure that the fitted curve does not deviate systematically from the data, as polynomials or splines may commonly do at the ends of the data set. The fitted curves and data covering a wide quench range for a single-phase liquid counting system and three isotopes are illustrated in Fig. 2. The curves were fitted with a third-order exponential, exp(a0 + a1, H + a2H2 + a3H3), where H is the H number and the a’s are constants. The sum of the squares of the orthogonal distances between each data point and the curve described by the model equation were minimized using a maximum likelihood routine (6).
FIG. 2.
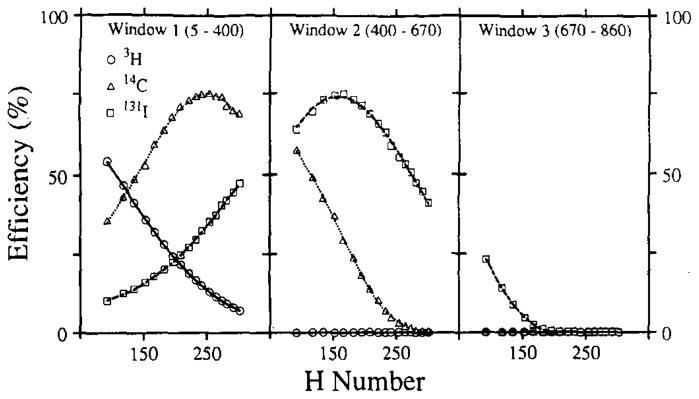
Quench curves for 3H, 14C, and 131I in liquid scintillation fluid. The 3H, 14C, and 131I series consisted of 100-μl aliquots, containing 0.05, 0.1, and 0.06 mCi of the respective standard isotope solutions, in 4.2 ml Aquasol scintillation fluid. The unquenched “pures” were counted for 10 min per sample, prior to any further additions. Variable quench was then produced by adding 5 to 85 ml CCl4, recapped, shaken, wiped, and recounted. The lines are the best third-order polynomials fitted to the data.
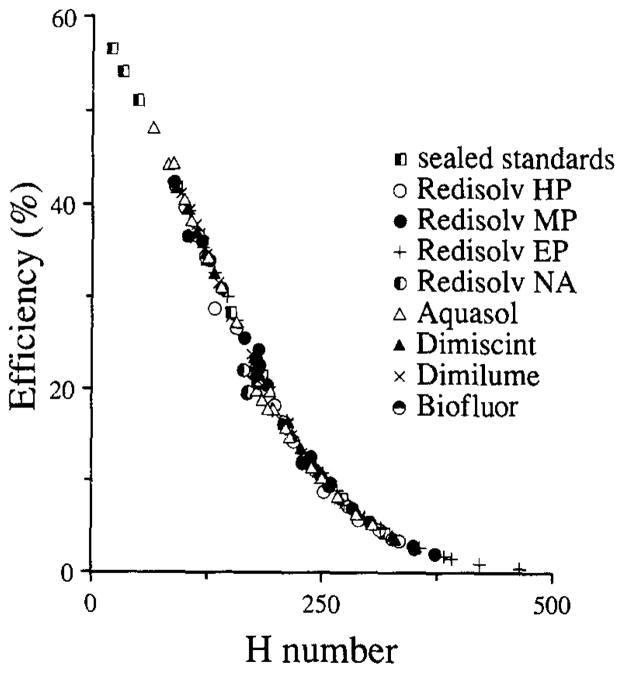
The ideal method should provide quench curves that are stable and are identical for color and chemical quench. If the method is consistent from one scintillation fluid to another, that is also advantageous. The effect of adding CCl4 (chemical quench), picric acid (color quench), saline (chemical quench), and beef heart dissolved in BTS-450 Beckman tissue solubilizer (at a ratio of 1 g tissue to 10 ml of BTS-450) to various cocktails containing 3H is shown in Fig. 3.
FIG. 3.
Similarity in the degree of quenching of 3H in various scintillation fluids with chemical and color quench.
Aliquots of 50 μl each of a standard 3HOH solution containing 140,000 dpm were deposited in 20-ml Wheaton glass scintillation vials containing 10 ml of one of the scintillation fluids. Appropriately diluted stock solutions of chemical quench (carbon tetrachloride), or color quench (picric acid), were then added alone or in combination to each fluid type to generate a series of quenched samples covering the usable range for the liquid scintillation system. The aliquot of the quenching agent was not more than 200 μl. Saline was used for H numbers ranging from 60 to 140, BTS-450 with dissolved heart tissue covered H numbers ranging from 160 to 200, CCl4 was used for H numbers ranging from 65 to 300, and combinations of CCl4 and picric acid were used to produce H numbers ranging from 180 to 464. Some of each were used with each of the scintillator fluids listed in Fig. 3. Sealed standards (supplied by Beckman) covered the range of H numbers from 0 to 350. Samples were counted 10 min each using a tritium window encompassing channels 5 to 400. The efficiencies were calculated from the observed sample count rates divided by 140,000.
The quench curves in Fig. 3 with the different scintillation fluids were virtually superimposable, indicating similar effects of color and chemical quench in the H numbers system. The 3H quench curves were smoothly sigmoidal, and their positions were almost independent of the quenching agent or cocktail.
In any single experiment the range of quenching is usually relatively narrow. Most commercially available sealed standards quench curves are constructed so that there is a point every 20 to 40 H numbers (i.e., 10 samples cover the usable range of the counter). In order to gain accuracy, we have tried to maximize the uniformity of the samples, by keeping all samples within approximately 5 H numbers of one another and by obtaining 10 to 15 efficiency estimates over this interval. The efficiencies of three isotopes in the windows utilized in the gel scintillator system are shown in Fig. 4. Aliquots of 100 μl containing 0.05 μCi of each pure isotope were distributed to a 3 by 12 series of glass minivials (one series for each pure). Each series was then titrated with variable volume aliquots (0.1–2.3 ml) of a 1:4000 diluted solution of saturated picric acid. The titrated volume was held constant at 2.3 ml by adding appropriate aliquots of water. Each vial then received 3.6 ml of RediSolv-MP and was capped and shaken vigorously to produce a uniform clear gel suspension. A similar titration series of vials without isotope additions provided background counts covering the same quench range. Activity was measured over 10 min. Background was then subtracted. The efficiency is the (observed cpm minus background)/dpm.
FIG. 4.
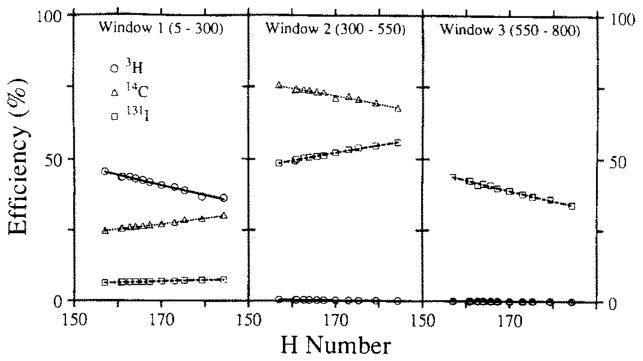
Quench curves in gel scintillator for 131I, 14C, and 3H. The lines are the best-fitting second-order polynomials.
The model functions chosen to fit the quench curve are dependent upon the range and curvature of the data space. The quench curves covering a large range in Fig. 2 required a third-order exponential, whereas the short-range curves of Fig. 4 are fitted well with a second-order polynomial.
Calculations
The observed activity, Wi cpm, in the ith window depends on the sum of the activities, Dj, for the individual isotopes (dpm) and their counting efficiencies. From the observed Wi’s for a sample containing two or three isotopes the Dj’s must be extracted via mathematical analysis. Our “model” for this is a set of linear equations, which is based on assumptions that the spectral shapes are independent of the level of isotope activities. (At very high activity levels, the coincidence of two disintegrations will give rise to artifactual appearance of higher energy components such as “sum peaks”.) For a sample containing three tracers, at each H number there is an efficiency, eij, for isotope j in each window i. The background cpm, Bi (the number of counts in each window in a vial containing only cocktail at a given H number), are obtained for subtraction from the sample cpm in each window, Wi. The eij correct for spillover and quench in accordance with the equations below in order to obtain the dpm, Dj. The Dj are then further corrected for the time course of decay from a common starting time to give the dpm for each isotope in the sample. The equations to obtain the Dj from the Wi are
| [1] |
| [2] |
| [3] |
A standard Gaussian elimination matrix inversion method was used to solve the equations to obtain the Dj from Wi, eij, and Bi. The successive subtraction technique should not be used since it leads to errors propagating preferentially into the lowest energy isotope.
Tests of the accuracy of analysis with mixtures of 131I, 14C, and 3H approximating the wide range of relative levels found in typical outflow dilution data gave ratios of estimated/true dpms of 103 ± 3% for 3H, 97 ± 2% for 14C, and 100 ± 1% for 131I.
Other Combinations of Tracers
Other isotope combinations that should be quantifiable with this analysis include 32P (β energy =1.7 MeV with spectral shape similar to 131I, 0.61 MeV) in combination with either 14C and 3H or 35S and 3H. The energy and spectral shape of 35S (0.17 MeV) is also similar to that of 14C (0.155 MeV). The bimodal 125I spectrum (see Fig. 5) and lower spectral range increase the spectral overlap in three-way combinations that include 3H and either 14C or 35S. Horrocks (1) achieved reasonably good accuracy even with this combination. 125I combined with 14C (or 35S) and 131I should be separable by these same techniques. Separation of two tracers is more accurate than that with three.
FIG. 5.
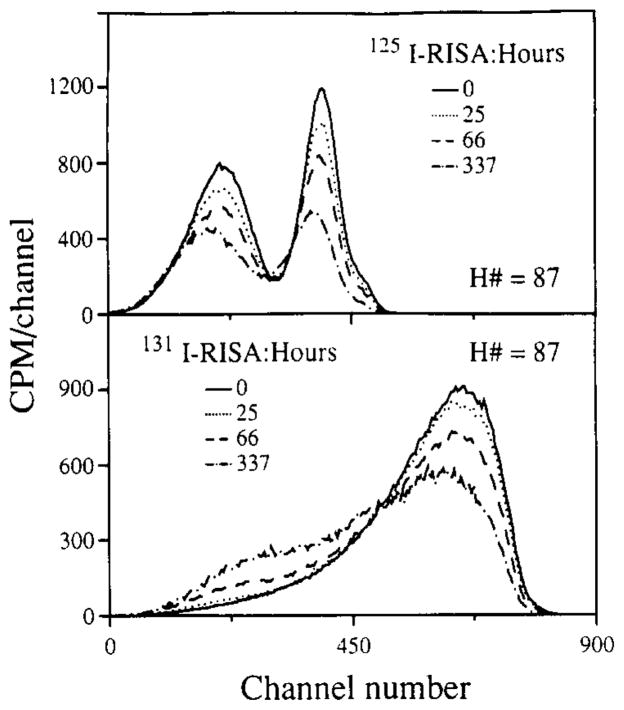
Time-dependent changes in spectra for radio iodinated bovine albumin in the liquid scintillator. Spectra were from 0.1 mCi of 125I-labeled RISA and 131I-labeled RISA in 4.2 ml RediSolv MP at the indicated times after mixing. Spectra were acquired for 5 min and binned into four-channel averages for this display, and decay was corrected.
RESULTS
Stability of Liquid Scintillation Spectra
Effects other than quench may influence the spectral characteristics of a given isotope. A specific example is albumin labeled with either 125I or 131I; when in a liquid phase, scintillation cocktail spectral deformations occur gradually, as shown in Fig. 5. In each case, the decay-corrected total counts diminish with time and high-energy counts are shifted into lower energy regions of the spectrum, particularly for 131I-albumin.
For the higher energy 131I, commonly used on radio-iodinated serum albumin, RISA, the area under the curves diminishes only slightly with time but there is a shift of high-energy to low-energy counts; the loss in total counts over 337 h was 9%. For 131I-albumin, vigorous shaking of the vial restored the spectra to the shape and the total counts observed at time zero. For 125I-albumin there was less spectral deformation, but 40% of the counts were lost over 337 h. For reasons unknown to us, shaking the mixture did not fully restore the spectrum to control levels. Control experiments using a small lipophilic molecule, [125I]IDMI over the same time intervals yielded spectra that were completely superimposable after decay correction. This suggests that the spectral deformation for the iodinated albumins is related to some physical event, such as adhering to walls of the vial, and is not a general problem with all iodinated compounds. We attribute the count loss and spectral shift to separation of tracer from fluor and think that this is due mainly to settling at the bottom of the vial rather than to diffusion to the vertical sides and adherence there (the time for diffusion is adequate for this), because we can often see a slight opaqueness at the bottom of the vial. β emissions occurring into the glass will not activate the fluor, so tracer at a glass surface can be seen with only half its usual efficiency. While 125I will be more susceptible to photon absorption before hitting a fluor molecule than will 131I, the reason for the permanent count loss is not known.
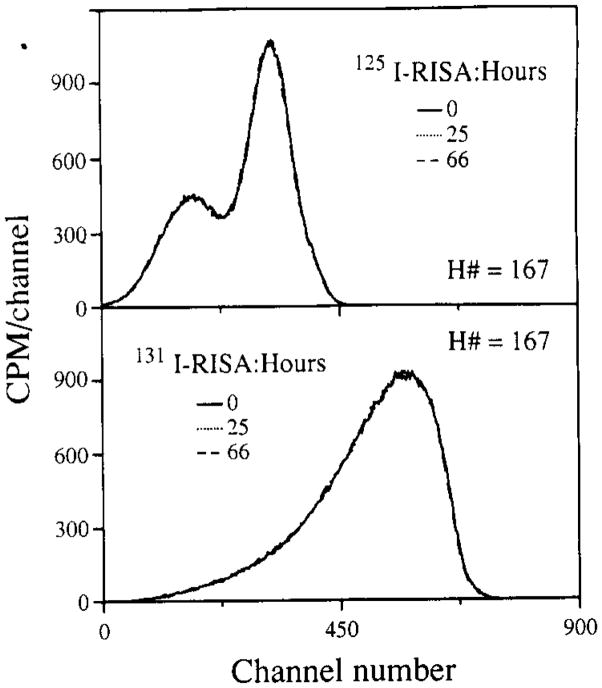
This selective diminution in counts for protein-bound tracer is important to recognize when samples containing labeled proteins are counted. In our indicator dilution experiments, 131I-labeled RISA is usually included in the injectate solution to serve as an intravascular reference tracer defining the transit times for nonpermeating substances. The permeability characteristics of other simultaneously injected “diffusible” solutes, usually 3H- and 14C-labeled, are determined by their transient concentrations relative to that of the intravascular reference. The ratios of the concentrations of the three solutes in the set of simultaneous outflow dilution curves may change by 1000-fold over a minute-long dilution curve, so accuracy in estimation of the concentrations requires precise technology for spectral analysis. A typical experiment generates 400 to 900 samples and takes a long time to run through the LS counter. As the 131I-labeled RISA shows spectral deformation in the liquid counting system over time intervals normally encountered, a counting system which prohibits the settling of denatured radiolabeled macromolecules was developed (see Methods, Saline perfusates from organ perfusion studies). By gelation of the sample, settling of the radiolabeled albumin was prevented and the time-dependent spectral deformations were not observed. In Fig. 6, the decay-corrected spectra for 125I- and 131I-labeled serum albumin in the gel scintillation system are shown for three times.
FIG. 6.
Spectral stability for radioiodinated bovine albumin in gel scintillator. The spectra were from 0.1 mCi of 126I-labeled RISA or 131I-labeled RISA in the gel scintillator system described under Methods, Saline perfusates from organ perfusion studies. These spectra were acquired over 5 min and binned into four-channel averages, and decay was corrected. Changes with time were not statistically evident.
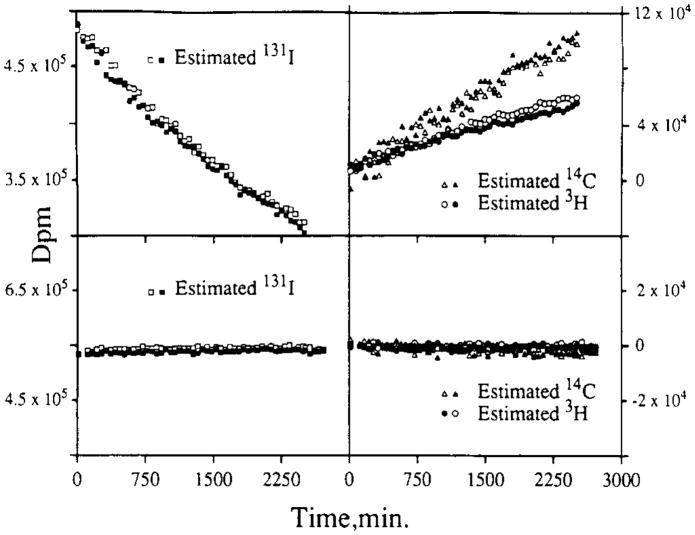
The stability of a gel is dependent upon parameters such as sample volume, salt and protein concentration, and ambient temperature. The gel systems utilized for perfusate and digested tissue samples reflect some of these differences. The higher acid content of digested tissue samples gels at an aqueous volume fraction of 20%, whereas the perfusate samples with pH 7.4 do not form a gel until the water content is 40%. Both were stable for at least 72 h. The effects of instability of the spectra were evaluated in specific tests. Comparable tests with duplicate samples were made for liquid and gel phase counting systems. For this test, each sample contained only 131I-labeled RISA. The samples were counted, giving three Wi’s, using window settings appropriate for a triple-label experiment using 131I-labeled RISA, 14C, and 3H. Quench curves and backgrounds with the same window settings were also generated, giving the Bi and the eij. These observations were then analyzed by solving the set of linear equations to yield the Dj, the activity levels of the three tracers in dpm. The Dj were then corrected for radioactive decay. (The half-life for 131I is 192.96 h versus 12.26 and 5730 years for 3H and 14C). The results comparing liquid phase and gel phase systems are illustrated in Fig. 7. Duplicate runs are shown (solid versus open symbols). The liquid phase system (top) displays a steady decrease in calculated disintegration rates in the highest energy window with steady increases in the estimates of 14C and 3H counts, neither of which was present. This illustrates the potential effects of spectral instability on the calculated disintegration rates for other isotopes in a multiple tracer experiment. An estimation procedure based on the H number and the quench curves would make it appear that increasing amounts of 14C and 3H tracers had been added to samples, counted after long intervals, even though in reality there was only 131I present. The disintegration rates estimated for 3H and 14C should have remained clustered about zero and the high-energy (131I) window disintegration rates should have remained constant. The error illustrated by the sloping lines (top) was due to continuous changes in the eij: the efficiency coefficients.
FIG. 7.
Comparison of the effects of spectral instability in liquid and gel scintillator. The estimated disintegration rates are for samples containing only 131I-labeled RISA in liquid (top) and gel (bottom). Open and closed symbols represent separate runs on duplicate samples. (Top) Liquid system data representing duplicate 100-ml samples containing 0.22 mCi 131I-labeled RISA in 4.2 ml Aquasol. Liquid system window channels were window 1 (5–400), window 2 (400–670), and window 3 (670–860). (Bottom) Gel system data representing duplicate 100-ml samples containing 0.25 mCi 131I-labeled RISA in 2.3 ml of 1:8000 diluted saturated picric acid and 3.6 ml RediSolv MP. Both tests were performed in glass minivials. Gel system window channels were window 1 (5–300), window 2 (300–550), and window 3 (550–800).
Fig. 7 (bottom) illustrates results of a similar test in the gel phase counting system. The constancy of disintegration rates in the high-energy (131I) window and the clustering around zero in the lower energy windows demonstrate the efficacy with which the gel system retards spectral deformation.
An Application to Multiple Tracer Indicator Dilution Studies
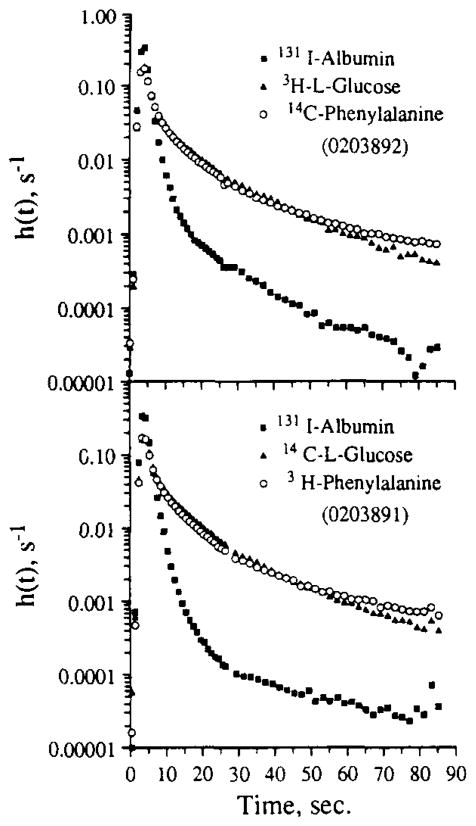
The methods described above were applied to perfusate samples from multitracer outflow dilution experiments. Typical outflow concentration time curves cover a four-decade concentration range with the relative activities of a pair of tracers constantly changing by as much as 100-fold. The resulting indicator dilution curves are modeled as a multiregion organ using convection diffusion algorithms and physical estimates of flow heterogeneity in the capillary bed. Differential permeation of various cell membranes contributes to the shape of each tracer’s outflow profile. The analytic methodology must be accurate enough to probe subtle physiologic effects on the delay and dispersion of each of the injected tracer-labeled solutes. An example of an experiment is shown in Fig. 8. The tracers were simultaneously injected into the aortic root. The tracer injection for the curves in Fig. 8 (top) were obtained about 15 min after those in Fig. 8 (bottom). Coronary venous effluent was collected over 1-s intervals for the first 30 s and over 2-s intervals thereafter until 90 s of data had been acquired. Each data point represents the fraction of the injected dose emerging per second within intervals centered at the indicated times. Both panels show normalized outflow dilution curves for 131I-labeled RISA, L-glucose, and L-phenylalanine. These data were chosen to illustrate the sensitivity of the tracer quantitation scheme to subtle differences in tracer levels in the tail portion of the curves. The crossover in levels and the prolonged elevation of the phenylalanine tail relative to glucose is attributable to phenylalanine uptake by the cardiomyocytes. The molecular weights for labeled phenylalanine and glucose are 169 and 182, respectively. The ratio of the diffusivity of phenylalanine to glucose, estimated from the square root of the ratio of molecular weights, is 1.037 (7). Over the period from 10 to 30 s, the outflow phenylalanine curves are lower than the glucose curves, indicating higher net extraction. While this looks subtle, the amount of uptake it represents is considerable and by far exceeds the amount in the late tail, at levels a decade lower on this logarithmic scale when the phenylalanine concentration was higher than that of the L-glucose. In the absence of phenylalanine uptake, the curve tails would be nearly superimposed; this is observed when tracer phenylalanine uptake is blocked by high chemical levels of “nontracer” phenylalanine.
FIG. 8.
Two sets of outflow dilution curves obtained from rabbit heart in response to the simultaneous injection (0.4 ml bolus) of the tracers into the aortic root. The ordinate, h(t), is the fraction of the injected tracer dose emerging per second into the outflow. The samples were analyzed using the gel system. The difference in the shape of the phenylalanine curves from the L-glucose curves gives a measure of uptake by myocytes. Note that the subtle differences between L-glucose and phenylalanine are the same in the two sets of curves even though their tracer labels 3H and 14C were interchanged. Note also that the albumin curve has a 104 range of values and that the ratio of 131I/14C ranges from about 2 to 3 on the upslopes and peaks to about 0.03 during the tail of the curves.
The point of Fig. 8 is that the shapes of the curves are uninfluenced by the choice of isotopic label when using our counting technique. In the Fig. 8 (top) we used [3H]-glucose and [14C]phenylalanine and in Fig. 8 (bottom) the labels were reversed. The sets of curves appear similar despite the reversal of the tracer labels and despite some change in the shape of the albumin curve. Any differences may also be attributable to differences in the organ input function. The virtual equivalence of results suggests that the signals can be interpreted in terms of the physiology and are not influenced by the isotope technique. The physiologic interpretation made by precise fitting of the model to the data, which is not shown, is that there is significant uptake and retention of phenylalanine by myocytes, but probably not by endothelial cells.
Counting γ Emissions in Liquid and Gel Scintillation Systems
It is often practical to count the emissions of both β and γ emitters in β-counting systems. Sometimes this works well because some isotopes give off both β and γ emissions, as does 131I. The other mechanism is by counting Cerenkov radiation, which gives a low-energy spectral peak not very different from that of 3H in LS systems. An example is 125I, which has a low-energy (β emission (0.03 MeV) and a low-energy γ emission (0.035 MeV); a low-energy γ produces Cerenkov counts more efficiently than does a high-energy γ.
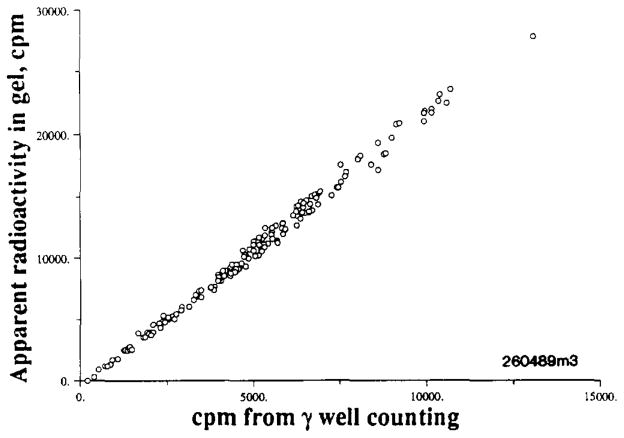
Polystyrene 15-μm microspheres are commonly used as deposition markers for regional flows within organs. In LS media they gradually sink to the bottom, where their count efficiency drops toward half of what it is in suspension. In gel systems, the spheres remain suspended so that count rates do not diminish with time. In the Redisolv MP system, the observations for 85Sr-labeled 15-μm-diameter microspheres are shown in Fig. 9: the apparent activity in the gel system is actually about twice as high as that in the standard γ-counting well system. The 85Sr activity was measured in the presence of [3H]desmethylimipramine, a molecule that acts like a microsphere in being nearly 100% extracted in a single passage through the heart (8). Since 85Sr is a high-energy γ emitter (0.5 MeV) the efficiency of production of Cerenkov counts is relatively low. It has almost no β emissions (<1%, at 0.5 MeV).
Fig. 9.
Comparison of 85Sr raaioactive emissions by liquid scintillation counting in a gel suspension versus standard γ counting in a NaI well counter. The myocardial tissue samples weighed 200 to 300 mg. They contained also [3H]desmethylimipramine. Samples were counted in the γ well system, digested, and then suspended in a gel scintillator and counted using window 1 (5–300) and window 2 (350–670) for 3H and 85Sr.
The overall count efficiency in the gel is actually quite high and makes it quite practical to count not only γ and β emitters simultaneously but even γ emitters on particulate matter, given that the spectra are sufficiently different.
DISCUSSION
Although liquid scintillation counting is a well-established technique, accurate estimation of the individual activities of two or three tracers in a sample is neither standard practice nor simple. Nevertheless, the principles are straightforward, and the methods detailed above do give consistent results. The main advantage of triple β counting is that the need to perform physicochemical separation of two or three tracer-labeled compounds in samples is obviated.
The influence of a time-dependent physicochemical process occurring in the tracer–scintillant solution can be examined by acquiring a series of spectra. The spectra change greatly with precipitable dispersions or macroaggregates. One example of a new scintillation fluid is Beckman’s RediSolv-HP, which dissolves the protein, preventing precipitation; it gave spectra on 131I-labeled RISA that were stable over 100 h. The gel system is still preferred when we need to quantitate the β activities of one or more isotopes in combination with radioactive microspheres. For example, in one set of experiments it was necessary to measure microsphere deposition densities in each of over 2500 tissue samples along with the local deposition of a highly extracted solute, [131I]-iododesmethylimipramine (9). In a liquid phase system, the 15-μm microspheres quickly settle, yielding an extreme of sample heterogeneity with respect to tracer scintillant mixing. The digestion of tissue and resulting gel state derived from the tissue sample processing scheme yields a rigid gel that suspends the microspheres in a more favorable geometry so that each microsphere is in contact with the scintillant rather than forming a separate phase in the vial bottom.
Further improvements that should be made for ease in sample handling include: (i) automated pipetting of scintillant, (ii) automated sample mixing with scintillant in the counting vial, and (iii) automated cleaning of vial surfaces to remove light-absorbing or -scattering fingerprints and dirt. For the labeled proteins, we encourage the development of a scintillant which undergoes a gel/sol conversion at about 35°C. This would allow pipetting (hopefully automated) of the slightly warmed scintillant into the vials and gelation on return to room temperature.
Another desired improvement is in the mathematics of identifying tracer contents. Given the background spectrum for a particular degree of quenching and a library of spectra of the tracers in the sample, the best method of identification of a given sample would be to use a nonlinear optimization to match the sample spectrum with the weighted sum of the background and the pure tracer spectra. This approach requires collecting the whole spectrum for each sample, having a spectrum for background, for each tracer at each level of quench, and having an efficient nonlinear optimizer.
Consequently, the windowing technique used here has the advantage that only the quench curves (as in Fig. 4) and background are needed, along with the integrated sample counts in each window. The identification of tracer dpms is then accomplished by solving the equations (given under Calculations), by matrix inversion. (Note that the successive subtraction technique should not be used since error is propagated preferentially into the estimates of the activity of the lowest energy tracer.)
In some cases more than three windows might be used for triple counting. This would enable one to take advantage of spectral form. For example, one might use a fourth window for the secondary peak of a two-peaked spectrum, as is possible with 125I, whose spectrum is shown in Fig. 5.
Another reason for using more than three windows in triple counting is to correct for amplifier drift in the liquid scintillation system, which fortunately was not needed for our system. The approach has been outlined in excellent detail by Baer et al. (10), using three windows per spectral peak, one above the peak and one on either side. Their idea, applied to γ-emitting tracers, not only provided overdetermination in the matrix inversion (nine windows for three unknowns, for example), but also allowed recognition of small spectral shifts due to variation in amplifier gain. This was detected (and accounted for) when the relative cpm in a window on one side of a peak changed with respect to that in the window on the other side of the peak. In our system, this would be partially compensated for by a shift in the apparent degree of quench. In general, liquid scintillation counting is less sensitive to this source of error because the peaks are relatively broad compared to those in γ spectra.
In summary, our liquid scintillation triple-label counting technique is acceptable in terms of effort and accuracy, but can no doubt be improved with further modifications.
Acknowledgments
This work was supported by funding from NIH Grants HL-19139 and RR-01243. The authors appreciate the help of Maureen Feeley and Eric Lawson in the preparation of the manuscript. The early efforts of Dr. Stephen E. Little in attempting to achieve high accuracy in three-tracer β counting were a great stimulus to this work. The discussions with the late Dr. Donald L. Horrocks and some of his colleagues are greatly appreciated.
Footnotes
Abbreviations used: LS, liquid scintillation; IDMI, iododesmethylimipramine; RISA, radioiodinated serum albumin.
References
- 1.Horrocks DL. Trans Am Nucl Soc. 1982;43:39–41. [Google Scholar]
- 2.Moffett TC, Chan IS, Bassingthwaighte JB. Am J Physiol. 1988;254 doi: 10.1152/ajpheart.1988.254.3.H570. [DOI] [PMC free article] [PubMed] [Google Scholar]; Heart Circ Physiol. 23:H570–H577. [Google Scholar]
- 3.Horrocks DL. J Radioanal Chem. 1978;43:489–521. [Google Scholar]
- 4.Kolb AJ, Horrocks DL. Lab Pract. 1981;30:481–483. [Google Scholar]
- 5.Horrocks DL, Kolb AJ. Lab Pract. 1981;30:485–487. [Google Scholar]
- 6.Boggs PT, Byrd RH, Schnabel RB. SIAM J Sci Stat Comput. 1987;8(6):1052–1078. [Google Scholar]
- 7.Stein WD. Transport and Diffusion across Cell Membranes. Academic Press Inc; Orlando, FL: 1986. [Google Scholar]
- 8.Little SE, Link JM, Krohn KA, Bassingthwaighte JB. Am J Physiol. 1986;250 doi: 10.1152/ajpheart.1986.250.6.H1060. [DOI] [PMC free article] [PubMed] [Google Scholar]; Heart Circ Physiol. 19:H1060–H1070. [Google Scholar]
- 9.Bassingthwaighte JB, Malone MA, Moffett TC, King RB, Chan IS, Link JM, Krohn KA. Circ Res. 1990;66:1328–1344. doi: 10.1161/01.res.66.5.1328. [DOI] [PMC free article] [PubMed] [Google Scholar]
- 10.Baer RW, Payne BD, Verrier ED, Vlahakes GJ, Molodowitch D, Uhlig PN, Hoffman JIE. Am J Physiol. 1984;246 doi: 10.1152/ajpheart.1984.246.3.H418. [DOI] [PubMed] [Google Scholar]; Heart Circ Physiol. 15:H418–H434. [Google Scholar]


