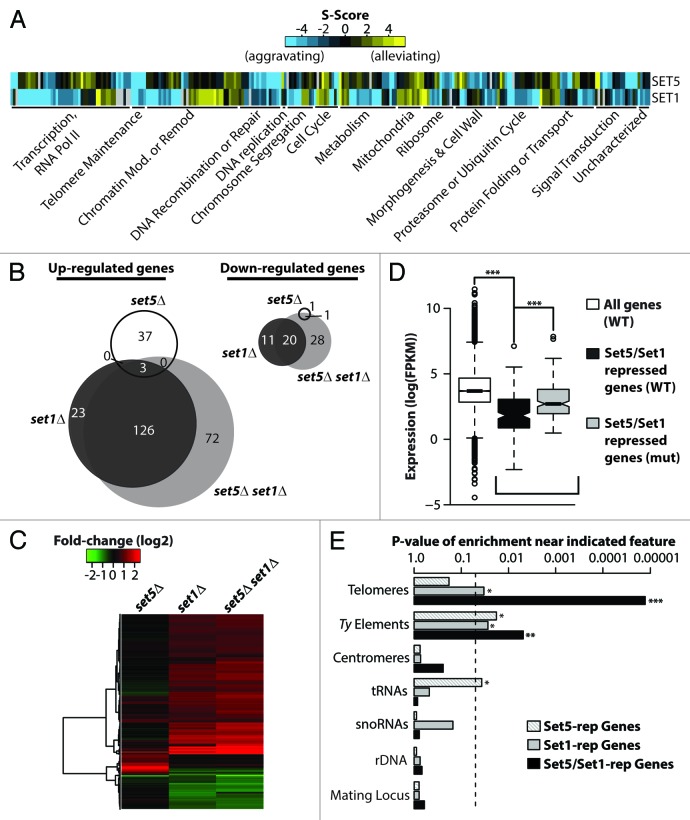
Figure 1. Set5 and Set1 synergistically repress transcription of genes enriched near repetitive elements. (A) Heatmap representation of E-MAP genetic interaction scores (S-scores) of genes that show significant interactions with SET1 and SET5. Genes were grouped into previously described manually-curated categories.18 (B) Venn diagram of differentially regulated genes between wild type and indicated gene knockout strains with false discovery rate (FDR) < 0.05 and fold change > 1.7 in RNA-Seq analysis. (C) Expression heatmap and hierarchical clustering of strains described in (B). Color intensity represents fold-change (log2) in gene expression relative to wild type (WT). (D) Set5 and Set1 repress a subset of lowly expressed genes in WT cells. Boxplots depict the gene expression distributions of all genes in WT [white; “All Genes”], Set5/Set1-repressed genes in WT [black, “Set5/Set1-repressed genes (WT)”], and Set5/Set1-repressed genes in set5∆ set1∆ [gray; “Set5/Set1-repressed genes (mut)”]. “Repressed” genes represent significantly differentially upregulated genes in the double mutant compared with WT. Expression is shown as FPKM (Fragments Per Kilobase per Million mapped reads). (E) Set5/Set1-repressed genes are enriched near transposable elements and telomeres. Indicated chromosomal features are shown according to p-value of enrichment, described in Methods, for genes whose repression is dependent on Set5, Set1, or Set5/Set1. Dashed vertical line denotes P = 0.05. P values represent the two-sided probability value from the Wilcoxon rank sum test, *P < 0.05, ** P < 0.01, *** P < 0.001.

An official website of the United States government
Here's how you know
Official websites use .gov
A
.gov website belongs to an official
government organization in the United States.
Secure .gov websites use HTTPS
A lock (
) or https:// means you've safely
connected to the .gov website. Share sensitive
information only on official, secure websites.
