Abstract
This study investigates the influence of the controlled release of bone morphogenetic protein 7 (BMP-7) from cross-linked chitosan microparticles on pre-osteoblasts (OB-6) in vitro. BMP-7 was incorporated into microparticles by encapsulation during the particle preparation and coating after particle preparation. Chitosan microparticles had an average diameter of 700 μm containing ~100 ng of BMP-7. The release study profile indicates that nearly 98% of the BMP-7 coated on the microparticles was released in a period of 18 days while only 36% of the BMP-7 encapsulated in the microparticles was released in the same time period. Cell attachment study indicated that the BMP-7 coated microparticles have many cells adhered on the microparticles in comparison with microparticles without growth factors on day 10. DNA assay indicated a statistical significant increase (p<0.05) in the amount of DNA obtained from BMP-7 encapsulated and coated microparticles in comparison with microparticles without any growth factors. A real time RT-PCR experiment was performed to determine the expression of a few osteoblast specific genes - Dlx5, runx2, osterix, osteopontin, osteocalcin, and bone sialoprotein. The results thus suggest that chitosan microparticles obtained by coacervation method are biocompatible and helps in improving the encapsulation efficiency of BMP-7. Also BMP-7 incorporated in the microparticles is being released in a controlled fashion to support attachment, proliferation and differentiation of pre-osteoblasts, thus acting as a good scaffold for bone tissue regeneration.
Keywords: BMP-7, chitosan, microparticles, controlled release, in vitro, osteoblasts
1. Introduction
Chitosan is a natural polymer available in abundance in nature. It is a polysaccharide composed of glucosamine and n-acetyl-d-glucosamine units joined by β-1,4 glycosidic bonds. Chitosan shows promise in mimicking the organic portion of natural bone. It possesses the characteristics of biocompatibility, biodegradability, osteoconductivity, wound healing capabilities, and antibiotic properties that makes it an ideal material for preparing bone scaffolds [1,2]. Chitosan has been used for preparation of films, gels, sponges, beads, and many other forms for applications in wound healing, drug delivery, and bone tissue engineering [3-5]. Nonetheless, like any other synthetic graft material, it cannot imitate all the properties of a natural bone. Therefore, the use of scaffold materials that incorporate growth factors would provide an additional stimulatory effect to improve the bone healing capacity.
In vivo, growth factors have been found to regulate many of the osteogenic related activities, especially proliferation [6], differentiation [7], and angiogenesis, thus enhancing bone healing. Bone morphogenetic proteins (BMPs), insulin like growth factor (IGF), tumor-like growth factor (TGF), and vascular endothelial growth factor (VEGF) are known to play an important role in bone formation and healing processes in vivo [8-9]. Previous studies have shown that BMPs play a very crucial role in bone formation by inducing mesenchymal stem cells (MSCs) to differentiation towards osteoblastic lineage, especially BMP-2 and BMP-7 [10-11]. Despite the known benefits of growth factors, still more facts needs to be studied, especially regarding the mode of delivery, as it is one of the critical factors determining its effectiveness.
In order to deliver it in a controlled manner with efficiently and in bioactive form, encapsulation of the growth factor in a carrier can be a useful solution. This method of local delivery could be very advantageous, both in terms of raising the growth factor concentration at the action site [12] and improving the half-life of the growth factor by not letting it expose to the in vivo enzymes. The controlled delivery of the growth factor over prolonged period of time is beneficial for faster and complete bone healing process [13]. Studies have found that sustained release of BMP is essential as its activity is highly controlled and self-limiting through a combination of signal-transducing and inhibiting proteins [14].
Therefore, chitosan can be used to develop microparticles to be used as a controlled delivery system for BMP-7. Previously, chitosan has been used to prepare microparticles by several methods including emulsification, freeze-drying, and cross-linking. Most of these studies so far have used chemicals and conditions, which are not favorable for the stability of the growth factors [15,16]. There are also a number of surrounding environmental parameters which regulate the release of growth factor from the microparticles as well as its stability that needs to be studied in order to better understand the controlled release kinetics.
Based on the considerations mentioned earlier, in the present study, the chitosan-tripolyphosphate microparticles fabricated under benign environmental conditions were used for controlled delivery of BMP-7. Individually, both chitosan and BMP-7 promote cell growth and differentiation, but together as a system, they have not been studied for its effectiveness as a bone regeneration material. In addition, different methods of growth factor encapsulation were tested to observe the influence of the released growth factor on the pre-osteoblasts. The main hypothesis of the study is that microparticles with BMP-7 act as a better scaffold material for adhesion, proliferation, and differentiation of pre-osteoblasts in comparison with controls.
2. Methods
2.1 Release kinetics
The microparticles were fabricated using a coacervation technique using chitosan as a base polymer and cross-linking with sodium tripolyphosphate (TPP). Chitosan (2% w/v) was prepared by dissolving in acetic acid (1% v/v) at room temperature. The mixture was passed through a nylon mesh to remove insoluble substances. This mixture was then added drop wise to the 50% TPP solution and continuous stirring at 250 rpm. The microparticles were allowed to cross-link for 5 h and then were air-dried. BMP-7 for the release study was encapsulated in two ways. In the first method, BMP-7 was added to the chitosan solution which is then added to TPP solution to cross-link and form the microparticles (BMP-7 encapsulated microparticles). In the second method, BMP-7 was added to the dried microparticles, which adsorbed the BMP-7 and then were again dried before using for the release study (BMP-7 coated microparticles). 20 mg of both types of microparticles were suspended in PBS (pH 7.4) and incubated at 37°C with continuous rotation at 25-50 rpm for a period of two weeks. At predetermined time points, phosphate buffered saline (PBS) containing the released BMP-7 was collected and replaced with 2 ml of fresh PBS to maintain the sink conditions. Samples were stored at -20°C until further analysis. The BMP-7 remaining in the microparticles after the study period was determined by dissolving the microparticles in 1% (v/v) acetic acid at 37°C for 24-48 h. To quantify the BMP-7 released, enzyme linked immunosorbent assay (ELISA) was used. Manufacturer’s protocol was followed to do the ELISA (R & D Systems). Triplicates of each sample were used to do the assay and the results are expressed as mean ± SD.
2.2 Morphology study by scanning electron microscopy
Sterilized microparticles (25 mg) were seeded with cell suspension containing 105 cells/ml in a 24-well plate and incubated at 37°C with 5% CO2. Cell culture medium was changed every three days. The morphology of the osteoblast adhered to the chitosan microparticles was determined using scanning electron microscopy (SEM). The samples were fixed in 2.5% glutaraldehyde followed by dehydration in graded ethanol series – 20%, 30%, 50%, 70%, 80%, 90%, and 95% v/v respectively for 5 min in each concentration, followed by three-10 min changes of 100% ethanol. Samples were critical point dried (CPD) and then immediately the samples were sputter coated with gold/palladium (80/20). Specimens were examined using a Hitachi S-4800 SEM fitted with SE detector. The microscope was operated in normal current –SE detection mode. The cells attached to the chitosan microparticles were viewed at 5 kV accelerating voltage and 2 μA current. The SEM images obtained were analyzed by Image J software to determine the area occupied by the cells on the microparticles. For each sample, triplicates were used and in each of the triplicates, n=10 images were analyzed to obtain average area.
2.3 Cell viability
The live cells adhered on the chitosan microparticles were confirmed by intracellular esterase activity as indicated by the green fluorescence of calcein, which had been enzymatically converted from calcein AM. Dead cells were simultaneously recognized by their red fluorescence caused by the binding of nucleic acids to ethidium homodimer 1 that has entered the cells through damaged membranes. For the assay, 25 mg of microparticles were sterilized under UV light for 45 min in a 24 well-plate. The microparticles were seeded with cell suspension containing 105 cells/ml. Media was changed every three days. In order to specifically determine the cells attached to the microparticles, the microparticles were transferred to another well after washing them with PBS and then live/dead viability/cytotoxicity (Invitrogen, USA) assay was performed according to the manufacturer’s protocol on day 5 and 10. The percent area of microparticle covered with cells was determined using Image J software. The area of the microparticle was calculated considering it circular (projection of sphere would be a circle) and since only half of the surface is visible at a time, only half of that area was considered in the calculations.
2.4 Quantification of DNA
Murine osteoblast cells (OB-6) were seeded at a density of 100,000 cells/ml in 24 well-plates. Cells were incubated at 37°C with 5% CO2 atmosphere for 5 and 10 days. The data presented for the DNA assay is an average of 3 experiments conducted with the same parameters and for each experiment there were triplicates for each sample. In order to quantify the total number of cells grown in the well plate in the presence of growth factors being released from the microparticles, the assay was done in the same well to obtain the DNA from the cells attached to the well plate and the microparticles, and in order to quantify the cells attached and proliferating only on the microparticles, the microparticles were transferred to another well plate and then the DNA was extracted and quantified. At each time point, the microparticles were washed thoroughly with PBS before doing the DNA assay to make sure that there is no fetal bovine serum (FBS) or culture medium left absorbed in the microparticles, as they hinder with the DNA extraction process and reduce the yield. In both types of experiments, the remaining part of the experiment was the same. DNA kit from Qiagen was used to extract DNA from the osteoblast cells. After washing with PBS, 20 μl of each proteinase K and RNAse was added to the wells with microparticles followed by addition of 100 μl of PBS and lysis buffer respectively. The solutions were mixed and then kept in water bath maintained at 55°C for 10 min to maximize the efficiency of the added enzymes. Ethanol (200 μl) was added to the above mixture and then the total mixture was transferred to the spin column supplied in the kit. Then the procedure mentioned in the kit is followed to obtain maximum DNA. The quantity and purity of the obtained DNA is analyzed using Nanodrop-1000, version 3.6.0.
2.5 Real time reverse transcription-polymerase chain reaction (RT-PCR) analysis
Cells were seeded at 2 × 10⁵ cells/ml and cultured in the presence of microparticles (with and without BMP-7) for 5, 7 and 14 days. Total RNA was isolated using RNeasy Mini Kit (Qiagen, USA) following manufacturer’s instructions. The purity and concentration of total cellular RNA was determined using Nanodrop-1000, version 3.6.0. The minimum RNA amount obtained was considered as a base for calculations to reverse transcribe complementary DNA (cDNA) using the Verso cDNA kit (Thermo Scientific, USA) according to manufacturer’s protocols. The forward and reverse primers for the selected genes were designed from Integrated DNA Technologies (IDT, USA) and are listed in Table 1. Expression was quantified using real time RT-PCR analysis with SYBR green master mix kit (Applied Biosystems, USA). Data analysis was carried out using Applied Biosystems StepOne Plus thermal cycler and detection system. The real time RT-PCR analysis was carried out for two independent experiments with each sample run in duplicates. The gene expression levels were normalized to the expression of the housekeeping gene GAPDH and were expressed as fold changes relative to the expression of the genes in cells.
Table 1.
Primers used for real time RT-PCR
| Target gene | Forward primer sequence (5’-3’) | Reverse primer sequence (5’-3’) |
|---|---|---|
| GAPDH | ACGACAGTCCATGCCATCAC | TCCACCCTGTTGCTGTA |
| Osterix | AGCGACCACTTGAGCAAACAT | GCGGCTGATTGGCTTCTTCT |
| Osteopontin | GATGATGATGACGATGGAGACC | CGACTGTAGGGACGATTGGAG |
| Osteocalcin | CGGCCCTGAGTCTGACAAA | GCCGGAGTCTGTTCACTACCTT |
| DLX5 | TGACAGGAGTGTTTGACAGAAGAGT | CGGGAACGGAGCTTGGA |
| RUNX 2 | GGGCACAAGTTCTATCTGGAAAA | CGGTGTCACTGCGCTGAA |
| BSP | AACAATCCGTGCCACTCA | GGAGGGGGCTTCACTGAT |
2.6 Determination of mineralization by von kossa staining
Von Kossa staining was carried out to characterize mineralization of differentiated osteoblasts. Microparticles were plated with 2 × 10⁵ cells/ml. On day 5 and 10, the cultures were washed thrice with 1X PBS solution and then the cells were fixed in 2.5% glutaraldehyde in 0.1 M sodium cacodylate buffer for 1 h. Later, the microparticles were washed thoroughly in water and then 2% silver nitrate solution was added and the plate was placed on aluminum foil and kept under light for 10 min, after which the plate was rinsed thoroughly with water and dried for image analysis using bright field microscopy. The images were analyzed using Image J software to determine the area of mineralization in each image. For each group, triplicates were used and for each one of the triplicate, n=10 images were used to calculate the area of mineralization.
2.7 Statistical analysis
Data are reported as means ± standard deviation for n=3 unless otherwise stated. SPSS one-way and two-way analysis of variance (ANOVA) followed by post-hoc Tukey’s honest significant difference (HSD) test was performed to determine the significant difference among the various groups. A probability value of p<0.05 or p<0.001 was used to determine significance, which was specified each time.
3. Results
3.1 BMP-7 release kinetics
The release study indicated that nearly 98% of the BMP-7 coated on the microparticles was released at day 18, while in BMP-7 encapsulated in the microparticles, only 36% was released (Fig 1). SPSS univariate analysis of variance indicated that there is a significant difference (p<0.001) in the release of BMP-7 incorporated in the two different ways at all the time points from t=0 to t=18. The release from the microparticles can mainly be attributed to two processes, diffusion and desorption. At first, the proteins adsorbed on the surface are released due to desorption and later, the encapsulated protein is released by the process of diffusion.
Fig.1.
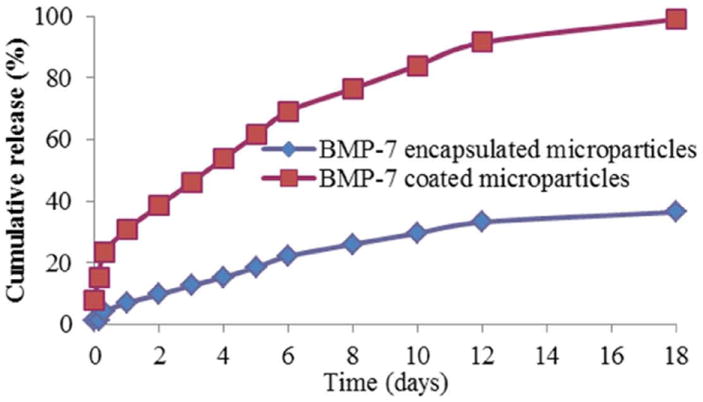
Cumulative release profile of BMP-7 encapsulated microparticles and BMP-7 coated microparticles over a period of 18 days.
3.2 Morphology study
On day 5, the cells appeared to be circular and elongated, with their body raised above the surface on all the three types of microparticles. On BMP-7 coated and encapsulated microparticles, the cells appeared to be growing in a number of small colonies throughout the surface of the microparticle. While on the chitosan microparticles with no growth factors, colonies seem to be smaller in comparison with those containing BMPs (Fig. 2). Although the surface of the three different types of microparticles- normal chitosan microparticle with no growth factor, BMP-7 coated microparticle and BMP-7 encapsulated microparticle appeared to be similar, the cells showed distinct difference in the proliferation rate on the three different surfaces on day 10. On BMP-7 coated microparticles, the cells were flattened and well spread covering majority of the 700 μm diameter microparticle. The cells were found to have very thin edges and filopodia adhered to the surface of the microparticle (Fig. 3). The cells were found to be closely associated with the surface of the chitosan microparticle. Even on BMP-7 encapsulated microparticles, the cells appeared to be flattened but the spreading of the osteoblasts was not as extensive as that of cells on BMP-7 coated microparticles (Fig. 4). While on microparticles with no growth factors, the cells appeared flattened, with even lesser area of the microparticle occupied (Fig. 2). The cell body also appeared to be raised above the surface of the microparticle.
Fig 2.
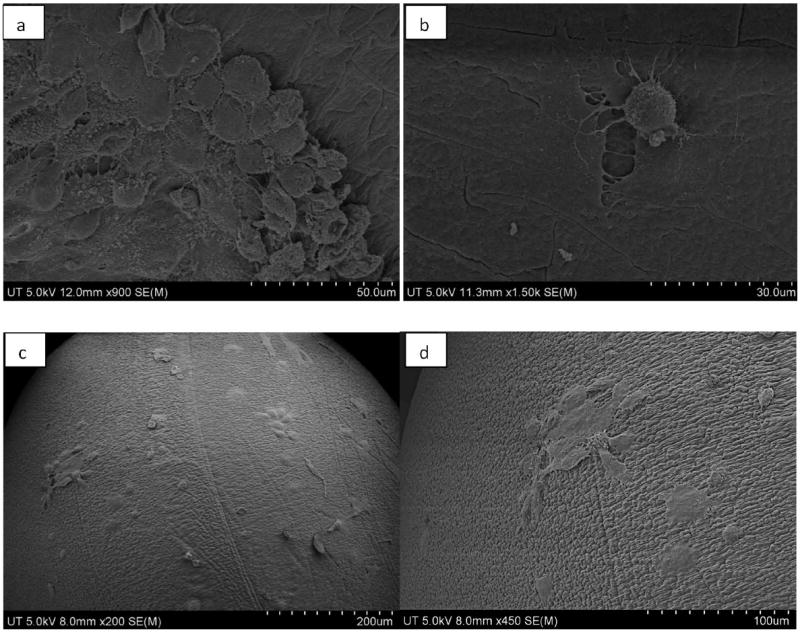
SEM image of murine osteoblasts attached and proliferating on normal chitosan microparticle without any growth factor as observed on day 5 – a, b) lower magnification at a scale of 50 μm and higher magnification at a scale of 30 μm, respectively, and on day 10 – c, d) lower and higher magnification at scale of 200 μm and 100 μm, respectively.
Fig. 3.
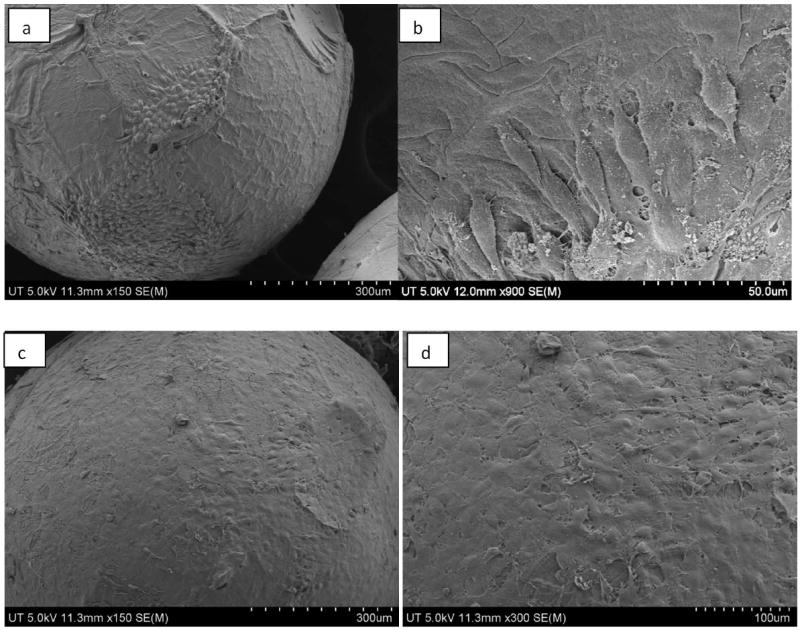
SEM image of murine osteoblasts attached and proliferating on BMP-7 coated chitosan microparticle as observed on day 5 – a, b) lower magnification and higher magnification at a scale of 300 μm and 50 μm, respectively, and on day 10 c, d) lower and higher magnification at a scale of 300 μm and 100 μm, respectively.
Fig. 4.
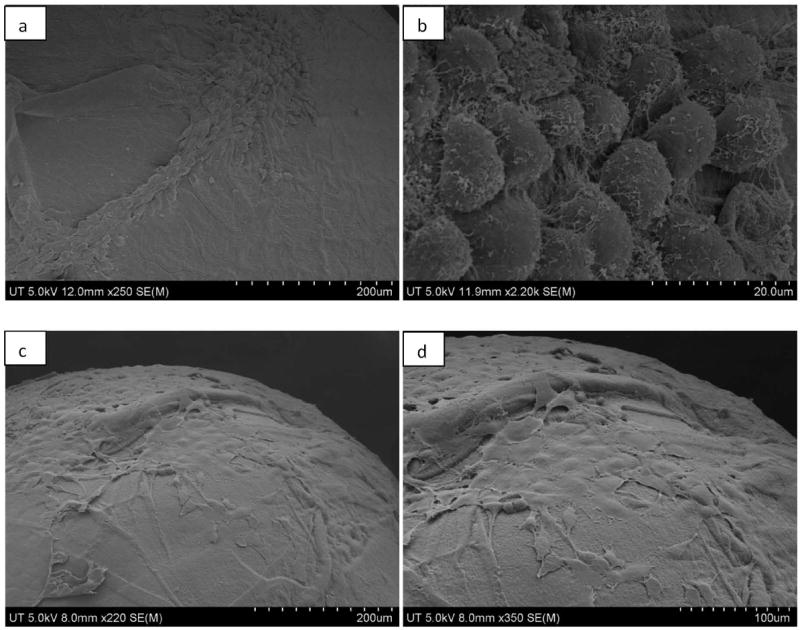
SEM image of murine osteoblasts attached and proliferating on BMP-7 encapsulated chitosan microparticle as observed on day 5 – a, b) lower and higher magnification at a scale of 200 μm and 20 μm, respectively, and on day 10 c, d) lower and higher magnification at a scale of 200 μm and 100 μm, respectively.
3.3 Cell viability assay
The viability of osteoblasts attached to the three dimensional chitosan microparticles was determined by live/dead assay. A significant increase (p<0.001) is observed in the area occupied by the cells adhered onto the microparticles (indicating more number of cells) on day 10 in comparison with day 5, indicating the biocompatibility of chitosan-TPP microparticles (Fig. 5). Therefore, it can also be stated that the amount of acetic acid used in microparticle preparation and the presence of TPP is not detrimental for the osteoblasts. ANOVA analysis by SPSS pairwise comparison indicated that on day 5, a significant difference (p<0.05) exists in the number of viable cells attached to normal microparticles without any growth factor (Fig. 6) and BMP-7 coated microparticles (Fig. 7). No significant difference was observed in the number of cells attached to BMP-7 encapsulated and normal (p=0.445) as well as BMP-7 coated microparticles (p=0.147). This result suggests that bioactive BMP-7 being released from the encapsulated microparticles does not bring a difference in cell proliferation by day 5. But on day 10, a significant difference was observed among all the three types of microparticles (p<0.001). Day 10 result suggests that bioactive BMP-7 is release from both the BMP-7 coated (Fig. 8) and encapsulated microparticles (Fig. 9) and also the amount of BMP-7 being released increases cell proliferation. Tukey’s posthoc analysis indicates that a significant difference exists in the number of viable cells proliferating on BMP-7 coated microparticles in comparison with BMP-7 encapsulated (Fig. 8) and normal microparticles (p<0.001) and also between BMP-7 encapsulated and normal microparticles (p<0.05).
Fig. 5.
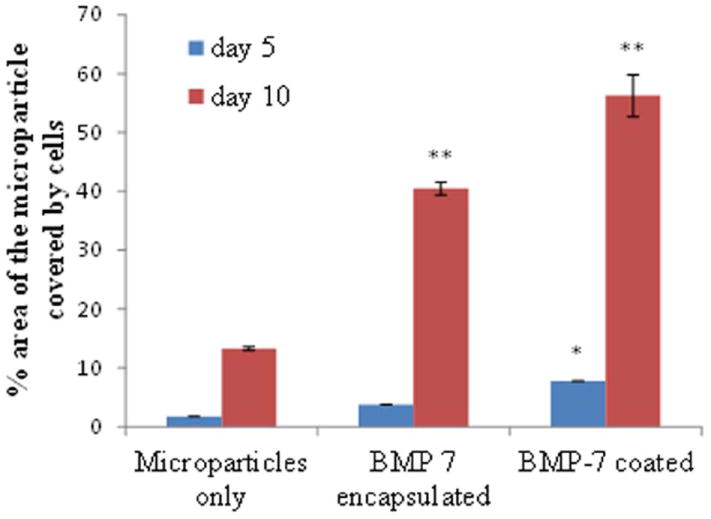
Area occupied by the cells on the microparticles on day 5 and 10. The area is calculated using image J software.
Fig 6.
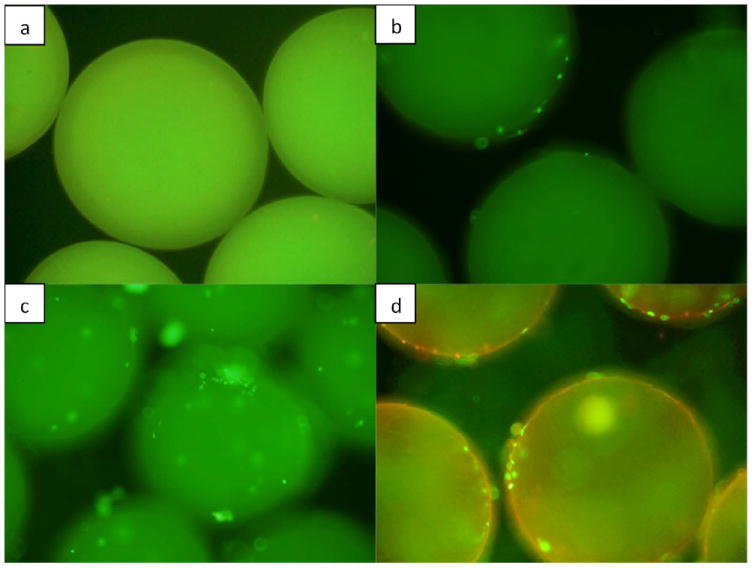
Live/dead fluorescence image of microparticles a) without cells (control), b) without any growth factors on day 5, c) encapsulated with BMP-7, seeded with murine osteoblasts on day 5, d) without any growth factor on day 10. Microparticles are three dimensional and therefore in order to capture all the cells attached throughout the surface of the particle, different views were considered starting from periphery of the particle to its upper surface.
Fig 7.
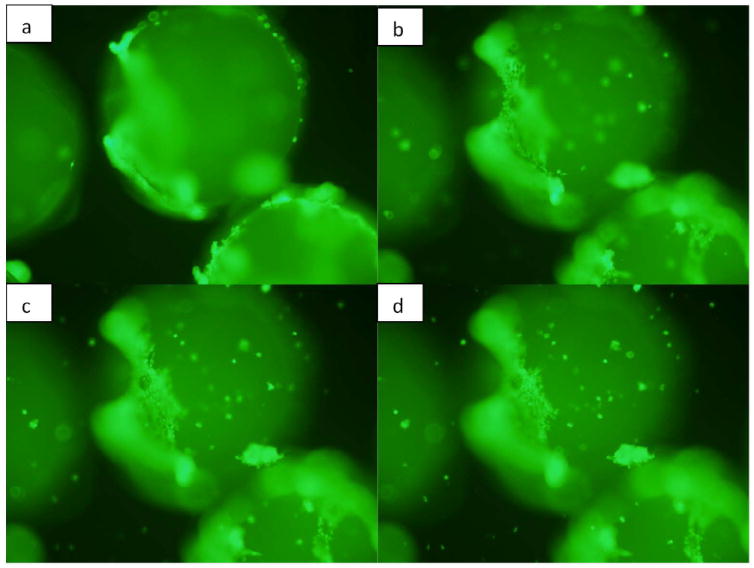
Live/dead fluorescence image of microparticles coated with BMP-7 seeded with murine osteoblasts on day 5. Microparticles are three dimensional and therefore, in order to capture all the cells attached throughout the surface of the particle, different views were considered starting from the periphery of the particle to its upper surface.
Fig 8.
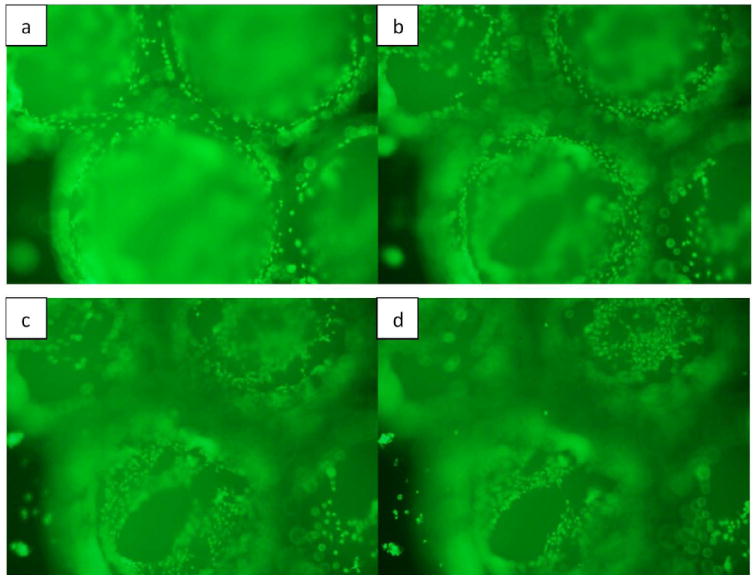
Live/dead fluorescence image of microparticles coated with BMP-7 seeded with osteoblasts on day 10. Microparticles are three dimensional and therefore in order to capture all the cells attached throughout the surface of the particle, different views were considered starting from the periphery of the particle to its upper surface (a-d).
Fig. 9.
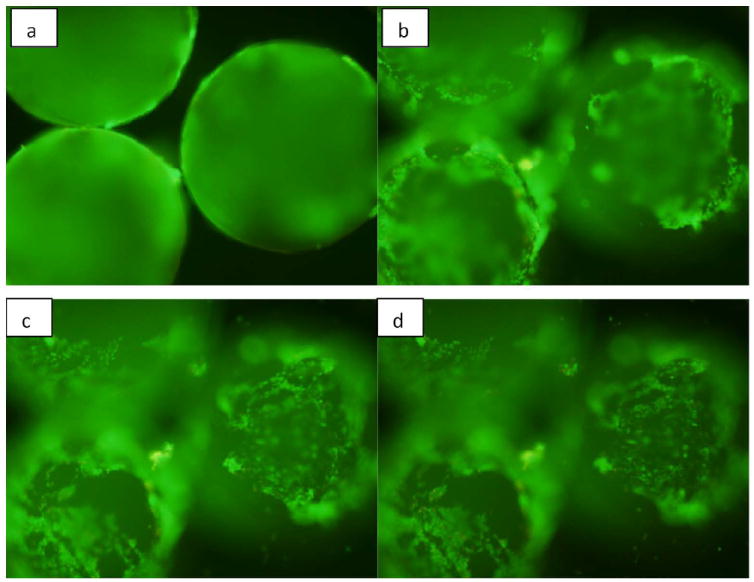
Live/dead fluorescence image of microparticles encapsulated with BMP-7 seeded with murine osteoblasts on day 10. Microparticles are three dimensional and therefore in order to capture all the cells attached throughout the surface of the particle, different views were considered starting from the periphery of the particle to its upper surface.
The significant difference in viable cell attachment to various particles was determined by considering the degree of cell spreading on the surface area of the microparticle as shown in Fig. 5. The graph takes into consideration only the cells attached to one of the hemisphere of the microparticle as the microscopy provided us with that part of the image only. Fig. 4 indicates that 56% of the hemisphere of the chitosan microparticle coated with BMP-7 is covered by osteoblasts which are in agreement with the SEM images. As expected, the BMP-7 presence influenced the cell attachment and specifically proliferation on the surface of the microparticle. The concentration of the bioactive BMP-7 available to the cell also influenced the spreading of the osteoblasts with higher concentration supporting greater degree of cell spreading. For instance, 56.2% of the osteoblasts attached to microparticles with BMP-7 coated, but only 40.4% of cells attached to BMP-7 encapsulated microparticles. The 56.2% account for an average of 4.33 × 105 μm2 of the surface area of the hemisphere, for BMP-7 encapsulated microparticles it accounts to 3.11 × 105 μm2, for microparticles without any growth factors it accounts for 1.02 × 105 μm2.
3.4 Quantification of DNA
Cell attachment and proliferation on the three dimensional surface of the microparticles was successfully demonstrated by DNA quantification experiment. The amount of DNA can be correlated to the number of cells, with direct proportionality between them. Fig. 10 shows the amount of DNA obtained from all the cells present in the well, which include the cells attached to the well plate and microparticles. The amount of DNA followed a similar trend, increasing with time in all the four samples. The results of DNA assay also show that the amount of DNA obtained from BMP-7 coated microparticles on day 5 and 10 was significantly different from all the other three samples (p<0.05).
Fig. 10.
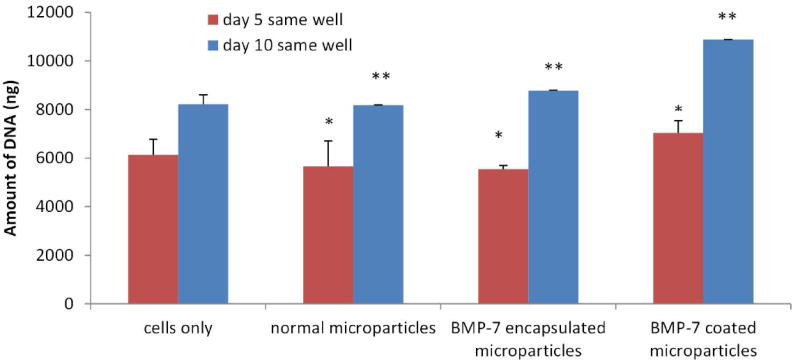
Amount of DNA obtained in the samples when the assay was performed in the well, the cells were cultured for the respective time periods. This data gives us information regarding the number of cells attached and proliferating on the surface of the well plate as well as on the surface of the microparticle, thus hinting us of the fact that the microparticles fabricated are biocompatible.
In another experiment, the microparticles were transferred to another well before performing the DNA assay. These experimental results will give us only the DNA amount corresponding to the cells attached to the surface of the microparticles. Fig. 11 shows that the amount of DNA increased as the time period increased indicating proliferation on the surface of the microparticles for all the three groups. This demonstrates the capability of the chitosan surface with and without growth factors to support OB-6 cell proliferation. The data also shows a significant increase (p<0.05) in the amount of DNA obtained from BMP-7 coated microparticles than that obtained from other two groups on day 5. However on day 10, a significant increase is observed in the amount of DNA obtained from BMP-7 encapsulated microparticles in comparison with normal microparticles without any growth factors (p<0.05) and a significant increase is observed in BMP-7 coated microparticles in comparison with BMP-7 encapsulated microparticles (p<0.001). This result confirms that bioactive BMP-7 being released from the microparticles improves cell proliferation.
Fig. 11.
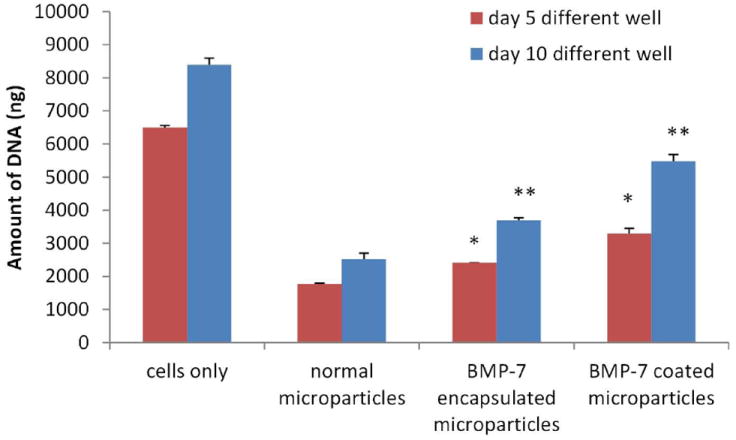
Amount of DNA obtained from the samples when the assay was done after transferring the microparticles to a different well on the respective time points. This data gives us an insight of the number of cells attached and proliferating on the surface of the microparticles only, thus proving that the surface of chitosan alone and with the growth factor helps osteoblasts proliferate.
3.5 Real time RT-PCR
Dlx5 gene
On day 5, a significant difference (p<0.001) is observed in the expression of Dlx5 expression when a pairwise comparison is done between all the four samples. mRNA levels were drastically up-regulated on day 5 for microparticles with BMP-7 encapsulated (8-fold) and BMP-7 coated microparticles (9-fold). On day 7, a significant difference (p<0.001) is observed between all the samples except for BMP-7 encapsulated and BMP-7 coated microparticles (p=0.292). Dlx5 expression levels for microparticles without growth factors remained at baseline levels for most of the time points. Fig. 12a shows that there is a significant increase in the expression of Dlx5 in BMP-7 coated and encapsulated microparticles in the early time points (day 5 and 7) when compared to microparticles without growth factors and cells only, which indicates effect of BMP-7 in inducing the expression of this gene. By day 10, the expression level in all the samples went down, and there was no significant difference (p=0.052) observed in the gene expression between cells adhered to BMP-7 encapsulated microparticles and cells adhered to the well plate.
Fig. 12.
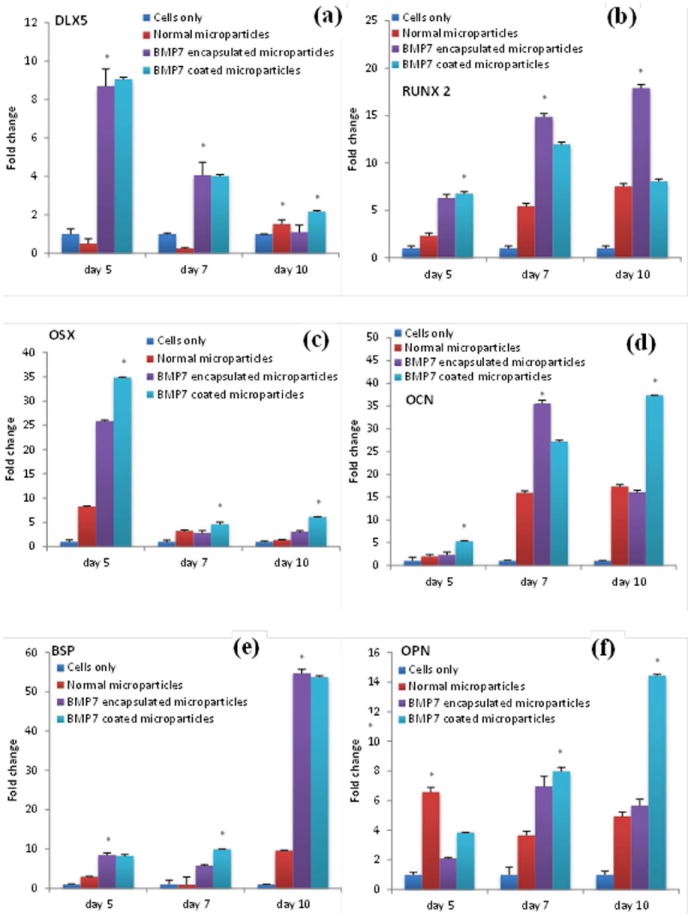
Fold change in the expression of the genes: a) dlx5, b) runx2, c) osx, d) OCN, e) BSP and f) OPN.
Runx2 gene
SPSS two way ANOVA pairwise comparison of the runx2 gene expression indicated that there is a significant difference (p<0.001) between all the four samples on day 5, 7 and 10. Posthoc Tukey’s HSD also indicates a significant difference (p<0.001) in the expression of the gene when pairwise comparison is done. The posthoc multiple comparison between the three time points also indicates a significant increase (p<0.001) in the gene expression on day 10 in comparison with day 7 and a significant increase (p<0.001) on day 7 in comparison with day 5 (Fig. 12b). A fold change of 7.5 in the runx 2 gene expression on day 10 for cells adhered to the microparticles in comparison with the cells adhered to the surface of the well plate indicates the influence of chitosan microparticles on differentiation of the pre-osteoblasts. A fold change of 17 was observed for cells adhered to BMP-7 encapsulated surface indicating differentiation of pre-osteoblasts to mature osteoblasts under the influence of BMP-7.
Osx gene
Osterix is another transcription factor necessary for osteoblast differentiation. SPSS two way ANOVA indicated a significant difference (p<0.001) in the expression of osx between all the samples when a pairwise analysis is conducted on day 5, 7, and 10. Posthoc Tukey’s HSD also indicates a significant difference (p<0.001) in all the samples. A posthoc Tukey’s HSD for the three time points also indicated a significant difference (p<0.05). From Fig. 12c we can observe a significant increase in the expression of osx expression level on day 5 for BMP-7 encapsulated (25-fold) and coated microparticles (34-fold). As indicated in Fig. 12c, on day 7 and 10, there is a decrease in the expression levels of osx for all the samples, but in comparison to cells only, there is almost 2-6 fold increase in its expression levels for all the types of microparticles.
OCN gene
Two-way ANOVA pairwise analysis indicated a significant difference (p<0.001) in the expression of OCN gene between all the samples on day 5, 7, and 10. There is also a significant difference (p<0.001) in the expression of the gene at the three different time points. A posthoc analysis confirms the significant difference (p<0.001) between the four samples at the three different time points. As shown in Fig. 12d, OCN showed very low levels of expression at the early time point (day 5), but with time its expression increased. For microparticles without growth factors, a maximum of 17-fold increase was observed by day 10. For BMP-7 coated and encapsulated microparticles, there is a significant increase in the expression of OCN, 27-fold and 35-fold respectively by day 7, indicating the influence of BMP-7 on OCN expression.
BSP gene
SPSS two-way pairwise ANOVA indicated a significant difference (p<0.001) in the expression of BSP gene between all the samples on day 5, 7, and 10. There is also a significant difference (p<0.001) observed in the expression when compared between the three time points. Fig. 12e shows that BSP mRNA levels were almost to the baseline on day 5 and 7. However, on day 10 there was a significant increase observed in the expression levels of BSP in microparticles without growth factors (9-fold), BMP-7 encapsulated microparticles (54-fold), and BMP-7 coated microparticles (53-fold).
OPN gene
OPN shows a trend similar to OCN, with the up-regulation of the gene with time. Two-way pairwise ANOVA analysis indicated a significant difference (p<0.001) in the expression of the gene between all the four samples on day 5, 7, and 10. Post hoc Tukey’s test indicated a significant difference (p<0.001) in the expression of genes in the different samples as well as a significant difference (p<0.001) at the three different time points. OPN mRNA levels were increased on day 7 in comparison with day 5 for BMP-7 encapsulated (7-fold) and BMP 7 coated microparticles (8-fold). Fig. 12f indicates a slight decrease in the expression levels for microparticles only from 6-fold on day 5 to 3.6-fold on day 7. There is a significant increase observed in mRNA levels of OPN for BMP 7 coated microparticles on day 10 in comparison with day 7.
3.6 Von kossa assay
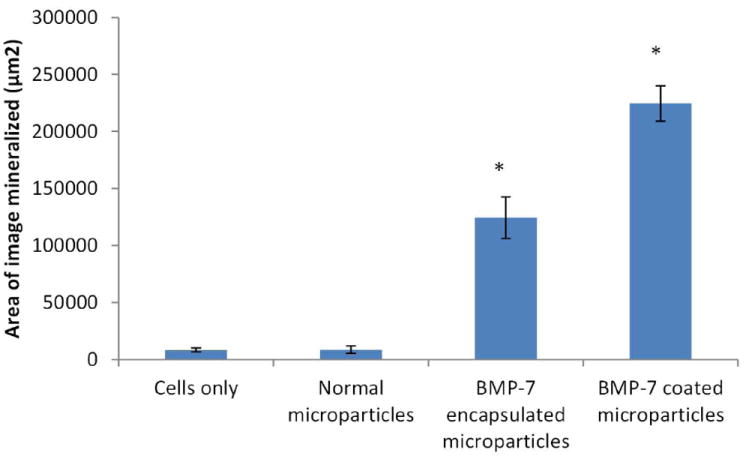
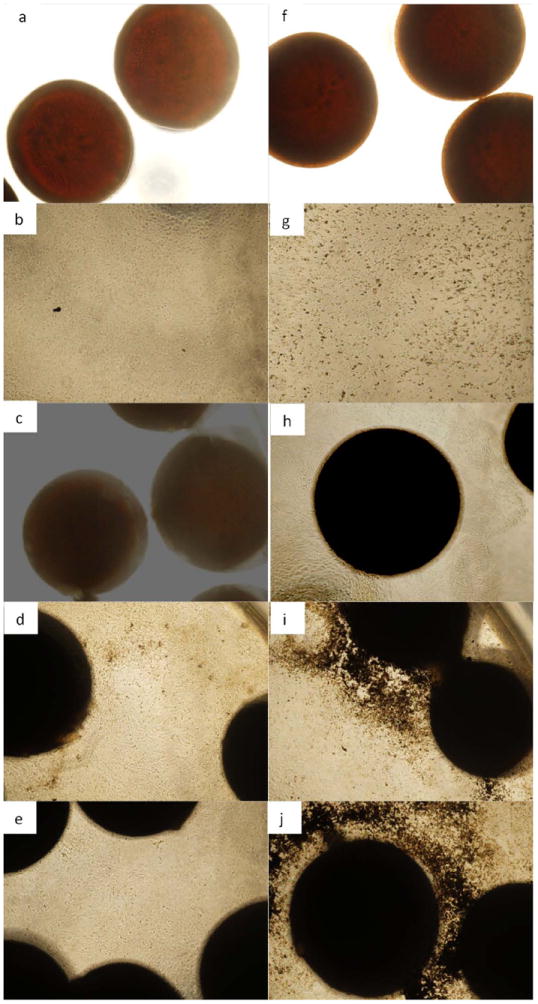
This procedure stains mineral deposits in black. On day 5, there is not much mineralization observed in either BMP 7 coated or encapsulated microparticles. However, by day 10 the assay shows increasing mineral deposition through the period of study both by BMP-7 encapsulated and BMP-7 coated microparticles, with substantial increase for BMP-7 coated microparticles (Fig. 14). The mineral deposit was mainly localized in the area adjacent to the microparticles. This indicates differentiating osteoblasts. Mineralization was quantified by calculating the area of mineralization per image. The average area occupied by the mineral deposits is shown in Fig. 13. One-way ANOVA was conducted using SPSS, and the analysis showed that there is a significant difference between the four different samples (p<0.001). Tukey’s post hoc multiple comparison analysis indicated that there is a significant difference (p<0.05) between cells grown in well plates without microparticles and BMP-7 encapsulated (p=0.017) and coated microparticles (p<0.001). A significant increase (p<0.05) in mineralization was observed in BMP-7 encapsulated microparticles in comparison with microparticles without any growth factors (p=0.017). There is also a significant difference (p<0.05) observed between BMP-7 encapsulated and BMP-7 coated microparticles (p=0.036). Though this assay does not take into consideration the three dimensional nature of the microparticles or the mineral deposits, it identifies the presence of mineralization and demonstrates increasing deposits with time and so the assay gives satisfactory results.
Fig. 14.
Von kossa assay images: left side column (a-e) representing day 5 and right side (f-j) column representing day 10 for cells only, microparticles only, microparticles only with cells, BMP-7 encapsulated microparticles and BMP-7 coated microparticles from top to bottom.
Fig. 13.
Area of the image occupied by the mineralized calcium deposits.
4. Discussion
This investigation of compatibility, conductivity, and inductivity of chitosan microparticles for pre-osteoblasts indicates that chitosan-TPP surface of the microparticle supports pre-osteoblast adhesion, proliferation, and differentiation [17-20] and bioactive BMP 7 is released from the microparticles [21].
This study indicates that chitosan-TPP microparticles and bioactive BMP-7 released from microparticles together contribute to the significant increase in the response from pre-osteoblasts. Incremental changes in cell proliferation were observed in BMP-7 coated and encapsulated microparticles in comparison with microparticles only on day 10 [22]. This result was confirmed by all the three tests – SEM analysis, live/dead cell assay and DNA assay and this can be attributed to the surface morphology of the microparticles and release of biologically active growth factor [23,24,25].
These microparticles were added to water to check the change in pH and it was found to be always in the range of 7.4-7.5, thus assuring that the osteoblasts are not affected in our experimental system. Moreover, chitosan is a polymer possessing osteoconductive characteristic [26,27], as shown in previous studies where its polymerization with TPP ameliorated cell adhesion [28]. Cells attached on the surface of the microparticle can be explained from the fact that osteoblasts are polarized. In the sense that part of the cell membrane in direct contact with the surface possesses many cytoplasmic processes that extend onto the surface. On day 5 cells appeared elongated which suggests dividing cells. Previous studies suggested that pre-osteoblasts and premature osteoblasts that have the capability to actively divide [29]. Mature osteoblasts are found to attain more of the cuboidal morphology and are directly in contact with the surface [30], which is clearly seen in the SEM images on day 10 results for all the samples. The osteoblasts also elicited a distinct response to microparticles with and without BMP-7. This indicates the potential of chitosan-TPP microparticles to support cell adhesion and viable cell proliferation and the presence of BMP-7 further adds to the benefit of the cells [31,32]. The difference observed between BMP-7 encapsulated and coated microparticles can be attributed to the effect of concentration of BMP-7 on cell growth. Studies have shown that increased concentration of BMP-7 lead to increased cell proliferation [22].
Osteoblast-specific gene expression study also revealed the influence of chitosan-TPP microparticles and BMP-7 on osteoblasts. Murine pre-osteoblasts that were differentiated into osteoblastic lineage were evaluated with respect to the effect of the microparticles itself as well as the combination of microparticles and BMP-7. The effect of chitosan-TPP microparticles itself is revealed distinctly in the expression of Runx2 (7.5-fold), OCN (17.3-fold), OPN (6.6-fold), and BSP (9.6-fold). This observation explains the influence of the microparticle surface morphology and chemistry on osteoblast differentiation and mineralization. Previous studies have also demonstrated its beneficial effect on osteoblast differentiation in vitro and in vivo [33-35]. Additional influence of BMP-7 on pre-osteoblast differentiation was observed in the expression of runx2 (17-fold), dlx5 (14-fold), osx (25-fold), OCN (36-fold), and BSP (55-fold). BMP-7 signaling is known to regulate processes in bone formation. Runx2 and osx are needed for osteoblast differentiation and also plays an important role in proper function of mature osteoblasts, including the synthesis of bone matrix [36]. Expression levels are low in undifferentiated mesenchymal cells. BMP 7 induces Runx 2 and osx expression in mesenchymal progenitor cells which induces osteoblastic differentiation [37]. Runx2 is not a direct target of BMP signaling, Dlx5 is activated by BMPs, which in turn induce expression of Runx2 in osteoprogenitor cells [38,39].
A significant increase in mineralization was also found in BMP-7 encapsulated and coated microparticles, which can be attributed to significant increase in the expression of OCN, OPN, and BSP in these samples. These genes are usually regarded as late markers for osteoblast differentiation and play an important role in hard tissue regeneration [40-43].
Natural polymers are being considered as an effective alternative for bone tissue engineering mainly due to their biocompatibility, biodegradability, osteoinductive and osteoconductive properties [44]. From the present study, it can be concluded that chitosan microparticles prepared by coacervation method are ideal osteoconductive materials by itself and the BMP-7 being released from the microparticles retains its bioactivity and adds the osteoinductive functionality to the microparticles. The microparticles surface with growth factor aided in greater osteoblast proliferation and differentiation by increasing osteoblast specific gene expression, thereby proving its effectiveness in vitro as a bone substitute material. The present data however lacks in vivo data, which is a completely different scenario and will eventually prove the osseointegration capability of the scaffold.
Conclusion
An improved response of pre-osteoblasts was observed due to the chitosan-TPP microparticles and BMP-7 released from these microparticles. Significant increase in cell attachment and proliferation was observed on the surface of the microparticles with BMP-7 indicating the influence of BMP-7. Differentiation of the pre-osteoblasts to osteoblasts was demonstrated by the significant up-regulation in the expression of transcription factors – runx 2 and osx as well as late osteoblast markers – OCN, OPN, and BSP, which lead to increased mineralization. Therefore, it is postulated that in vivo, these materials may be able to act as a better and more reliable bone substitute material thus improving osseointegration response.
Acknowledgments
We would like to thank National Institute of Health (NIH) grant numbers R03DE019508 and R01DE023356, and National Science Foundation (NSF) grant number 0652024 for providing financial support to accomplish this work.
References
- 1.Francis SJ, Matthew H. Application of chitosan-based polysaccharide biomaterials in cartilage tissue engineering: a review. Biomaterials. 2000;21:2589–2598. doi: 10.1016/s0142-9612(00)00126-5. [DOI] [PubMed] [Google Scholar]
- 2.Ueno H, Mori T, Fujinaga T. Topical formulations and wound healing applications of chitosan. Adv Drug Delivery Rev. 2001;52:105–115. doi: 10.1016/s0169-409x(01)00189-2. [DOI] [PubMed] [Google Scholar]
- 3.Jayakumar R, Menon D, Manzoor K, Nair SV, Tamura H. Biomedical applications of chitin and chitosan based nanomaterials—A short review. Carbohydr Polym. 2010;82:227–232. [Google Scholar]
- 4.Kim IY, Seo SJ, Moon HS, Yoo MK, Park IY, Kim BC, Cho CS. Chitosan and its derivatives for tissue engineering applications. Biotechnol Adv. 2008;26:1–21. doi: 10.1016/j.biotechadv.2007.07.009. [DOI] [PubMed] [Google Scholar]
- 5.Peter M, Ganesh NSN, Nair SV, Furuike T, Tamura H, Jayakumar R. Preparation and characterization of chitosan-gelatin/nanohydroxyapatite composite scaffolds for tissue engineering applications. Carbohydr Polym. 2010;80:687–694. [Google Scholar]
- 6.Lee JY, Nam SH, Im SY, Park YJ, Lee YM, Seol YJ, et al. Enhanced bone formation by controlled growth factor delivery from chitosan-based biomaterials. J Cont Rel. 2002;78:187–197. doi: 10.1016/s0168-3659(01)00498-9. [DOI] [PubMed] [Google Scholar]
- 7.Lavery K, Swain P, Falb D, Alaoui-Ismaili MH. BMP-2/4 and BMP-6/7 differentially utilize cell surface receptors to induce osteoblastic differentiation of human bone marrow-derived mesenchymal stem cells. J Biol Chem. 2008;283:20948–20958. doi: 10.1074/jbc.M800850200. [DOI] [PMC free article] [PubMed] [Google Scholar]
- 8.Ziegler J, Anger D, Krummenauer F, Breitig D, Fickert S, Guenther KP. Biological activity of recombinant human growth factors released from biocompatible bone implants. J Biomed Mater Res. 2008;86A:89–97. doi: 10.1002/jbm.a.31625. [DOI] [PubMed] [Google Scholar]
- 9.Lee SH, Shin H. Matrices and scaffolds for delivery of bioactive molecules in bone and cartilage tissue engineering. Adv Drug Deliv Rev. 2007;59:339–359. doi: 10.1016/j.addr.2007.03.016. [DOI] [PubMed] [Google Scholar]
- 10.Bessa PC, Casal M, Reis RL. Bone morphogenetic proteins in tissue engineering: the road from the laboratory to the clinic, part I (basic concepts) J Tissue Eng Regen Med. 2008;2:1–13. doi: 10.1002/term.63. [DOI] [PubMed] [Google Scholar]
- 11.White AP, Vaccaro AR, Hall JA, Whang PG, Friel BC, McKee MD. Clinical applications of BMP-7/OP-1 in fractures, non-unions and spinal fusion. Int Orthop. 2007;31:735–741. doi: 10.1007/s00264-007-0422-x. [DOI] [PMC free article] [PubMed] [Google Scholar]
- 12.Seeherman H, Wozney JM. Delivery of bone morphogenetic proteins for orthopedic tissue regeneration. Cytokine Growth Factor Rev. 2005;16:329–345. doi: 10.1016/j.cytogfr.2005.05.001. [DOI] [PubMed] [Google Scholar]
- 13.Woo BH, Fink BF, Page R, Schrier JA, Jo YW, Jiang G, DeLuca M, Vasconez HC, DeLuca PP. Enhancement of bone growth by sustained delivery of recombinant human bone morphogenetic protein-2 in a polymeric matrix. Pharm Res. 2001;18:1747–1753. doi: 10.1023/a:1013382832091. [DOI] [PubMed] [Google Scholar]
- 14.Ebara S, Nakayama K. Mechanism for the action of bone morphogenetic proteins and regulation of their activity. Spine. 2002;27(Suppl):s10–s15. doi: 10.1097/00007632-200208151-00004. [DOI] [PubMed] [Google Scholar]
- 15.Zeigler J, Anger D, Krummenauer F, Breitig D, Fickert S, Guenther KP. Biological activity of recombinant human growth factors released from biocompatible bone implants. J Biomed Res Part A. 2008;86:89–97. doi: 10.1002/jbm.a.31625. [DOI] [PubMed] [Google Scholar]
- 16.Wang M, Feng Q, Guo X, She Z, Tan R. A dual microsphere based on PLGA and chitosan for delivering the oligopeptide derived from BMP-2. Poly Deg Stab. 2011;96:107–113. [Google Scholar]
- 17.Langer R, Tirrell DA. Designing materials for biology and medicine. Nature. 2004;428:487–492. doi: 10.1038/nature02388. [DOI] [PubMed] [Google Scholar]
- 18.Hollister SJ, Maddox RD, Taboas JM. Optimal design and fabrication of scaffolds to mimic tissue properties and satisfy biological constraints. Biomaterials. 2002;23:4095. doi: 10.1016/s0142-9612(02)00148-5. [DOI] [PubMed] [Google Scholar]
- 19.Dalby MJ, McCloy D, Robertson M, Wilkinson CD, Oreffo RO. Osteoprogenitor response to defined topographies with nanoscale depths. Biomaterials. 2006;27:1306–1315. doi: 10.1016/j.biomaterials.2005.08.028. [DOI] [PubMed] [Google Scholar]
- 20.Baxter LC, Textor FM, Gwynn A, Richards RG. Fibroblasts and osteoblast adhesion and morphology on calcium phosphate surfaces. Eur Cell Mat. 2002;4:1–17. doi: 10.22203/ecm.v004a01. [DOI] [PubMed] [Google Scholar]
- 21.Human BMP 7/OP1 induces the growth and differentiation of adipocytes and osteoblasts in bone marrow stromal cell cultures. doi: 10.1002/jcb.1145. [DOI] [PubMed] [Google Scholar]
- 22.Yilqor P, Tuzlakoglu K, Reis RL, Hasirci N, Hasirci V. Incorporation of a sequential BMP2/BMP7 delivery system into chitosan based scaffolds for bone tissue engineering, clinical applications of BMP-7/OP1 in fractures, nonunion and spinal fusion. Biomaterials. 2009;30:3551–3559. doi: 10.1016/j.biomaterials.2009.03.024. [DOI] [PubMed] [Google Scholar]
- 23.Dunn GA, Brown AF. Alignment of fibroblasts on grooved surfaces described by a simple geometric transformation. J Cell Sci. 1986;83:313–340. doi: 10.1242/jcs.83.1.313. [DOI] [PubMed] [Google Scholar]
- 24.Stevens B, Yang Y, Mohandas A, Stucker B, Nguyen KT. A review of materials, fabrication methods, and strategies used to enhance bone regeneration in engineered bone tissues. J Biomed Mater Res B Appl Biomater. 2008;85B:573–582. doi: 10.1002/jbm.b.30962. [DOI] [PubMed] [Google Scholar]
- 25.Hayes JS, Khan IM, Archer CW, Richards RG. The role of surface microtopography in the modulation of osteoblast differentiation. Eur Cells Mat. 2010;20:98–108. doi: 10.22203/ecm.v020a09. [DOI] [PubMed] [Google Scholar]
- 26.Moutzouri AG, Athanassiou GM. Attachment, spreading and adhesion strength of human bone marrow cells on chitosan. Ann Biomed Eng. 2011;39:730–741. doi: 10.1007/s10439-010-0188-y. [DOI] [PubMed] [Google Scholar]
- 27.Di Martino A, Sittinger M, Risbud MV. Chitosan: A versatile polymer for orthopedic tissue engineering. Biomaterials. 2005;26:5983–5990. doi: 10.1016/j.biomaterials.2005.03.016. [DOI] [PubMed] [Google Scholar]
- 28.Long F. Building strong bones: molecular regulation of the osteoblast lineage. Nat Rev Mol Cell Biol. 2011;13:27–38. doi: 10.1038/nrm3254. [DOI] [PubMed] [Google Scholar]
- 29.Dudley HR, Spiro D. The fine structure of bone cells. J Biophys Biochem Cytol. 1961;11:627–649. doi: 10.1083/jcb.11.3.627. [DOI] [PMC free article] [PubMed] [Google Scholar]
- 30.Owen M. Cell population kinetics of an osteogenic tissue. I J Cell Biol. 1963;19:19–32. doi: 10.1083/jcb.19.1.19. [DOI] [PMC free article] [PubMed] [Google Scholar]
- 31.Burdick JA, Anseth KS. Photoencapsulation of osteoblasts in injectable RGD-modified PEG hydrogels for bone tissue engineering. Biomat. 2002;23:4315–4323. doi: 10.1016/s0142-9612(02)00176-x. [DOI] [PubMed] [Google Scholar]
- 32.Chen TL, Shen WJ, Kraemer FB. Human BMP-7/OP-1 Induces the Growth and Differentiation of Adipocytes and Osteoblasts in Bone Marrow Stromal Cell Cultures. J Cell Biochem. 2001;82:187–199. doi: 10.1002/jcb.1145. [DOI] [PubMed] [Google Scholar]
- 33.Mendonça G, Mendonça DB, Aragão FJ, Cooper LF. Advancing dental implant surface technology – from micron- to nanotopography. Biomaterials. 2008;29:3822–3835. doi: 10.1016/j.biomaterials.2008.05.012. [DOI] [PubMed] [Google Scholar]
- 34.Isa ZM, Schneider GB, Zaharias R, Seabold D, Stanford CM. Effects of fluoride modified titanium surfaces on osteoblast proliferation and gene expression. Int J Oral Maxillofac Implants. 2006;21:203–211. [PubMed] [Google Scholar]
- 35.Guo J, Padilla RJ, Ambrose W, De Kok IJ, Cooper LF. Modification of TiO2 grit blasted titanium implants by hydrofluoric acid treatment alters adherent osteoblast gene expression in vitro and in vivo. Biomaterials. 2007;28:5418–5425. doi: 10.1016/j.biomaterials.2007.08.032. [DOI] [PubMed] [Google Scholar]
- 36.Ducy P, Starbuck M, Priemel M, Shen J, Pinero G, Geoffroy V, Amling M, Karsenty G. A Cbfa1-dependent genetic pathway controls bone formation beyond embryonic development. Genes Dev. 1999;13:1025–1036. doi: 10.1101/gad.13.8.1025. [DOI] [PMC free article] [PubMed] [Google Scholar]
- 37.Zhou X, Zhang Z, Feng JQ, Dusevich VM, Sinha K, Zhang H, Darnay BG, de Crombrugghe B. Multiple functions of Osterix are required for bone growth and homeostasis in postnatal mice. Proc Natl Acad Sci. 2010;107:12919–12924. doi: 10.1073/pnas.0912855107. [DOI] [PMC free article] [PubMed] [Google Scholar]
- 38.Lee MH, Kim YJ, Yoon WJ, Kim JI, Kim BG, Hwang YS, Wozney JM, Chi XZ, Bae SC, Choi KY, Cho JY, Choi JY, Ryoo HM. Dlx5 specifically regulates Runx2 type II expression by binding to homeodomain-response elements in the Runx2 distal promoter. J Biol Chem. 2005;280:35579–35587. doi: 10.1074/jbc.M502267200. [DOI] [PubMed] [Google Scholar]
- 39.Robledo RF, Rajan L, Li X, Lufkin T. The Dlx5 and Dlx6 homeobox genes are essential for craniofacial, axial, and appendicular skeletal development. Genes Dev. 2002;16:1089–1101. doi: 10.1101/gad.988402. [DOI] [PMC free article] [PubMed] [Google Scholar]
- 40.Viereck V, Siggelkow H, Tauber S, Raddatz D, Schutze N, Hufner M. Differential regulation of Cbfa1/Runx2 and osteocalcin gene expression by vitamin-D3, dexamethasone, and local growth factors in primary human osteoblasts. J Cell Biochem. 2002;86:348–356. doi: 10.1002/jcb.10220. [DOI] [PubMed] [Google Scholar]
- 41.Bessa PC, Casal M, Reis RL. Bone morphogenetic proteins in tissue engineering: the road from the laboratory to the clinic, part I (basic concepts) J Tissue Eng Regen Med. 2008;2:1–13. doi: 10.1002/term.63. [DOI] [PubMed] [Google Scholar]
- 42.Payne RG, Yaszemski MJ, Yasko AW, Mikos AG. Development of an injectable, in situ crosslinkable, degradable polymeric carrier for osteogenic cell populations. Part 1. Encapsulation of marrow stromal osteoblasts in surface crosslinked gelatin microparticles. Biomat. 2002;23:4359–4371. doi: 10.1016/s0142-9612(02)00184-9. [DOI] [PubMed] [Google Scholar]
- 43.Lian JB, Stein GS. The developmental stages of osteoblast growth and differentiation exhibit selective responses of genes to growth factors (TGFb1) and hormones (Vitamin D and Glucocorticoids) J Oral Implant. 1993;19:95–105. [PubMed] [Google Scholar]
- 44.Mantripragada VP, Lecka-Czernik B, Ebraheim NA, Jayasuriya AC. An overview of recent advances in designing orthopedic and craniofacial implants. J Biomed Mater Res A. 2013;101:3349–3364. doi: 10.1002/jbm.a.34605. [DOI] [PMC free article] [PubMed] [Google Scholar]


