

Abstract
The most common subtype of pancreatic cancer is pancreatic ductal adenocarcinoma (PDAC). pDac resembles duct cells morphologically and, to some extent, at a molecular level. recently, genetic-lineage labeling has become popular in the field of tumor biology in order to study cell-fate decisions or to trace cancer cells in the mouse. However, certain biological questions require a nongenetic labeling approach to purify a distinct cell population in the pancreas. Here we describe a protocol for isolating mouse pancreatic ductal epithelial cells and duct-like cells directly in vivo using ductal-specific Dolichos biflorus agglutinin (DBA) lectin labeling followed by magnetic bead separation. Isolated cells can be cultured (in two or three dimensions), manipulated by lentiviral transduction to modulate gene expression and directly used for molecular studies. this approach is fast (∼4 h), affordable, results in cells with high viability, can be performed on the bench and is applicable to virtually all genetic and nongenetic disease models of the pancreas.
Introduction
The pancreas has exocrine and endocrine compartments. The endocrine compartment has four cell types (alpha, beta, delta and PP), and there is a well-delineated transcriptional program that regulates the initiation and maintenance of the endocrine compartment. The exocrine compartment comprises acinar cells, which are responsible for the synthesis, storage and secretion of digestive enzymes, and ductal cells, which are intertwined within a network to facilitate the transport of these digestive enzymes. The centroacinar compartment represents the cellular link between acinar and ductal cells.
In the context of the pancreas, the vast majority of in vivo studies take advantage of the Pdx1-Cre or Ptf1a-Cre mouse lines, respectively1,2. Both promoters are expressed early in pancreatic organogenesis, resulting in little or no lineage specificity within the gland3. Less-studied Cre lines that target the exocrine compartment in an inducible manner include the ElaCreERT2 (acinar lineage) and Hnf1CreERT2 lines (ductal lineage)4,5. Interrogation of fundamental processes in the pancreas has been advanced through genetically based lineage labeling, thereby providing insights into pancreatic development of exocrine and endocrine lineages, as well as representing an important tool in cancer biology using the Cre/loxP system6. Lineage labeling permits the permanent labeling of a cell or cell type, as well as any progeny cells, thereby permitting one to ‘track’ their fate under homeostatic or pathologic conditions.
It is nonetheless crucial to evaluate the biological and functional properties of the endocrine, acinar and ductal cell types, as their individual characteristics determine their heterogeneous organization and interaction. Here we describe how to purify and characterize pancreatic ductal cells (PDCs) and duct-like cells, as well as how to perform various experimental applications. Compared with established duct cell isolation techniques7–11, the major advantage of our approach is that duct cells can be purified directly in vivo without requiring an additional culturing step. In addition, we are able to validate this technique in conditions such as embryonic development, inflammation and regeneration, as well as oncogene-driven carcinogenesis. Hence, our protocol is able to capture immediate characteristics of duct or duct-like populations of defined biological conditions12.
Experimental Design
The following protocol provides step-by-step instructions for isolating PDCs from physiological conditions, such as from the normal adult or the developing pancreas, from pathological states such as inflammation (e.g., cerulein-induced pancreatitis), as well as mouse models of pancreatic ductal adenocarcinoma (PDAC) (Pdx1cre;KrasG12D/+;p53R172H/+). Our technology uses DBA lectin, a glycoprotein that labels the entire pancreatic ductal tree, including centroacinar cells and duct-like states (e.g., acinar-ductal metaplasia or ADM, as well as pancreatic intraepithelial neoplasia or PanIN) (Fig. 1)12,13, in combination with separation by magnetic beads. The procedure takes ∼4 h; however, several mice can be processed in parallel. DBA lectin–separated ductal cells or PDCs that have been maintained in culture can be subjected to several culture conditions/assays to address different functional properties. Ductal cells can be maintained (see Step 15A) and manipulated (see Step 16B) on top of a collagen matrix (referred to as 2D) or within a collagen matrix (referred to as 3D) to investigate cellular polarization and epithelial branching morphogenesis (see Step 16A). Furthermore, ductal cells can be cultured in suspension to address self-renewal and differentiation characteristics. For the latter, we refer to Wang et al.14. Finally, PDCs that have been isolated from genetically engineered mouse models of PDAC can be evaluated for specific properties, e.g., FACS-based analysis of cell surface markers associated with cancer-initiating capabilities (see Step 16C)15–17 (Fig. 2).
Figure 1.

DBA lectin distribution in the normal pancreas and disease. (a) Immunofluorescence of DBA lectin-positive (green) structures in a normal adult pancreas. (b,c) Acute cerulein-induced pancreatitis (day 3) (b) and Kras-driven neoplasia (Pdx1cre;KrasG12D/+, 20 weeks) (c). DAPI is shown in blue. Scale bar, 50 μm. (d) Gene expression profile of Pdx1-cre (control) and Pdx1cre; KrasG12D/+ (10 and 20 weeks of age) compared with human PanIN1B lesions isolated by laser-capture microdissection. Reproduced with permission from ref. 12.
Figure 2.

Illustration of the possible workflows and respective protocol sections.
Materials
Reagents
DBA lectin sorting from adult and embryonic mouse pancreas
Mouse pancreas ! CAUTION Experiments involving live rodents must conform to all relevant governmental and institutional regulations.
BSA (Sigma-Aldrich, cat. no. A7906)
Anti-FITC MicroBeads, 2 ml (Miltenyi Biotec, cat. no. 130-048-701)
Bioanalyzer 2100 (Agilent, cat. no. G2938C)
Cell strainer, 40 μm (BD Falcon, cat. no. 352340)
Collagenase type V (Sigma-Aldrich, cat. no. C9263)
DBA lectin–FITC (Vector Labs, cat. no. FL-1031)
DMEM/F12 (Gibco, Invitrogen, cat. no. 11330-032)
EDTA ultrapure, 0.5 M, pH 8.0 (Invitrogen, Life Technologies, cat. no. 15575-038)
Fungizone antimycotic, liquid (Gibco, Life Technologies, cat. no. 15290-026)
Hank's balanced salt solution (HBSS; Gibco, Invitrogen, cat. no. 14175-049)
MACS separation columns, 25 MS columns (Miltenyi Biotec, cat. no. 130-042-201)
PBS, 1× (Gibco, Life Technologies, cat. no. 14190-136)
Penicillin-streptomycin (Gibco, Invitrogen, cat. no. 150140-122)
RNAqueous-Micro kit (Ambion, cat. no. AM1931)
Soybean trypsin inhibitor (Sigma-Aldrich, cat. no. T6522)
Trypsin-EDTA, 0.05% (wt/vol) (Gibco, Invitrogen, cat. no. 25300-054)
Culturing PDCs in a monolayer (2D)
Bovine pituitary extract (BD Biosciences, cat. no. 354123; can also use No-Worries bovine pituitary extract, Gemini Bioproducts, cat. no. 500-102)
Cholera toxin (Sigma-Aldrich, cat. no. C8052) ! CAUTION Cholera toxin is a highly toxic reagent. Direct skin or eye contact as well as inhalation or ingestion must be avoided.
Collagenase type V (Sigma-Aldrich, cat. no. C9263)
Collagen rat tail type I (BD Biosciences, cat. no. 354236)
Dexamethasone (Sigma-Aldrich, cat. no. D1756)
D-Glucose (Sigma-Aldrich, cat. no. G5400)
DMEM/F12 (Gibco, Invitrogen, cat. no. 11330-032)
Epidermal growth factor (BD Biosciences, cat. no. 354001)
Fungizone antimycotic, liquid (Gibco, Life Technologies, cat. no. 15290-026)
ITS+ (insulin/human transferring/selenous acid and linoleic acid) premix (BD Biosciences, cat. no. 354352)
Nicotinamide (Sigma-Aldrich, cat. no. N3376)
Nu-Serum IV (BD Biosciences, cat. no. 355104)
Penicillin-streptomycin (Gibco, Invitrogen, cat. no. 150140-122)
PBS, 1× (Gibco, Life Technologies, cat. no. 14190-136)
Soybean trypsin inhibitor (Sigma-Aldrich, cat. no. T6522)
Trypsin-EDTA, 0.05% (wt/vol) (Gibco, Invitrogen, cat. no. 25300-054)
Culturing PDCs in 3D
Bovine collagen solution type I, Nutragen, 6 mg ml−1, 50 ml (Advanced BioMatrix, cat. no. 5010-D)
L-Glutamine, 29.2 mg ml−1, 200 mM solution, 100× (Gibco, cat. no. 25030)
Sodium bicarbonate (NaHCO3, 7.5% (wt/vol) solution; Gibco, cat. no. 25080)
Minimum essential medium, without glutamine (MEM, 10×; Invitrogen, cat. no. 11430030)
HEPES, 1 M, pH 7.6 (Sigma-Aldrich, cat. no. H0887)
Sterile ddH2O
Immunofluorescence staining of 3D spheroid cysts
The following antibodies have been successfully tested: PDX1 (dilution 1:250, Santa Cruz Biotechnology, cat. no. sc-14664), fuorescein phalloidin (dilution 1:600, Invitrogen, cat. no. F432), E-cadherin (dilution 1:1,000, BD Biosciences, cat. no. 61018), p120 catenin (dilution 1:1,000, BD Biosciences, cat. no. 610134)
Collagenase I (Sigma-Aldrich, cat. no. 2799)
DAPI (Invitrogen, cat. no. 1306)
Dulbecco's PBS with CaCl2 and MgCl2 (PBS+) (Invitrogen, cat. no. 14040)
Alternative: PBS+ can be made in-house using the following: regular PBS (Invitrogen, cat. no. 10010-031) with CaCl2 and MgCl2; calcium chloride (Sigma-Aldrich, cat. no. C1016); and magnesium chloride (Sigma-Aldrich, cat. no. M8266)
Fluorescent mounting medium (Kirkegaard and Perry Laboratories (KPL), cat. no. 71-00-16)
Gelatin from cold-water fish skin (Sigma-Aldrich, cat. no. G7765)
Paraformaldehyde (PFA) (Fisher, cat. no. 04042)
PBS, 10× (Gibco, Life Technologies, cat. no. 14200-075)
Triton X-100 (Fisher, cat. no. BP151)
Lentiviral transduction
PDCs
LV-Cre-SD (Addgene, plasmid 12105)
LV-LacZ (Addgene, plasmid 12108)
shRNA (Open Biosystems)
Polybrene, 10 mg ml−1 (EMD Millipore, cat. no. TR-1003-G)
Puromycin (Sigma-Aldrich, cat. no. P8833)
PDC full medium (see Step 15A)
Doxycycline (Sigma-Aldrich, cat. no. D9891)
PBS, 1× (Gibco, Life Technologies, cat. no. 14190-136)
Penicillin-streptomycin (Gibco, Invitrogen, cat. no. 150140-122)
Soybean trypsin inhibitor (Sigma-Aldrich, cat. no. T6522)
Trypsin-EDTA, 0.05% (wt/vol) (Gibco, Invitrogen, cat. no. 25300-054)
Identifying potential cancer-initiating cells
Antibodies: PE/Cy7 anti-mouse CD24, 100 μg, 0.2 mg ml−1 (BioLegend, cat. no. 101822); APC rat anti-mouse CD44, 100 μg, 0.2 mg ml−1 (BD Bioscience, cat. no. 559250); APC anti-mouse Prominin-1 (CD133), 0.1 mg ml−1 (Miltenyi Biotec, cat. no. 130-092-335); APC anti-mouse CD326 (EpCAM), 0.2 mg ml−1 (eBioscience, cat. no. 17-5791))
BSA (Sigma-Aldrich, cat. no. A7906)
HBSS (Invitrogen, cat. no. 14175-079)
PBS, 1× (Gibco, Life Technologies, cat. no. 14190-136)
Propidium iodide (PI), 1 mg ml−1 (Molecular Probes, cat. no. P3566)
Equipment
DBA lectin sorting from adult and embryonic mouse pancreas
MiniMACS separation unit (Miltenyi Biotec, cat. no. 130-042-102)
Stirrer, immersible Im75 W/rc (Fisher Scientifc, cat. no. 11-497-5)
Conical tubes, 50 ml (Greiner Bio-One, cat. no. 210270)
Media storage bottle with screw cap, 100 ml (Pyrex, cat. no. 1395-100)
Culturing PDCs in a monolayer (2D)
Six-well clear TC-treated multiple-well plate (Costar, cat. no. 3516)
Tissue culture treated, 100 × 20 mm dishes (Thermo Scientifc, cat. no. 130182)
Cell lifter, 10 cm (BioExpress, cat. no. T-2444-4)
Tissue culture incubator
Culturing PDCs in 3D
Four-well-chamber slides: Permanox plastic chamber slide system, four-well (Nunc 177437; Thermo Fisher Scientifc, cat. no. 12-565-21)
Immunofluorescence staining of 3D spheroid cysts
Inverted laser-scanning confocal microscope (LSM 410-equipped Axiovert 135, Carl Zeiss)
LSM Image Examiner version 2.8 software (Carl Zeiss)
LSM version 3.98 (Carl Zeiss)
Vacuum filter/storage bottle system, 500 ml, 0.45-μm pore, 33.2 cm2 CA membrane (Corning, cat no. 430770)
Lentiviral transduction
Six-well plate (Corning Costar, cat. no. 3516)
Centrifuge (Sorvall Legend RT+, Thermo Scientifc, cat. no. 75-004-377)
Centrifuge buckets (Thermo Scientifc, cat. no. 75006449P)
Foil (FisherBrand, cat. no. 15-61)
Identifying potential cancer-initiating cells
Polystyrene round-bottom tube with cell-strainer cap, 5 ml (BD Falcon, cat. no. 352235)
Stericup-GP filter unit 1,000 ml, 0.22-μm, Millipore Express PLUS membrane (Millipore, cat. no. SCGPU11RE)
FACSCalibur flow cytometer (BD Biosciences)
Reagent Setup
G solution for DBA lectin sorting from adult and embryonic mouse pancreas
Mix 1 liter of HBSS, 0.9 grams per liter of glucose and 47.6 μM CaCl2 (add 0.4 ml of 0.119 M CaCl2 to 1 liter of HBSS). G solution can be stored for several weeks at 4 °C.
Separation buffer for DBA lectin sorting from adult and embryonic mouse pancreas
The separation buffer contains PBS, pH 7.2, 0.5% (wt/vol) BSA and 2 mM EDTA. ▲ CRITICAL Freshly prepare the separation buffer each time.
PDC full medium for culturing cells in 2D or 3D
Prepare the medium as tabulated. PDC full medium should be used within 3 weeks when it is stored at 4 °C.
|
| ||
| Amount/volume | Reagent | Final concentration |
|
| ||
| 500 ml | DMEM/F12 | — |
| 25 ml | Nu-Serum IV | 5% |
| 5 ml | Penicillin-streptomycin | 1% |
| 4.2 ml | Bovine pituitary extract 3 mg ml−1 | 25 μg ml−1 |
| 2.5 ml | ITS+ premix | — |
| 100 μl | Epidermal growth factor 100 μg ml−1 | 20 ng ml−1 |
| 50 μl | Cholera toxin 1 mg ml−1 | 100 ng ml−1 |
| 50 μl | 3,3,5-Triiodo-L-thyronine, 50 μM | 5 nM |
| 5 μl | Dexamethasone | 1 μM |
| 2.5 g | Glucose | 5 mg ml−1 |
| 0.66 g | Nicotinamide | 1.22 mg ml−1 |
|
| ||
Collagen for culturing cells in 2D only
For each well of a six well plate, prepare 1.5 ml of collagen solution (total of 9 ml for a six-well plate). For each 100 × 20 mm dish, prepare a 3-ml collagen solution. The final collagen concentration should remain at 2.31 mg ml−1. To determine the proper volume of x ml of collagen solution, add 100 μl of 10× PBS (10% (vol/vol)), 0.0165 ml of 1 N NaOH (1.65% (vol/vol)) and x ml of collagen. Adjust the volume up to 1 ml using ddH2O and keep it on ice. ▲ CRITICAL The stock concentration of collagen rat tail type I (BD Biosciences, cat. no. 354236) can vary depending on the batch from the company.
Cell suspension when culturing cells in 3D only
Adjust the PDC suspension to 0.5–2 × 10⁵ cells per ml in PDC full medium. The concentration has to be adjusted according to the specific cell type isolated. For example, wild-type PDCs are cultured at a concentration of 2 × 10⁵ cells per ml. Transformed cells (e.g., ductal cells from Pdx1cre;KrasG12D/+), however, require lower densities in order to avoid overgrowth.
Collagen for culturing cells in 3D only
Make up collagen solution as described as tabulated. One four-well chamber slide requires ∼2,500 μl of collagen solution. Mix 50 μl of the cell suspension into 350 μl of the collagen solution (ratio of 1:8 (vol/vol)) so that the final volume of cell-suspended collagen solution is 400 μl per well. ▲ CRITICAL The cell suspension/collagen solution ratio of 1:8 (vol/vol) should be kept consistent, as varying the collagen stiffness markedly influences the ability of PDCs to form cysts.
|
| ||
| Reagent | μl per 4-well plate | Ratio (vol/vol) |
|
| ||
| L-Glutamine (29.2 mg ml 1, 200 mM, 100×) | 294 μl | 1:8.5 |
| NaHCO3 7.5% solution | 77 μ l | 1:32.5 |
| MEM, 10× (without glutamine) | 245 μl | 1:10.2 |
| Nutragen (bovine collagen I, 6.0 mg ml−1) | 816 μl | 1:3.1 |
| HEPES (1 M, pH 7.6) | 49 μl | 1:51 |
| Sterile H2O | 1,020 μl | 1:2.5 |
| Final volume | 2,500 μl | |
|
| ||
PBS + for immunofluorescence staining of 3D spheroid cysts only
If you choose to make your own PBS +, dissolve 100 mg of CaCl2 and 470 mg of MgCl2 in PBS to obtain a final concentration of 0.9 mM and 0.493 mM, respectively. Adjust the pH to 7.4. PBS + can be stored for the long term at room temperature (RT; 20–25 °C).
Collagenase solution for immunofluorescence staining of 3D spheroid cysts only
Dissolve 1 mg of collagenase 1 in 10 ml of PBS + and keep it on ice. ▲ CRITICAL Freshly prepare before use.
4% (wt/vol) PFA for immunofluorescence staining of 3D spheroid cysts only
Place 4 g of PFA into a small beaker and add 86 ml of ddH2O and 10 μl of 10 N NaOH. Place a magnetic stir bar at the bottom. Place the smaller beaker into a larger beaker. The larger beaker should be filled with enough water so as to meet and exceed the liquid meniscus of the smaller beaker. Place the beakers on a 55 °C magnetic heating plate while stirring. After the PFA has gone into solution, add 10 ml of 10× PBS. Place this 4% (wt/vol) PFA on ice. ! CAUTION PFA is toxic upon inhalation or on contact with the skin. PFA should only be used inside a fume hood while you are wearing gloves, and it should be kept on ice. ▲ CRITICAL Temperature must not exceed 65 °C. PFA should be freshly prepared before use.
Permeabilization solution for immunofluorescence staining of 3D spheroid cysts only
Place 0.35 g of cold-water fsh skin gelatin into 50 ml of PBS +. Add 250 μl of Triton X-100. Ensure a homogeneous solution by gently agitating the solution for several min, and then keep it on ice.
▲ CRITICAL Freshly prepare this solution before use.
Procedure
Extraction of cells from the mouse pancreas
1| If you are preparing cells from the adult mouse pancreas, follow option A. If you are preparing cells from an embryonic mouse pancreas, follow option B.
(A) Preparation of a single-cell suspension from the adult mouse pancreas ● TIMING 1.5 h
Prepare 25 ml of 1 mg ml−1 collagenase type V solution in DMEM/F12.
-
Remove the pancreas and place it in a 50-ml conical tube containing G solution kept on ice.
▲ CRITICAL STEP If cells are going to be cultured after the purifcation, all consecutive steps should be performed under sterile conditions in a tissue culture hood.
Transfer the pancreas in the 4 °C G solution to a 50-ml glass beaker. Remove as much G solution as possible, and mince the pancreas into pieces smaller than 1 mm3.
Add 10 ml of 4 °C G solution. After permitting the remaining fat to come to the top, aspirate it carefully. Repeat this step twice.
Transfer the pancreatic suspension into a small jar or glass bottle containing a magnetic stir bar.
-
Aspirate the supernatant, but leave about a 1-ml volume that contains the pancreatic pieces. Pour the collagenase solution (25 ml) into this jar and incubate it at 37 °C in a water bath for 20 min or until the pieces are very small (no longer than 25 min). Use an immersible stirrer in a water bath. Alternatively, a hybridization oven set to 37 °C can be used along with a standard stirring plate and, on top, a water-filled jar.
▲ CRITICAL STEP Keep the stirring speed low.
Stop the reaction by diluting the collagenase solution in chilled (4 °C) G solution. Transfer the solution carefully to a 50-ml conical tube. Rinse the jars with G solution and collect all tissue in the conical tube. Fill the tube up to 50 ml with new G solution.
Centrifuge the tube at 300g for 5 min at 4 °C, and then stop and let the speed go down to 0 (centrifuge deceleration at low setting).
Aspirate the supernatant. Add 1 ml of trypsin-EDTA and resuspend the pellet with a 1,000-μl pipette. Incubate the mixture at RT for 5 min, and then add 2 ml of trypsin inhibitor and resuspend thoroughly. Bring the volume up to 50 ml with fresh G solution. Centrifuge the tube at 300g for 5 min at 4 °C, and then stop and let speed go down to 0.
Aspirate the supernatant. Resuspend the cell pellet in 10 ml of chilled (4 °C) sorting buffer (PBS pH 7.2 containing 0.5% (wt/vol) BSA and 2 mM EDTA). Filter the suspension through a 40-μm cell strainer. Centrifuge the mixture at 300g for 5 min at 4 °C, and then stop and let the speed go down to 0.
-
Resuspend the pellet in 1,600 μl (400 μl × 4) of sorting buffer and transfer 400 μl each into 4 × 1.5-ml tubes.
? TROUBLESHOOTING
(B) Preparation of a single-cell suspension from embryonic pancreas ● TIMING 0.5–1 h
For each mouse embryo, prepare an aliquot of 500 μl of 1 mg ml−1 collagenase type V solution in DMEM/F12 in a 1.5-ml tube.
-
Dissect the embryonic pancreas and transfer it into the collagenase solution. Depending on the experiment and genotype of the embryos, pancreata can be pooled or kept separately until the genotype is determined.
▲ CRITICAL STEP This procedure can be performed from as early as embryonic day 13.5 (E13.5).
Incubate the tube in a 37 °C water bath for 10 min.
Add 500 μl of ice-cold G solution and spin it at 300g for 5 min at 4 °C.
Discard the supernatant and resuspend the pellet in 200 μl of trypsin-EDTA 0.05% (wt/vol) using a P-1000 pipette.
Incubate the tube at RT for 5 min.
-
Add 400 μl of soybean trypsin inhibitor and resuspend using a P-1000 pipette.
▲ CRITICAL STEP Embryonic pancreas should completely dissociate at this step.
Spin down the tube at 300g for 5 min at 4 °C.
-
Resuspend the pellet in 400 μl of separation buffer.
? TROUBLESHOOTING
Mouse ductal cell labeling and cell separation ● TIMING 2 h
-
2| Add 400 μl of 1:200 diluted DBA lectin-FITC (diluted in sorting buffer to achieve a final concentration of 1:400) to each of the tubes containing 400 μl of single-cell suspension (final volume 800 μl). Keep one tube as a ‘presorting sample’ and place this on ice until RNA isolation.
▲ CRITICAL STEP As the cell number from each embryonic pancreas is limited, no presorting fraction should be prepared.
3| Incubate the tubes for 10 min in the dark at 4 °C on a rotor.
4| Wash the cells by adding 700 μl of separation buffer and flicking the tube; centrifuge the cell mixture for 10 min at 300g at 4 °C.
5| Remove the supernatant, add 90 μl of separation buffer to each tube and 10 μl of anti-FITC MicroBeads and resuspend carefully.
6| Incubate the mixture on a rotor at 4 °C for 15 min.
7| Wash the cells by adding 1 ml of sorting buffer and flicking the tube carefully.
8| Centrifuge the mixture at 300g for 10 min and remove the supernatant.
9| Resuspend each individual pellet in 500 μl of separation buffer and put each of these on ice.
-
10| Rinse the MACS Separation (MS) columns with 500 μl of chilled sorting buffer and then apply one of three labeled cell suspensions (500 μl) to the column.
▲ CRITICAL STEP Ensure that the solutions you are applying onto the columns are bubble free. In addition, always let the solution run through completely by gravity.
11| Wash the columns times with 500 μl of buffer and collect the flow-through as the DBA lectin-negative fraction in a 15-ml tube.
12| After washing, remove the column from the magnetic field and add 1,000 μl of separation buffer. Apply the plunger and collect the next flow-through as the DBA lectin-positive fraction in a 1.5-ml tube.
13| Repeat Steps 11 and 12 with the remaining labeled cell suspensions. Use a new MS column for each.
14| Spin down samples at 300g for 15 min at 4 °C. Discard the supernatant.
Culture of cells or extraction of RNA
15| If the above steps were performed under sterile conditions, then cells can be put into 2D (option A) or 3D (option B) culture. For RNA isolation, proceed to option C.
(A) Culturing PDCS in a monolayer (2D) ● TIMING 1 h
With the collagen kept on ice, coat the tissue culture plates with the collagen solution and incubate them in a tissue culture incubator for at least 45 min.
Resuspend the cell pellet in 1 ml of PDC full medium. Depending on the total cell number desired in each well, the suspension should be distributed into the appropriate number of wells. Place tissue culture plates in a tissue culture incubator.
-
For ongoing culture, replace the PDC full medium every other day.
▲ CRITICAL STEP When the medium is replaced, ensure that the collagen sheet stays intact.
Passage the cells as soon as they reach 80% confluency.
To passage cells, first remove the medium carefully without disturbing the collagen layer, and then mobilize the collagen sheet using a cell lifter.
v Transfer the collagen sheet into a 50-ml conical tube containing 9 ml of 1 mg ml−1 collagenase type V solution (3 ml of 1 mg ml−1 collagenase type V solution per 1 ml collagen).
vi Incubate this solution in a water bath at 37 °C for 15–20 min.
vii Pellet the cell suspension at 300g for 5 min at 4 °C, and remove the supernatant.
viii Add 1 ml of trypsin-EDTA 0.05% (wt/vol) and pipette this solution up and down using a 1,000-μl pipette.
ix Incubate the mixture for 5 min at RT.
x Add 2 ml of soybean trypsin inhibitor first and then add 25 ml of cold G solution afterwards.
xi Repeat Step 15A(vii).
-
xii Resuspend the cell pellet in PDC full medium and carefully plate it onto collagen-coated plates (see Step 1). The density of primary PDCs must not go below 6 × 10⁵ cells per 100 mm plate or 7.5 × 10⁴ cells per six-well plate.
? TROUBLESHOOTING
(B) Culturing PDCs in 3D ● TIMING 3 h 15 min
-
Collagen coating of chamber slides. Prepare the collagen solution and coat each well with 225 μl of collagen solution using a sterile pipette tip (200 μl). Allow the collagen to solidify in a hybridization oven set to 37 °C for 45 min. The remaining collagen solution must be kept on ice during this time. Perform this step under atmospheric conditions.
▲ CRITICAL STEP Ensure that the entire bottom of the chamber slide is covered.
-
Adjust the PDC concentration and plate the cells. While the collagen plates are solidifying, adjust the concentration of the cell suspension to 0.5–2.0 × 10⁵ cells ml−1 in PDC full medium.
▲ CRITICAL STEP Single-cell suspension is CRITICAL if one is to assess cyst formation from individual cells.
-
Add 50 μl of PDC solution (in PDC full medium) to 350 μl of collagen solution and gently mix (ratio of 1:8 (vol/vol)).
▲ CRITICAL STEP Avoid creating bubbles.
-
Gently pipette this cell-collagen mix (50 μl of cell suspension + 350 μl of collagen solution, ratio of 1:8 (vol/vol)) on top of the solidified bottom collagen layer. Place the chamber slide into a hybridization oven set to 37 °C for 45 min.
▲ CRITICAL STEP Do not agitate the chamber slides.
After ensuring solidification, add 500 μl of culture medium into each well of the chamber and place it in a 37 °C incubator with 5% CO2 for further culturing.
-
Replace PDC full medium every 2 d.
▲ CRITICAL STEP To avoid breaking the collagen layer, do not try to aspirate the entire tissue culture medium; rather, pipette the medium off of the side of each chamber using a pipette while holding the chamber slide at a slight angle.
-
Analyze PDC cysts at 10 d after plating. PDCs isolated from highly proliferative Pdx1cre;KrasG12D/+ mice form cysts much faster and can be analyzed earlier (5-8 d).
? TROUBLESHOOTING
(C) RNA isolation ● TIMING 1.5 h
Resuspend each of the pellets from the three DBA-positive samples in 100 μl of lysis buffer, and then pool them into a single tube. Resuspend each of the DBA-negative and presorting samples in 300 μl of lysis buffer.
Proceed with RNA isolation according to the manufacturer's instructions (Ambion RNAqueous-Micro kit), making sure to include DNase treatment.
-
Assess RNA quality and yield by the 2100 Bioanalyzer (Agilent). Samples with an RNA integrity number >7 may be subjected to further applications (e.g., microarray).
? TROUBLESHOOTING
Analysis of cells
16| If you have grown 3D spheroid cysts, they can be stained and imaged as described in option A. If cells have been cultured in 2D, they can be transduced with lentivirus as described in option B. To identify and study potential cancer-initiating cells from DBA lectin-sorted cells or cells grown in 2D or 3D, follow option C.
(A) Immunofluorescence staining of 3D spheroid cysts ● TIMING variable; can be done over 1, 2 or 3 d
Aspirate the medium and place 500 μl of PBS + onto each well. Incubate the mixture for 1 min, aspirate the PBS + and repeat these steps twice. Aspirate the last PBS + wash before proceeding to the next step.
-
Gently add an equivalent volume of collagenase solution (1 mg ml−1) to each well. Incubate the plates at 37 °C for 10 min.
▲ CRITICAL STEP Do not exceed 10 min of collagenase digestion.
Aspirate the collagenase solution and wash each well three times for 1 min per wash with 500 μl of PBS +. Aspirate the last PBS + wash before proceeding to the next step.
Place 500 μl of freshly made 4% (wt/vol) PFA on each well and gently rock for 30 min at RT.
-
Aspirate PFA and wash the wells with PBS + three times for 1 min each at RT. Aspirate the PBS + after each wash. Next, wash the wells twice with PBS + for 5 min each time on a rocker at RT. Aspirate the PBS + after each wash.
▪ PAUSE POINT Samples can be stored at 4 °C with 500 μl of 0.1% (wt/vol) PFA on top of each sample for 2 weeks.
Incubate the samples with 500 μl of permeabilization solution per well, with gentle rocking for 30 min at RT or overnight at 4 °C.
Dilute the desired antibody within the permeabilization solution and incubate it for 3 h at RT or overnight at 4 °C. Each well should be covered with 500 μl of permeabilization/antibody solution.
Aspirate the permeabilization/antibody solution and wash the samples once with 500 μl of permeabilization solution for 1 min at RT.
While rocking, wash the samples three times for 10 min each time at RT with permeabilization solution. Aspirate the permeabilization solution after each wash.
Dilute the desired secondary antibody and DAPI within the permeabilization solution. Dilutions should be determined experimentally for each specific application. An appropriate starting point is 1:400 for the secondary antibody and 1:1,000 for DAPI. Place 500 μl of permeabilization/antibody/DAPI solution on each sample and incubate with gentle rocking at RT for 3 h or overnight at 4 °C.
Wash the samples once with permeabilization solution for 1 min at RT. Aspirate the permeabilization solution.
While rocking, wash the samples three times for 10 min each time at RT with 500 μl of permeabilization buffer. Aspirate the permeabilization solution after each wash.
Wash the samples with 500 μl of PBS + twice for 5 min each time. Aspirate the PBS + after each wash.
Cover each sample with 500 μl of 4% (wt/vol) PFA and gently rock it for 30 min.
Aspirate the remaining PFA and wash the samples once with PBS + for 1 min at RT.
Aspirate the PBS +, and while rocking wash the samples three times for 5 min each time at RT with 500 μl of PBS +. Aspirate the PBS + after each wash.
Gently remove the chamber cassette that surrounds the samples on the slide. This can be accomplished by placing the chamber slide on a fat surface, and, while holding the slide firmly, prying the cassette loose from the slide. Once this step is complete, the collagen samples should be left undisturbed on the slide and there should be no remaining cassette plastic. A layer of glue may remain from the outline of the cassette, and it is important to gently remove this as well.
-
Place one drop of fluorescent mounting medium onto the slide and place a coverslip on top. Allow the mounting medium to spread out on the slide.
▲ CRITICAL STEP Do not apply pressure on the matrix when you are placing the coverslip.
Place the slide upside down at 4 °C overnight.
-
Image the slides using the inverted laser-scanning confocal microscope.
? TROUBLESHOOTING
(B) Lentiviral transduction ● TIMING 5–10 d
Preparation of a single-cell suspension and cell plating. Ensure that you have 10-cm cell culture dishes with PDCs on collagen type I at 50–70% confluence.
Dissolve 10 mg of collagenase type 4 in 10 ml of DMEM/F12 within a separate 50-ml conical tube.
Remove the medium and dislodge the collagen layer with a sterile cell lifter.
Transfer the collagen sheet into the 50-ml conical tube containing the collagenase solution (see Step 16B(ii)) and incubate it in a 37 °C water bath for 20 min (slightly shake it every 5 min).
Add 20 ml of 37 °C warmed DMEM/F12 and centrifuge the tube at 300g for 5 min at RT.
Remove the supernatant.
-
Add 300 μl of trypsin to the cell pellet, resuspend it by pipetting up and down five times and incubate the mixture for 3 min at RT.
▲ CRITICAL STEP Thoroughly resuspend the pellet to ensure that cells become separated from one another.
Add 600 μl of soybean trypsin inhibitor and mix it into the solution by pipetting up and down five times.
Add 15 ml of 37 °C warmed DMEM/F12 and centrifuge the mixture at 300g for 5 min at RT.
Aspirate the supernatant and resuspend the pellet in 3 ml of PDC full medium.
Count the number of cells within the cell suspension.
Seed 1 × 10⁵ cells per well onto a collagen-coated six-well plate and incubate it for 24 h in full medium containing all supplements. Use a single six-well plate for each virus. Prepare one extra plate that serves as control for selection.
-
Infection. Thaw the filtered lentiviral supernatant (see the table below for constructs) in a water bath for 2 min and keep it on ice until it is ready to use.
! CAUTION Recombinant lentiviruses are designated as Biosafety Level 2 organisms. The lentiviral constructs listed have been extensively used in primary PDCs.
Vector construct selection gene transgene expression Distribution
pGIPZ Puromycin Constitutive Open Biosystems PTRIPZ Puromycin Tet-On inducible Open Biosystems LV-LacZ — Constitutive Addgene LV-Cre-SD — Constitutive Addgene
Aspirate the medium from PDCs grown on collagen and add 2 ml of PDC full medium containing 4 μg ml−1 polybrene (10 mg ml−1) to each well.
Add 400 μl of virus to each well and mix the six-well plate gently by rocking it by hand.
Centrifuge the plate at 550g for 1 h at 32 °C.
-
Aspirate the medium that contains virus.
! CAUTION Follow standard viral protocols for proper disposal of virus-containing solutions.
Add 2 ml of prewarmed (37 °C) PDC full medium that includes 4 μg ml−1 polybrene (10 mg ml−1) to each well.
Add 400 μl of virus and mix gently by rocking the six-well plate by hand.
Centrifuge the plate at 550g for 1 h at 32 °C.
-
Aspirate the medium that contains the virus.
! CAUTION Follow standard viral protocols for proper disposal of virus-containing solutions.
Add 2 ml of prewarmed (37 °C) PDC full medium to each well.
Selection. Perform drug selection using 5 μg ml−1 puromycin over 5–10 d. Cells should be passaged at least once during this time. In the case of LV-cre-SD, there is no selectable marker. For that reason, it is advantageous to isolate PDCs from mice that harbor a reporter, for example, a Rosa26YFP allele. FACS can be used to select for recombined cells (Fig. 3).
Figure 3.

In vitro Cre recombination. PDCs were isolated from a LSL-KrasG12D/+;R26YFP mouse and transduced with either lentiviral LacZ (LV-LacZ, control) or lentiviral, self-deactivating Cre recombinase (LV-Cre-SD). YFP-positive cells are considered to have undergone recombination. Cells were analyzed on days 1, 2, 3 and 4 in this representative experiment.
(C) Identifying potential cancer-initiating cells from DBA lectin-sorted cells or cells grown in 2D or 3D ● TIMING 2 h
Plate (0.5–2.0 × 10⁵) cells onto one well of a six-well plastic plate with 2 ml of PDC full medium. Allow the cells to grow at 37 °C in a 5% CO2 incubator for 48 to 96 h. To analyze the distribution of the above-mentioned surface markers in cells that are growing on 2D collagen, in 3D collagen or on plastic plates, PDCs should be prepared with a density of 0.3–1.0 × 10⁶ cells per well of a six-well plastic plate.
Preparation for flow cytometry experiments. Add 350 μl of trypsin-EDTA per well of a six-well plate to detach the cells, and incubate the plate for 5 min at 37 °C with 5% CO2.
-
Neutralize the trypsin digest by adding 700 μl of soybean trypsin inhibitor. Collect the cells and transfer them into a 15-ml conical tube. Add 3 ml of cold PBS and centrifuge the tube at 300g for 5 min at 4 °C.
▲ CRITICAL STEP Keep PBS and FACS buffer on ice during use.
Aspirate the supernatant and wash the cells with 3 ml of cold PBS; centrifuge at 300g for 5 min at 4 °C. Use 1,000 μl of washing solution (e.g., PBS and FACS buffer) in order to wash the cells well. This can be accomplished by using 1,000-μl tips in each washing step. Add 2 ml of washing solution afterward.
Aspirate the supernatant and wash the cells with 3 ml of cold FACS buffer.
Centrifuge the tube (300g for 5 min at 4 °C) again and discard the supernatant.
-
Resuspend the cells with 500 μl of cold FACS buffer and transfer 100 μl of this solution into a 5-ml polystyrene-bottom FACS tube.
▲ CRITICAL STEP Prepare samples of negative control (e.g., no antibody) and single positive control for each antibody for each different type of cell.
-
Add antibodies (PE/Cy7-CD24: 10 μl, APC-CD44: 5 μl, APC-CD133: 10 μl, APC-EpCAM: 0.6 μl per 100 μl of cell suspension with FACS buffer; see the table below for further details) into the FACS tube in the dark.
cell surface marker antibody Dilution condition (volume/100 ml sample) laser channel in Facscalibur
CD24 Anti-CD24-PE/Cy7 1:10 (10 μl) FL-3 CD44 Anti-CD44-APC 1:20 (5 μl) FL-4 CD133 (prominin-1) Anti-prominin-1-APC 1:10 (10 μl) FL-4 EpCAM (CD326) Anti-EpCAM-APC 1:167 (0.6 μl) FL-4
▲ CRITICAL STEP Keep the samples supplemented with antibodies on ice and in the dark.
Incubate the samples on ice for 30 min in the dark.
Add 3 ml of cold FACS buffer to wash the cells, and centrifuge them at 300g for 5 min at 4 °C.
Remove the supernatant and resuspend the cells with 500 μl of FACS buffer.
Add 2 μl of PI (1 mg ml−1) in order to exclude dead cells from the subsequent analysis.
Analyze the expression of cell surface markers for these cells using the FACSCalibur.
Gate setting in FACSCalibur and software for analysis of data. For appropriate forward-scatter (FSC-A) and side-scatter (SSC-A) gating of PDCs, gate single cells within the range of 100-600 in both FSC-A and SSC-A. Gate living cells at a PI intensity that is below 101.3 in the FL-2 laser channel of FACSCalibur. For analysis of the data, use FlowJo software, version 7.6.5.
Troubleshooting
Step 1A
Low separation efficiency
Magnetic beads have a fairly short shelf-life, which can affect the separation efficiency. An alternative separation approach would be to use biotinylated DBA lectin (Vector labs, cat. no. B1035) in combination with streptavidin magnetic beads (Miltenyi Biotec, cat. no. 130-048-102).
Small cell number
Ensure that the cell number per MS column does not exceed 107 cells. It is possible to saturate the column, leading to lower cell recovery and decreased separation efficiency. To avoid saturation, increase the number of aliquots or columns per pancreas.
Reduced cell viability
Try to keep the time of the collagenase digestion as short as possible. In addition, ensure that the stirring speed of the magnetic stir bar is set to a low speed in order to reduce shear forces. When you are centrifuging the samples, do not exceed 300g.
Step 1B
It is crucial to ensure proper timing of mouse matings and to annotate the dates of embryos in order to gain reproducible results, especially during secondary transition around E14.5 when gene expression within the ductal population can change rapidly. When you are dissecting the embryonic mouse pancreas, it is essential to separate the pancreas properly from the spleen, liver and intestine. Contaminating tissues can markedly skew the gene expression results.
Step 15A
Disintegration of the collagen sheet
It is absolutely necessary to keep the collagen sheet intact. Without sufficient solidification time in the incubator (45 min), collagen sheets commonly rupture or float off of the tissue culture plastic. In addition, be sure that the 10× PBS has not precipitated and that the NaOH is 1 N. Remove any residual collagenase solution at each step. An additional washing step with DMEM/F12 can be performed if necessary.
Alternative culturing conditions
PDCs isolated from wild-type cells or from cells that do not harbor a pro-proliferative mutation require a collagen matrix to maintain cultures and subsequent passages. Cells will undergo senescence within 5–7 d when they are grown on tissue culture plastic. However, cells isolated from the Pdx1cre;KrasG12D/+ (± p53R172H/+; note that p53 is officially known as Trp53) mouse model, for example, can be cultured directly on plastic after three passages on collagen. The three passages, as well as the cholera toxin supplemented in the PDC full medium, allow the epithelial cells to outgrow potential contaminating fibroblasts.
Growth characteristics are not reproducible on different collagen concentrations
It is necessary to dilute all collagen stocks to the same concentration for each experimental iteration. The concentration of collagen will determine its final solidification matrix composition, mechanical stiffness and surface tension. Small changes in concentration can alter the extracellular matrix surface protein spatial arrangement and cause receptor clustering and mechanical force transmission differences between each experimental condition. Here we used a collagen concentration of 2.31 mg ml−1, which corresponds to an elastic modulus of 300–800 Pascal, in line with the current estimation of in vivo pancreatic stiffness18.
Cells are dying
It is crucial to change the PDC full medium every 2-3 d. Medium stored at 4 °C can be used for up to 6 weeks. When you are passaging PDCs, avoid going below the CRITICAL cell density (see Step 15A(xii)). Wild-type PDCs can be cultured for ∼15 passages. After 15 passages, they substantially change their morphology and eventually undergo senescence.
Step 15B
Inconsistent results
As mentioned above, the ratio of cell suspension–to-collagen solution must be kept consistent in order to generate reproducible results. The 50-μl volume of suspended cells should not be exceeded; however, smaller volumes are possible. In addition, avoid plating cells at a higher density than recommended, as cysts will not expand evenly.
Cysts do not form
If the collagen solution is extensively diluted, it will not solidify within the incubator and the cells will sink to the bottom, confounding the 3D model. This results in cells growing as a sheet rather than as spheroid cysts within a matrix. To culture PDCs successfully in 3D, ensure that the collagen (bottom layer) has completely solidified before adding the cell-collagen mixture. This confirms that the collagen solution solidifies appropriately. Before the PDC full medium is added, one can use a light microscope and focus through the collagen matrix. Single cells should be noticeable at different layers within the matrix.
Step 15C
Low RNA quality
If the troubleshooting steps mentioned above are followed, the RNA quality is consistently excellent (RNA integrity number >7). The RNAqueous-Micro kit (Ambion, cat. no. AM1931) should be used.
Step 16A
Please be advised that only a limited number of antibodies have been tested. Different antibodies might require different conditions (e.g., alternative fixative), which will have to be determined empirically.
Cysts do not keep spheroid structures
During Step 2, it is important to not exceed a 10-min collagen digestion, as it is necessary for some scaffold to remain, which will subsequently prevent the entire matrix from collapsing.
As described in Step 18, it is critical to avoid applying unnecessary pressure to the matrix, as the 3D structure of the cysts will be disturbed.
Cyst crowding
Depending on the 3D culture time period and the specific cell type chosen, the cell density must be adjusted according to proliferation characteristics. It should be noted that during the immunofluorescence preparation of cysts, the matrix will flatten somewhat regardless of the amount of pressure applied. If the initial seeding density was too high, the cysts will then become condensed and the edges of each cyst can overlap, thereby markedly affecting the imaging quality.
● TIMING
Step 1A, preparation of a single-cell suspension from an adult pancreas: 1.5 h
Step 1B, preparation of a single-cell suspension from an embryonic pancreas: 0.5-1 h
Steps 2-14, mouse ductal cell labeling and cell separation: 2 h
Step 15A, passage of cells growing as a monolayer: 1 h
Step 15B, culture of cells growing in 3D culture: i, 1 h; ii-vii, 2 h 15 min
Step 15C, RNA isolation: 1.5 h
Step 16A, immunofluorescence staining of 3D spheroid cysts: this procedure can be performed over 1, 2 or 3 d
Step 16A, 1-d protocol: 9 h (i–vii: 1.5 h; viii-x: 3.5 h; xi–xx: 4.5 h)
Step 16A, 2-d protocol: 48 h (i–vii: 1.5 h; viii overnight; ix–xx: 5 h)
Step 16A, 3-d protocol: 72 h (i–vii: 1.5 h; viii overnight; ix–x: 45 min; xi overnight; xii–xx: 90 min)
Step 16B, lentiviral transduction: preparation of a single-cell suspension and cell plating (i–xii), 1 h; infection (xiii–xxii), 2.5 h; selection (xxiii), 5–10 d
Step 16C, identification of potential cancer-initiating cells: 2 h
Anticipated Results
Depending on the physiologic or pathophysiologic condition from which the cells were isolated, reverse transcription quantitative PCR (RT-qPCR) can be performed by using the primer with pancreatic lineage specifcity (table 1) to determine separation effciency. DBA lectin–separated pancreatic cells from an adult mouse should show signifcant enrichment of ductal lineage marker genes (e.g., Krt19, Sox9, Hnf1b), whereas acinar (e.g., Ptf1a, Cela1, Amy2a, Bhlha15) and endocrine (e.g., Ins1, Neurod1) genes should be depleted (Fig. 4). This technique has been applied to homeostatic conditions such as normal adult and embryonic mouse pancreata, as well as to pathologic states such as acute and chronic cerulein-induced pancreatitis and Kras-driven carcinogenesis12. In general, it is applicable to a range of other pancreatic mouse models. It is, however, important to be aware that lineage separation in embryos earlier than E15.5 is not as clear as in late embryos or, more defnitively, from the adult pancreas. This is simply due to the fact that during secondary transition the primitive epithelial trunk and ducts have yet to be fully specifed, and therefore coexpress genes from several lineages (e.g., Pdx1 and Krt19). DBA lectin–positive cells that have been plated onto collagen (2D) will form colonies with epithelial morphology (Fig. 5) (also see Schreiber et al.19). PDCs (wild type) tend to form spheroid cysts within 10 d when they are plated into a collagen matrix (3D). Cysts consistently appear regularly rounded in shape, but they can vary in size (Fig. 6). A small percentage of cysts can show single and multicellular outgrowths reminiscent of branches (Fig. 7). One can anticipate cysts of consistent size composed of a regularly shaped single-cell outer layer with a hollow core void of epithelial cells. Cells isolated from mice harboring mutant KrasG12D with or without mutant p53R172H form irregularly shaped cysts that often demonstrate cellular protrusions (‘spikes’ or invadapodia). Clusters of spindle-shaped cells often coexist with the cysts. These cysts can be analyzed for changes in shape dynamics (regular versus irregular) dependent upon genetic or nongenetic manipulation (Fig. 8)20-22.
Table 1.
Primer sequences of pancreatic lineages (forward primers are listed first, reverse primers second).
| Keratin 19 (Krt19) | 5′-TCCCAGCTCAGCATGAAAGCT-3′ | 5′-AAAACCGCTGATCACGCTCTG-3′ |
| Sox9 | 5′-CAAGACTCTGGGCAAGCTCTG-3′ | 5′-TCCGCTTGTCCGTTCTTCAC-3′ |
| Hnf1b | 5′-ACAATCCCAGCAATCTCAGAA-3′ | 5′-GCTGCTAGCCACACTGTTAATGA-3′ |
| Ptf1a | 5′-TGCGCTTGGCCATAGGCTACATTA-3′ | 5′-AGATGATAACCTTCTGGGCCTGGT-3′ |
| Elastase (Cela1) | 5′-AATGTCATTGCCTCCAACTGAGCG-3′ | 5′-ATTAGACAAGTGCTCGGCCACTGA-3′ |
| Amylase (Amy2a) | 5′-TGCAGGTCTCTCCACCCAATGAAA-3′ | 5′-TGCACCTTGTCACCATGTCTCTGA-3′ |
| Bhlha15 | 5′-AATAAGGAGGGTGAGTGGTTGGCA-3′ | 5′-AAGGAAGAGGCCAAGGACAAGTGA-3′ |
| Insulin (Ins1) | 5′-GGACCTTCAGACCTTGGCGTT-3′ | 5′-GTTGCAGTAGTTCTCCAGCTGGTA-3′ |
| NeuroD (Neurod1) | 5′-ACCTTGCTACTCCAAGACCCAGAA-3′ | 5′-TTTGCAGAGCGTCTGTACGAAGGA-3′ |
Figure 4.
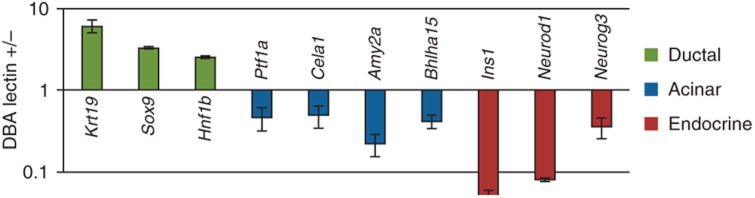
Ratio of relative gene expression in DBA lectin-positive and DBA lectin–negative cells. Ductal marker genes (Krt19, Sox9 and Hnf1b) are enriched, whereas acinar (Ptf1a, Cela1, Amy2a, Bhlha15) and endocrine (Ins1, Neurod1, Neurog3) marker transcripts are decreased. n = 3. Error bars represent the s.e.m. Reproduced with permission from ref. 12.
Figure 5.
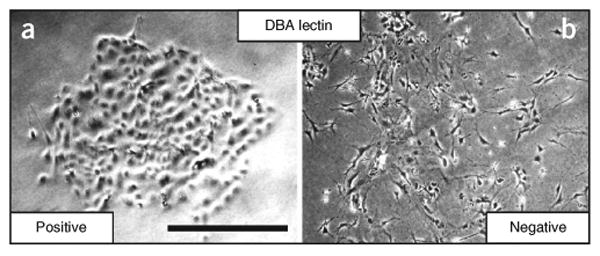
Cells in 2D culture. Phase-contrast photomicrograph of DBA lectin–separated cells cultured on a collagen layer (2D) for 7 d. (a) DBA lectin–positive cells form epithelial colonies. (b) Of all the cell types in the DBA lectin–negative fraction, fibroblasts are the most common cells to attach to the collagen matrix before they undergo senescence. Scale bar, 100 μm. Reproduced with permission from ref. 12.
Figure 6.
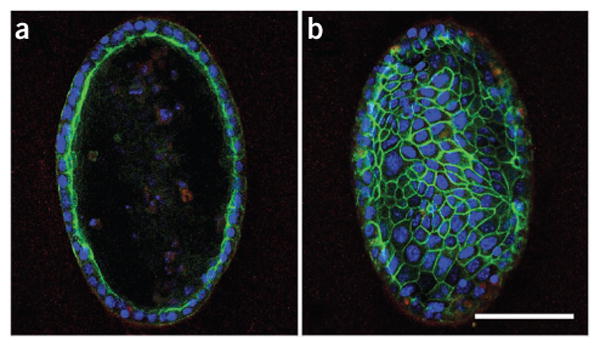
Confocal photomicrograph of cysts. (a,b) A cross-section of a cyst (a) and surface of the same cyst (b). Green (phalloidin) localizes with F-actin. Blue represents a nuclear counterstain using DAPI. Scale bar, 100 μm (ref. 18).
Figure 7.
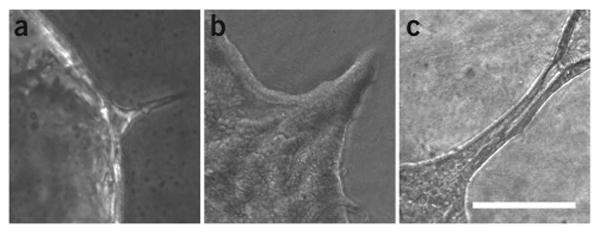
In vitro branching morphogenesis. Phase-contrast photomicrograph of the edge of a spheroid cyst. (a-c) A small centrifugal protrusion forms (a) that continuously grows (b) and eventually forms a hollow tube (c). Scale bar, 50 μm (ref. 18).
Figure 8.
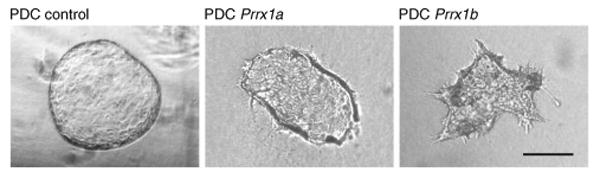
Cells in 3D culture. Phase-contrast photomicrograph of PDC lines transduced (see PROCEDURE) with control, Prrx1a or Prrx1b gene variants, respectively. Change in cyst morphology (regular versus irregular) was used to determine the effect of Prrx1a and Prrx1b on cellular polarization and organization. Scale bar, 100 μm. Reproduced with permission from ref. 12.
DBA lectin-positive cells that have been cultured in 2D can be manipulated using lentiviral vectors. The transduction effciency can vary substantially depending on the lentiviral vector that is originally transduced. In addition, virus quality and virus concentration, as well as the infectibility of the recipient cell line, can also alter the transduction effciency. It is notable that PDCs from wild-type animals are considerably harder to transduce than PDCs derived from PanIN or PDAC.
Finally, primary cell lines can be analyzed with regard to their distribution of so-called cancer stem cell markers. Substantial variation can be observed in the distribution of CD44/CD24, CD133 and EpCAM expression among different types of PDCs: normal PDCs (wild-type PDC); Pdx1cre;KrasG12D/+; and Pdx1cre;KrasG12D/+;p53R172H/+ cells. In general, PDCs isolated from Pdx1cre;KrasG12D/+ mice have signifcantly less CD44High cells when compared with PDCs from Pdx1cre;KrasG12D/+;p53R172H/+ cells. On the other hand, the percentage of both CD133High cells and EpCAMHigh cells gradually decrease in cells isolated from Pdx1cre, Pdx1cre;KrasG12D/+ and Pdx1cre;KrasG12D/+;p53R172H/+ mice.
Acknowledgments
This work was supported by the US National Institutes of Health (NIH) (grant no. DK060694 to M.R., S.T., S.H., B.B., A.K.R.), the National Pancreas Foundation (M.R.), the Honjo InteRNAtional Scholarship Foundation (S.T.), Deutsche Krebshilfe (S.H.), the NIH/National Institute of Diabetes and Digestive and Kidney Diseases (NIDDK) (grant no. F30 DK088402-01 to G.P.B.), NIH/NIDDK grant no. P30 DK050306 Center for Molecular Studies in Digestive and Liver Diseases (and Molecular Pathology and Imaging, Molecular Biology/Gene Expression, Cell Culture, Transgenic and Chimeric Mouse Cores) and American Cancer Society grant no. RP-10-033-01-CCE.
Footnotes
Author contributions M.R. and A.K.R. conceived the DBA lectin sorting strategy. M.R., S.T., S.H., B.B., G.P.B. and A.K.R. performed the experiments and wrote the manuscript. M.R., S.T., S.H., B.B., G.P.B. and A.K.R. discussed the results and commented on the manuscript at all stages.
Competing Financial Interests The authors declare no competing financial interests.
Reprints and permissions information is available online at http://www.nature.com/reprints/index.html.
References
- 1.Gu G, Dubauskaite J, Melton DA. Direct evidence for the pancreatic lineage: NGN3+ cells are islet progenitors and are distinct from duct progenitors. Development. 2002;129:2447–2457. doi: 10.1242/dev.129.10.2447. [DOI] [PubMed] [Google Scholar]
- 2.Kawaguchi Y, et al. The role of the transcriptional regulator Ptf1a in converting intestinal to pancreatic progenitors. Nat Genet. 2002;32:128–134. doi: 10.1038/ng959. [DOI] [PubMed] [Google Scholar]
- 3.Reichert M, Rustgi AK. Pancreatic ductal cells in development, regeneration, and neoplasia. J Clin Invest. 2011;121:4572–4578. doi: 10.1172/JCI57131. [DOI] [PMC free article] [PubMed] [Google Scholar]
- 4.Desai BM, et al. Preexisting pancreatic acinar cells contribute to acinar cell, but not islet beta cell, regeneration. J Clin Invest. 2007;117:971–977. doi: 10.1172/JCI29988. [DOI] [PMC free article] [PubMed] [Google Scholar]
- 5.Solar M, et al. Pancreatic exocrine duct cells give rise to insulin-producing beta cells during embryogenesis but not after birth. Dev Cell. 2009;17:849–860. doi: 10.1016/j.devcel.2009.11.003. [DOI] [PubMed] [Google Scholar]
- 6.Rhim AD, et al. EMT and dissemination precede pancreatic tumor formation. Cell. 2012;148:349–361. doi: 10.1016/j.cell.2011.11.025. [DOI] [PMC free article] [PubMed] [Google Scholar]
- 7.Rovira M, et al. Isolation and characterization of centroacinar/terminal ductal progenitor cells in adult mouse pancreas. Proc Natl Acad Sci USA. 2010;107:75–80. doi: 10.1073/pnas.0912589107. [DOI] [PMC free article] [PubMed] [Google Scholar]
- 8.Oshima Y, et al. Isolation of mouse pancreatic ductal progenitor cells expressing CD133 and c-Met by flow cytometric cell sorting. Gastroenterology. 2007;132:720–732. doi: 10.1053/j.gastro.2006.11.027. [DOI] [PubMed] [Google Scholar]
- 9.Agbunag C, Lee KE, Buontempo S, Bar-Sagi D. Pancreatic duct epithelial cell isolation and cultivation in two-dimensional and three-dimensional culture systems. Methods Enzymol. 2006;407:703–710. doi: 10.1016/S0076-6879(05)07055-2. [DOI] [PubMed] [Google Scholar]
- 10.Gmyr V, et al. Human pancreatic ductal cells: large-scale isolation and expansion. Cell Transplant. 2001;10:109–121. [PubMed] [Google Scholar]
- 11.Cotton CU, Cotton U, Al-nakkash L. Isolation and culture of bovine pancreatic duct epithelial cells Isolation and culture of bovine pancreatic duct epithelial cells. Am J Physiol. 1997;272(6 Part 1):G1328–G1337. doi: 10.1152/ajpgi.1997.272.6.G1328. [DOI] [PubMed] [Google Scholar]
- 12.Reichert M, et al. The Prrx1 homeodomain transcription factor plays a central role in pancreatic regeneration and carcinogenesis. Genes Dev. 2013;27:288–300. doi: 10.1101/gad.204453.112. [DOI] [PMC free article] [PubMed] [Google Scholar]
- 13.Prasad NB, et al. Gene expression profles in pancreatic intraepithelial neoplasia refect the effects of Hedgehog signaling on pancreatic ductal epithelial cells. Cancer Res. 2005;65:1619–1626. doi: 10.1158/0008-5472.CAN-04-1413. [DOI] [PubMed] [Google Scholar]
- 14.Wang YJ, Bailey JM, Rovira M, Leach SD. Sphere-forming assays for assessment of benign and malignant pancreatic stem cells. Methods Mol Biol. 2013;980:281–290. doi: 10.1007/978-1-62703-287-2_15. [DOI] [PubMed] [Google Scholar]
- 15.Hermann P, et al. Distinct populations of cancer stem cells determine tumor growth and metastatic activity in human pancreatic cancer. Cell Stem Cell. 2007;1:313–323. doi: 10.1016/j.stem.2007.06.002. [DOI] [PubMed] [Google Scholar]
- 16.Li C, et al. Identifcation of pancreatic cancer stem cells. Cancer Research. 2007;67:1030–1037. doi: 10.1158/0008-5472.CAN-06-2030. [DOI] [PubMed] [Google Scholar]
- 17.Li C, et al. c-Met is a marker of pancreatic cancer stem cells and therapeutic target. Gastroenterology. 2011;141:2218–2227. e5. doi: 10.1053/j.gastro.2011.08.009. [DOI] [PubMed] [Google Scholar]
- 18.Cross SE, et al. AFM-based analysis of human metastatic cancer cells. Nanotechnology. 2008;19:384003. doi: 10.1088/0957-4484/19/38/384003. [DOI] [PubMed] [Google Scholar]
- 19.Schreiber FS, et al. Successful growth and characterization of mouse pancreatic ductal cells: functional properties of the Ki-RASG12V oncogene. Gastroenterology. 2004;127:250–260. doi: 10.1053/j.gastro.2004.03.058. [DOI] [PubMed] [Google Scholar]
- 20.Botta GP, Reginato MJ, Reichert M, Rustgi AK, Lelkes PI. Constitutive K-RasG12D activation of ERK2 specifcally regulates 3D invasion of human pancreatic cancer cells via MMP-1. Mol Cancer Res. 2012;10:183–196. doi: 10.1158/1541-7786.MCR-11-0399. [DOI] [PMC free article] [PubMed] [Google Scholar]
- 21.Wescott MP, et al. Pancreatic ductal morphogenesis and the Pdx1 homeodomain transcription factor. Mol Biol Cell. 2009;20:4838–4844. doi: 10.1091/mbc.E09-03-0203. [DOI] [PMC free article] [PubMed] [Google Scholar]
- 22.Deramaudt TB, et al. N-cadherin and keratinocyte growth factor receptor mediate the functional interplay between Ki-RASG12V and p53V143A in promoting pancreatic cell migration, invasion, and tissue architecture disruption. Mol Cell Biol. 2006;26:4185–4200. doi: 10.1128/MCB.01055-05. [DOI] [PMC free article] [PubMed] [Google Scholar]