Abstract
Background: Debates exist over whether health inequities are bound to rise as population health improves, due to health improving more quickly among the better off, with most analyses focused on mortality data.
Methods: We analysed 50 years of socioeconomic inequities in measured health status among US-born Black and White Americans, using data from the National Health Examination Surveys (NHES) I-III (1959–70), National Health and Nutrition Examination Surveys (NHANES) I-III (1971–94) and NHANES 1999–2008.
Results: Absolute US socioeconomic health inequities for income percentile and education variously decreased (serum cholesterol; childhood height), stagnated [systolic blood pressure (SBP)], widened [body mass index (BMI), waist circumference (WC)] and in some cases reversed (age at menarche), even as on-average values rose (BMI, WC), idled (childhood height) and fell (SBP, serum cholesterol, age at menarche), with patterns often varying by race/ethnicity and socioeconomic measure; similar results occurred for relative inequities. For example, for WC, the adverse 20th (low) vs 80th (high) income percentile gap increased only among Whites (NHES I: 0.71 cm [95% confidence interval (CI) −0.74, 2.16); NHANES 2005–08: 2.10 (95% CI 0.96, 3.62)]. By contrast, age at menarche for girls in the 20th vs 80th income percentile among Black girls remained consistently lower, by 0.34 years (95% CI 0.12, 0.55) whereas among White girls the initial null difference became inverse [NHANES 2005–08: −0.49 years (95% CI −0.86, −0.12; overall P = 0.0015)]. Adjusting for socioeconomic position only modestly altered Black/White health inequities.
Conclusions: Health inequities need not rise as population health improves.
Keywords: Social inequalities in health, socioeconomic, secular trend, National Health and Nutrition Examination Survey (NHANES) - US, National Health Examination Survey (NHES) - US, race/ethnicity
Key Messages.
Debates exist over whether health inequities are bound to rise as population health improves, due to health improving more quickly among the better off, with most analyses focused on mortality data.
We analysed 50 years of socioeconomic inequities in measured health status among US-born Black and White Americans, using data from the National Health Examination Surveys (NHES) I-III (1959–70), National Health and Nutrition Examination Surveys (NHANES) I-III (1971–94) and NHANES 1999–2008.
Absolute US socioeconomic health inequities for income percentile and education variously decreased (serum cholesterol, childhood height), stagnated [systolic blood pressure (SBP)], widened [body mass index (BMI), waist circumference (WC)] and in some cases reversed (age at menarche), even as on-average values rose (BMI, WC), idled (childhood height) and fell (SBP, serum cholesterol, age at menarche), with patterns often varying by race/ethnicity and socioeconomic measure; similar results occurred for relative inequities.
Health inequities need not rise as population health improves.
Introduction
One question gaining urgency, given growing joint global objectives to improve population health and reduce social inequalities in health,1–4 is what relationship exists, if any, between trends in overall average rates of health and in health inequities. Hypotheses range from improvements in on-average population health tending to be accompanied by widening relative inequities, due to health and health care getting better faster among the better off,5,6 to relationships being historically contingent, depending on government policies and the outcome(s) considered.7,8 To date, most analyses have focused on mortality, given limited long-term population data for morbidity and measured health characteristics.
We accordingly present novel data on a half-century (1959–2008) of US social inequalities in measures of body build, cardiovascular disease risk and child development, i.e. health-related somatic and physiological characteristics (hereafter referred to as ‘health status’ for short) and do so by drawing on data from the National Health Examination Surveys (NHES)9 and the successor, the National Health and Nutrition Examination Survey (NHANES).10 We evaluate the null hypothesis of no change against two prominent alternatives: first, that inequities grow as average health improves, and second, that inequities change in ways that vary by health measure and historical period.
Methods
Study participants
The NHES9 and NHANES10 are nationally representative cross-sectional samples of the US non-institutionalized civilian population and comprise the only extant long-term US individual-level data on measured health status and socioeconomic position; extensive documentation on their survey design, data collection and sampling weights are available at the NHES and NHANES website.9,10 We employed data from NHES I-III (spanning 1959–70), NHANES I-III (spanning 1971–94) and NHANES 1999–2008, an interval of 50 years.
Written informed consent was obtained from all NHES and NHANES participants.9,10 Because the analyses use solely publicly available de-identified data, our study was exempted from Institutional Review Board review by the Harvard School of Public Health Human Subjects Committee (HSC Protocol #P16105-101).
We limited analyses to the US-born non-Hispanic Black and White participants (hereafter referred to as ‘Black’ and ‘White’ with these racial/ethnic categories conceptualized as social constructs that can affect health status and health care8,11) because: (i) they are the sole racial/ethnic groups identifiable across all examinations9,10 and (ii) restriction to US-born non-Hispanics avoids confounding by immigration status.12,13 Our analyses focused on two age groups (years): children (age 6–17) and adults (age 25–74). The number of participants per racial/ethnic-age group (Table 1) spanned from a low of 681 (Black adults in NHES I) to a high of 9459 (White adults in NHANES II).
Table 1.
US-born Black non-Hispanica and White non-Hispanica adults ages 25–74 and children ages 6–17,b total N and distributionc by age, gender, adult education leveld and US family income levelse: US National Health Examination Survey (NHES) I (1959–62) through US National Health and Nutrition Examination Survey (NHANES) 2005–08
| Variable | Racial/ethnic group | NHES I (1959–62) | NHES II (1963–65) | NHES III (1966–70) | NHANES I (1971–75) | NHANES II (1976–80) | NHANES III (1988–94) | NHANES (1999–2004) | NHANES (2005–08) | ||||
|---|---|---|---|---|---|---|---|---|---|---|---|---|---|
| Number of person in survey by age (N, actual)f | US-born Black (non-Hispanic) | ||||||||||||
| adults: ages 25–74 | 681 | – | – | 2142 | 1420 | 3760 | 2123 | 1794 | |||||
| 25–34 | 176 | – | – | 502 | 313 | 1098 | 451 | 379 | |||||
| 35–44 | 185 | – | – | 460 | 212 | 1033 | 514 | 337 | |||||
| 45–54 | 162 | – | – | 313 | 194 | 546 | 426 | 367 | |||||
| 55–64 | 101 | – | – | 237 | 338 | 566 | 393 | 407 | |||||
| 65–74 | 57 | – | – | 630 | 363 | 517 | 339 | 304 | |||||
| children: ages 6–17 | – | 987 | 984 | 1001 | 643 | 2021 | 2817 | 1453 | |||||
| 6–8 | – | 520 | – | 249 | 150 | 540 | 557 | 329 | |||||
| 9–11 | – | 458 | – | 253 | 157 | 587 | 561 | 328 | |||||
| 12–14 | – | 9 | 549 | 268 | 177 | 461 | 883 | 402 | |||||
| 15–17 | – | – | 435 | 231 | 159 | 433 | 816 | 394 | |||||
| US-born White (non-Hispanic) | |||||||||||||
| adults: ages 25–74 | 4805 | – | – | 8462 | 9459 | 5215 | 5302 | 3680 | |||||
| 25–34 | 1201 | – | – | 2105 | 1876 | 1073 | 1176 | 723 | |||||
| 35–44 | 1274 | – | – | 1707 | 1345 | 1056 | 1071 | 759 | |||||
| 45–54 | 1077 | – | – | 1403 | 1306 | 912 | 1083 | 810 | |||||
| 55–64 | 748 | – | – | 1113 | 2433 | 1000 | 952 | 684 | |||||
| 65–74 | 505 | – | – | 2134 | 2499 | 1174 | 1020 | 704 | |||||
| children: ages 6–17 | – | 6100 | 5692 | 2384 | 2721 | 1595 | 2267 | 1377 | |||||
| 6–8 | – | 3048 | 0 | 548 | 595 | 449 | 460 | 338 | |||||
| 9–11 | – | 2990 | 0 | 596 | 635 | 474 | 435 | 330 | |||||
| 12–14 | – | 62 | 3038 | 646 | 715 | 332 | 686 | 324 | |||||
| 15–17 | – | 0 | 2654 | 594 | 776 | 340 | 686 | 385 | |||||
| Estimated size of sampled US population (N, weighted), in millions | US-born Black (non-Hispanic) | ||||||||||||
| adults: ages 25–74 | 9 474 912 | – | – | 9 764 897 | 7 834 232 | 14 419 418 | 16 479 939 | 18 440 813 | |||||
| children: ages 6–17 | – | 3 271 788 | 2 972 439 | 6 595 897 | 5 361 403 | 6 617 843 | 7 317 798 | 7 079 696 | |||||
| US-born White (non-Hispanic) | |||||||||||||
| adults: ages 25–74 | 81 653 747 | – | – | 67 227 106 | 63 004 229 | 105 300 000 | 113 450 000 | 116 940 000 | |||||
| children: ages 6–17 | – | 20 403 088 | 19 390 640 | 31 774 058 | 25 424 685 | 28 581 328 | 29 208 398 | 28 943 616 | |||||
| Gender distribution: women and girls by age (%) (weighted by demographic weights) | US-born Black (non-Hispanic) | ||||||||||||
| adults: ages 25–74 | 54.0 | – | – | 56.8 | 54.8 | 55.7 | 56.6 | 55.8 | |||||
| children: ages 6–17 | – | 49.8 | 50.5 | 49.3 | 49.5 | 49.5 | 49.1 | 50.0 | |||||
| (missing) | (0.0) | (0.0) | (0.0) | (0.0) | (0.0) | (0.0) | (0.0) | (0.0) | |||||
| US-born White (non-Hispanic) | |||||||||||||
| adults: ages 25–74 | 52.3 | – | – | 52.5 | 50.1 | 51.3 | 51.0 | 51.4 | |||||
| children: ages 6–17 | – | 49.1 | 49.2 | 48.0 | 48.2 | 48.2 | 49.5 | 48.8 | |||||
| (missing) | (0.0) | (0.0) | (0.0) | (0.0) | (0.0) | (0.0) | (0.0) | (0.0) | |||||
| Education distribution: adults 25–74 by level of education (%) (weighted by demographic weights) | US-born Black (non-Hispanic) | ||||||||||||
| < high school (HS) | 93.1 | – | – | 63.8 | 54.0 | 31.7 | 32.6 | 25.7 | |||||
| >=HS, <4-yr college | 3.9 | – | – | 31.7 | 38.7 | 57.4 | 54.0 | 57.1 | |||||
| >=4-yr college | 3.0 | – | – | 4.5 | 7.3 | 10.9 | 13.3 | 17.2 | |||||
| (missing) | (7.7) | – | – | (1.6) | (0.8) | (0.6) | (0.1) | (0.0) | |||||
| US-born White (non-Hispanic) | |||||||||||||
| < high school (HS) | 79.6 | – | – | 34.0 | 27.0 | 18.3 | 12.4 | 11.6 | |||||
| >=HS, <4-yr college | 7.6 | – | – | 50.9 | 54.5 | 56.7 | 57.8 | 56.8 | |||||
| >=4-yr college | 12.8 | – | – | 15.2 | 18.6 | 245.0 | 29.8 | 31.6 | |||||
| (missing) | (3.4) | – | – | (0.3) | (0.2) | (0.5) | (0.1) | (0.1) | |||||
| Income distribution (total population, all ages): family income level in relation to US family income distribution and risk of poverty (%) (weighted by demographic weights) | Phase I (1989–91) | Phase II (1991–94) | NHANES 1999–2000 | NHANES 2001–02 | NHANE S 2003–04 | NHANES 2005–06 | NHANES 2007–08 | ||||||
| US-born Black (non-Hispanic) | |||||||||||||
| Income percentile | |||||||||||||
| <20th percentile | 36.3 | 44.3 | 48.3 | 50.5 | 34.2 | 40.8 | 41.8 | 44.2 | 50.4 | 47.8 | 35.8 | 33.4 | |
| <50th percentile | 72.5 | 71.7 | 75.7 | 78.6 | 73.8 | 70.3 | 71.8 | 63.7 | 76.0 | 76.2 | 70.5 | 67.4 | |
| >=80th percentile | 7.7 | 0.9 | 6.8 | 2.4 | 5.8 | 7.3 | 8.7 | 7.5 | 9.1 | 12.2 | 16.3 | 8.7 | |
| Poverty level | |||||||||||||
| at risk of poverty | 51.4 | 62.0 | 59.1 | 56.0 | 57.6 | 49.2 | 52.2 | 44.2 | 61.1 | 60.0 | 48.4 | 45.1 | |
| above 2 x risk of poverty | 17.2 | 8.6 | 6.8 | 8.0 | 11.2 | 15.1 | 12.0 | 14.4 | 12.6 | 15.7 | 20.8 | 17.5 | |
| (missing) | (10.3) | (5.0) | (6.7) | (3.9) | (5.0) | (10.0) | (8.2) | (17.1) | (7.4) | (4.8) | (3.6) | (8.7) | |
| US-born White (non-Hispanic) | |||||||||||||
| Income percentile | |||||||||||||
| <20th percentile | 11.8 | 14.2 | 13.9 | 18.4 | 12.8 | 18.8 | 16.9 | 27.2 | 23.2 | 24.9 | 17.7 | 20.3 | |
| <50th percentile | 39.5 | 30.6 | 35.4 | 45.5 | 47.2 | 51.7 | 45.7 | 47.4 | 52.3 | 54.9 | 48.1 | 51.9 | |
| >=80th percentile | 31.1 | 18.7 | 33.4 | 10.6 | 17.8 | 23.8 | 28.3 | 21.4 | 29.1 | 26.0 | 34.4 | 21.7 | |
| Poverty level | |||||||||||||
| at risk of poverty | 19.1 | 21.4 | 20.1 | 22.5 | 27.9 | 25.9 | 23.6 | 27.2 | 33.1 | 35.2 | 28.6 | 30.3 | |
| above 2 x risk of poverty | 51.6 | 41.0 | 33.4 | 24.2 | 31.6 | 35.2 | 35.2 | 33.2 | 35.1 | 32.2 | 41.2 | 34.9 | |
| (missing) | (9.0) | (5.0) | (6.5) | (3.1) | (2.9) | (7.2) | (4.7) | (10.4) | (5.0) | (5.6) | (3.4) | (6.4) | |
aCategorization of race/ethnicity and nativity: (i) for all surveys other than NHES I, data were available on nativity; for NHES I, US census data indicate that in 1960, 94.1% of US Whites were US-born and 99.3% of US Blacks were US-born;52 (ii) for the US White population, data on Hispanic origin were available to categorize persons who were ‘White non-Hispanic’ starting with NHANES III; for NHES I, no data were available on Hispanic origin; for NHANES I, we defined ‘White non-Hispanic’ as White persons who reported the following ancestry groups: ‘German’, ‘Irish,’ ‘Italian,’ ‘French,’ ‘Polish,’ ‘Russian,’ English, ‘Jewish,’ and ‘American’ [and excluded persons who listed their ancestry as: ‘Spanish,’ ‘Mexican,’ ‘Chinese,’ ‘Japanese,’ ‘American Indian,’ ‘Negro’, ‘Other’, ‘Blank but applicable’ (only 0.4%) and ‘Don’t know’ (3%)]; and for NHANES II, we defined ‘White non-Hispanic’ as persons who reported their ancestry was ‘Other European’, such as German, French, English, Irish’ [and excluded person who listed their ancestry as: ‘countries of Central or South America’, ‘Chicano’, ‘Cuban’, ‘Mexican’, ‘Mexican American’, ‘Puerto Rican’, ‘Other Spanish’, ‘Black, Negro, or Afro-American’, ‘American Indian or Alaskan Native’, ‘Asian Pacific Islander, such as Chinese, Japanese, Korean, Phillipino’, ‘Another group not listed’ and ‘Blank but applicable’ (only 2.4%)]; (iii) for the US Black population, data on Hispanic origin were available to categorize persons who were ‘Black non-Hispanic’ from 1999 onwards; US census data indicate that the percentage of the Black population that was non-Hispanic was, in 1970, 98.6%, in 1980, 98.5% and in 1990, 97.4%.52
bAge ranges included in each survey: NHES I = 18–79 yr; NHES II = 6–11 yr; NHES III = 12–17 yr; NHANES I = 1–74 yr; NHANES II = 6 months–74 yr; NHANES III = 2 months–84 yr; NHANES 1999–2006 = up to 85 + yr; NHANES 2007–08: up to 80 + yr; for our study population, ’12–17’ refers to persons >=12 and <18 yr.
cPercent distribution are based on observed data; percent missing are based on total population (observed + missing).
dEducational level is not coded consistently across surveys.9,10 For NHES I, the ‘education level’ of the individual interviewed is recorded, but does not specify if it is the highest level attended vs completed; for NHANES I and II, the initial question asks about highest level attended, with a follow-up query about whether this level was completed, but the response has high values of missing data (13% for NHANES I, 21% for NHANES II) and of those with observed data, the majority attending a grade completed it; for all subsequent surveys, the sole question pertains to highest level completed. For all surveys but NHES I, it is possible to distinguish between persons who did not complete high school (<HS), who completed high school but did not obtain 4 or more years of college education (or higher) (>=HS, < 4 yrs college) and those who obtained at least 4 years of college education (4+ yrs college). In NHES I, the categories instead distinguish between who obtained a high school degree or lower, who obtained some to 4 yrs of college, and who obtained more than a 4 yr college education, and we treat these categories as analogous to the ones used in the other studies, since the bias introduced is conservative (because some people with higher education are placed in the lower education category).
eFor family income level, individuals’ family income is categorized in relation to their percentile location in the US national income distribution for the mid-point of each survey, as defined in the NHES and NHANES technical documentation;9,10 for surveys conducted in two phases (e.g. NHANES III) or which were conducted separately but which we combined (e.g. NHANES 1999–2000 + 2001–02 + 2003–04 and NHANES 2005–06 + 200–08), we assigned individuals the income quintile for the survey in which they were examined and then combined results across component surveys. The category ‘at risk of poverty’ is defined with the cut-point of ‘<60% below national median family income’, per standard definitions employed in the European Union;22,27 its correspondence to the US poverty level is provided in Table S1, available as Supplementary data at IJE online.
fThe mean number of participants per survey equalled 1987 and 6153 for Black and White adults and 1415 and 3162 for Black and White children, respectively, and the total across surveys equalled 11 920 Black adults, 36 923 White adults, 9 906 Black children and 22 136 White children.
Study variables
Health outcomes
Each examination obtained anthropometric and cardiovascular data using validated measurement protocols designed to ensure comparability of results over time.9,10 For adult body build, we analysed two outcomes linked to increased risk of chronic disease and key targets of US and global health policies:3,14 body mass index (BMI; kg/m2), which we computed based on the participants’ measured heights and weights, and adult waist circumference (WC; cm), available in all examinations except NHANES I and II. The two cardiovascular outcomes (analysed for adults only) were: (i) serum cholesterol (mg/dl), and (ii) systolic blood pressure (SBP; mm Hg), chosen for its greater prognostic value (compared with diastolic blood pressure) for cardiovascular mortality among adults ≥age 50.15 For serum cholesterol, values in each examination were standardized against serum with known cholesterol concentration, thereby assuring comparability over time.16 For blood pressure, the analysed data, deemed comparable across examinations,17 were based on a pre-computed average of three sitting values for NHES I, on a single sitting value for NHANES I and NHANES II, on a pre-computed average of typically three sitting values for NHANES III, NHANES 1999–2000 and 2001–02 and on an average we computed based on the three sitting values obtained for NHANES 2003–04, 2005–06 and 2007–08.
The two child development outcomes were pre-pubertal height (cm; age 6–8) and age at onset of menarche (asked only of girls age 9 and older who reported onset of menstruation).9,10 Relevant to both child and adult health status, short height and older age at menarche reflect early life adverse exposures (e.g. poor nutrition and infectious disease) that hamper growth and development,18,19 and are associated, respectively, with increased risk of haemorrhagic stroke and decreased risk of breast cancer.18,19
Socioeconomic data
For adults, we used data on both family income and education, the only two consistently available socioeconomic measures, since their associations with diverse health outcomes may be independent and can vary by time period, reflecting both different causal pathways (e.g. income as linked to economic deprivation; education as linked to health illiteracy)20,21 and changing economic trends (e.g. between 1960 and 2008, employment and earnings for adults with less than a high school degree sharply declined whereas the college wage premium increased considerably).22,23 For children, we used only data on family income, given inconsistencies in how family and/or household educational levels were assessed across examinations.
To demarcate family income quintiles, we used data from the Current Population Survey,24 whose dollars were set to 2010 values adjusted to the US Census Bureau Average Consumer Price Index Series Using Current Methods (CPI-UR-S). We then assigned each survey participant to the US yearly family income quintile (Q1: lowest; Q5: highest) that encompassed the mid-point of her/his pre-categorized family income brackets for the survey’s mid-point year, as defined in the technical documentation9,10 (see Table 1). Following standard practice, we compared persons in Q1 vs Q5 (< 20th vs >=80th percentile).21,25 A key advantage of this approach, in contrast to the US poverty line—which was initially set in the mid-1960s in relation to food (but not housing) costs and thereafter adjusted only for changes in the consumer price index20,26—is that the 20:80 contrast is based solely on each year’s income levels and, because it is scale free, can validly be compared both over time and cross-nationally.20,21,25 Sensitivity analyses using the European Union (EU) measure of ‘at risk of poverty’, equal to <60% of median income,21,27 yielded similar results (Tables S1–S3; Figure S1, available as Supplementary data at IJE online).
Data analysis
For each racial/ethnic group, we first determined each variable’s distribution based on observed values, weighted by the relevant sample weights. We also assessed the extent of missingness, which ranged from 0% for age, gender and race/ethnicity to <1% for education [except in NHES I (<8%) and NHANES II (<2%)] to under 5% for all health outcomes except age at menarche (range: 0.6% to 9.8%) and from 2.9% to 10.4% for income (Table 1; Tables S2-S3, available as Supplementary data at IJE online).
We used linear regression analysis to estimate the absolute and relative health inequities for each examination. We first imputed income and education data using the Amelia II program.28 We then used SAS PROC SURVEYREG, taking into account survey weights and design.29 To combine multiple imputation results (five data sets) we used SAS PROC MIANALYSE.29 For absolute differences, we used Stata Statistical Software to conduct meta-analyses, using weighted random effects,30 for: (i) socioeconomic inequities within each racial/ethnic group, adjusted for age and gender, and (ii) Black/White inequities, adjusted for age and gender and additionally adjusted, separately, for each socioeconomic measure. We tested for both linear trend and for heterogeneity of risk estimates (overall P-value: 2 sided),30 with the latter not assuming monotonic trends over time.
Results
Table 1 provides data on the number of the Black and White NHES and NHANES participants and their changing distributions of education and income. Throughout all surveys, Black compared with White Americans were at approximately twice the risk of poverty and, starting with NHANES I, despite increasing gains in college education, remained twice as likely to have at most a high school degree.
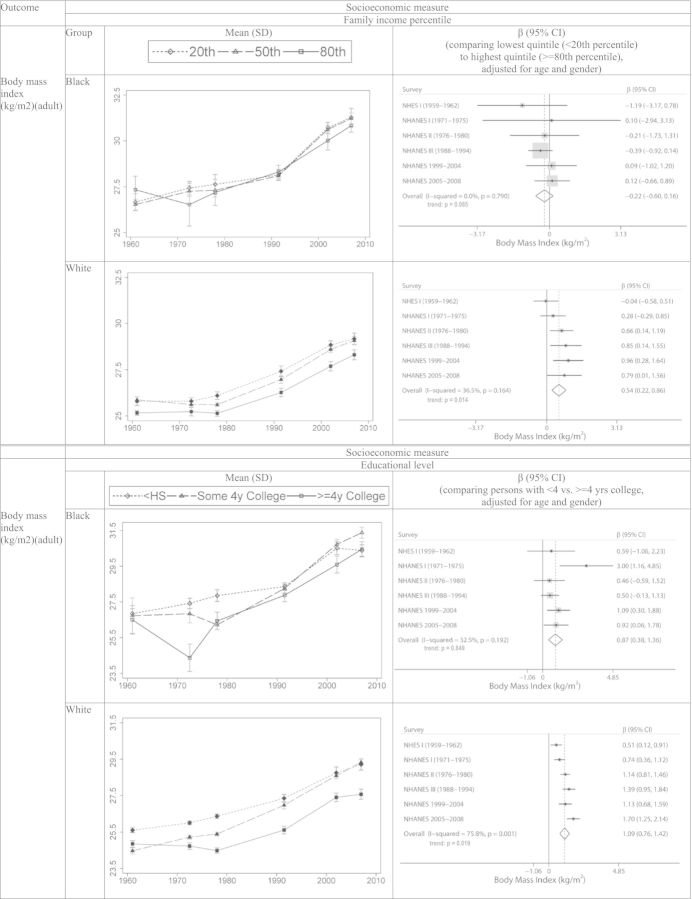
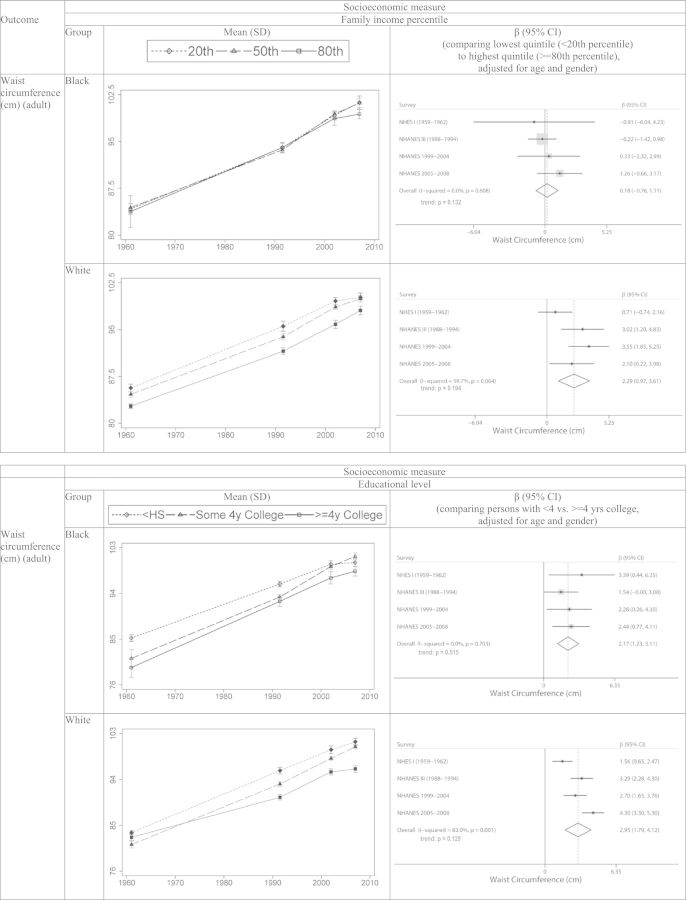
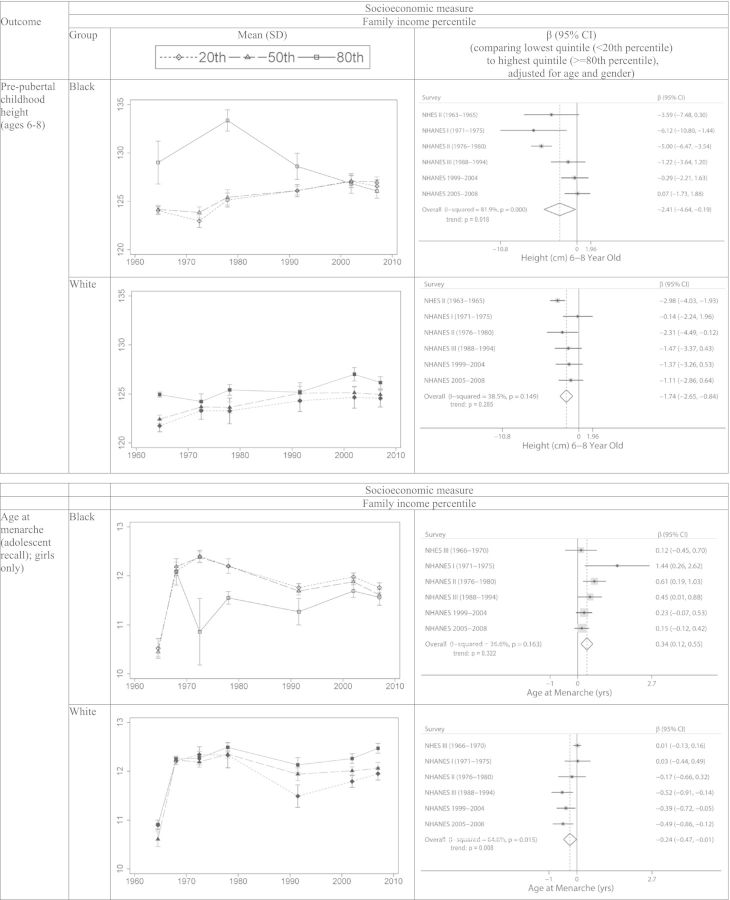
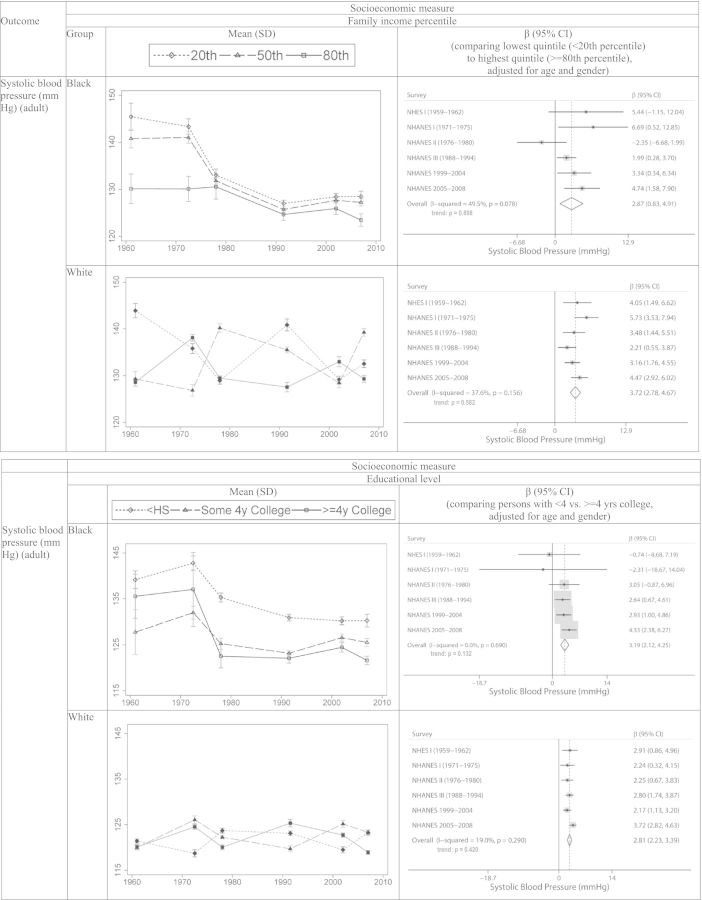
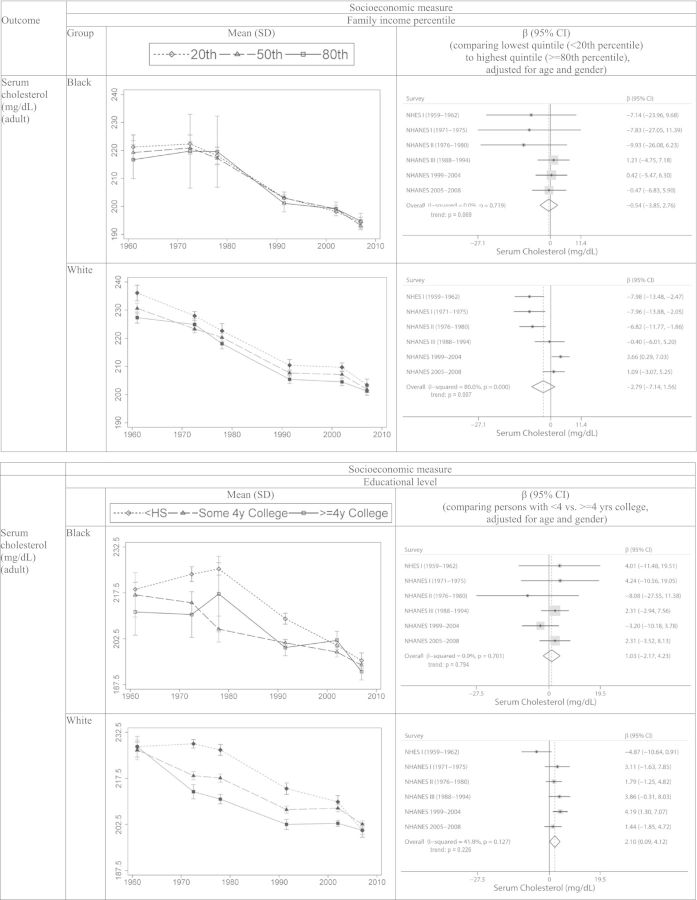
Figures 1 through 3 respectively portray results for the body build, cardiovascular and child development outcomes. For these outcomes, each figure depicts, for each socioeconomic measure: (i) the crude mean and standard deviation (SD) for each outcome, by socioeconomic group, for each survey (point estimates: in Tables S2-S3, available as Supplementary data at IJE online); and (ii) forest plots of the magnitude of the corresponding socioeconomic inequities for absolute difference, adjusted for age and gender, along with the summary estimate, and exact P-values for tests of heterogeneity and linear trend. Table 2 shows corresponding results for percent change.
Figure 1.
Body build (body mass index, waist circumference) by income percentile and by education for US-born Black and White non-Hispanic participants (adults 25–74), National Health and Examination Survey I (1959–62) through National Health and Nutrition Examination Survey 2005–08.
Figure 3.
Child development (height at age 6–8, age at menarche) by income percentile for US-born Black and White non-Hispanic participants (children 6–17), National Health and Examination Survey I (1959–62) through National Health and Nutrition Examination Survey 2005–08.
Table 2.
Relative socioeconomic inequalities (percent change, adjusted for age and gender) for (a) body build, (b) cardiovascular outcomes and (c) child development, among US-born Black and White non-Hispanic Americans, from National Health Examination Survey I (1959–62) through National Health and Nutrition Examination Surveys 2005–08
| Inequality | Percent change: beta (95% CI) |
|||||||
|---|---|---|---|---|---|---|---|---|
| (a) Body build | Body mass index (kg/m2; adult 25–74) |
Waist circumference (cm; adult 25–74) |
||||||
| Family income percentile (<20th vs ≥80th) |
Educational level (<4 yrs vs ≥4 yrs college) |
Family income percentile (<20th vs ≥80th) |
Educational level (<4 yrs vs ≥4 yrs college) |
|||||
| Black | White | Black | White | Black | White | Black | White | |
| NHES I (1959–62) | −5.5 (−14.5, 3.6) | −0.2 (−2.3, 1.9) | 2.8 (−5.0, 10.6) | 2.2 (0.5, 4.0) | −1.1 (−7.8, 5.6) | 0.8 (−0.5, 2.1) | 4.3 (0.6, 8.0) | 1.7 (0.7, 2.7) |
| NHES II (1963–65) | ||||||||
| NHES III (1966–70) | ||||||||
| NHANES I (1971–75) | 0.4 (−11.0, 11.9) | 1.1 (−1.2, 3.4) | 15.5 (9.8, 21.1) | 3.0 (1.4, 4.6) | ||||
| NHANES II (1976–80) | −1.0 (−11.1, 9.2) | 2.7 (0.6, 4.9) | 2.2 (1.0, 3.5) | 4.8 (3.3, 6.2) | ||||
| NHANES III (1998–94) | −1.7 (−4.1, 0.7) | 3.4 (0.5, 6.2) | 2.3 (−0.4, 4.9) | 5.7 (3.8, 7.6) | −0.3 (−1.8, 1.2) | 3.3 (1.3, 5.3) | 2.0 (0.1, 3.8) | 3.6 (2.5, 4.7) |
| NHANES 1999–2004 | 0.4 (−3.9, 4.7) | 3.7 (1.0, 6.4) | 4.5 (1.0, 8.1) | 4.4 (2.6, 6.2) | 0.4 (−2.5, 3.3) | 3.7 (1.9, 5.4) | 2.6 (0.2, 5.1) | 2.8 (1.7, 3.9) |
| NHANES 2005–08 | 0.5 (−2.5, 3.4) | 2.9 (−0.0, 5.8) | 3.8 (0.3, 7.2) | 6.4 (4.6, 8.2) | 1.4 (−0.7, 3.6) | 2.1 (0.2, 4.0) | 2.8 (0. 9, 4.7) | 4.4 (3.3, 5.4) |
| (b) Cardiovascular outcomes | Systolic blood pressure (mmHg; adult 25–74) |
Serum cholesterol (mg/dl; adult 25–74) |
||||||
|---|---|---|---|---|---|---|---|---|
| Family income percentile (<20th vs ≥80th) |
Educational level (<4 yrs vs ≥4 yrs college) |
Family income percentile (<20th vs ≥80th) |
Educational level (<4 yrs vs ≥4 yrs college) |
|||||
| Black | White | Black | White | Black | White | Black | White | |
| NHES I (1959–62) | 6.3 (−1.8, 14.4) | 4.3 (1.6, 7.0) | −0.8 (−9.0, 7.3) | 3.2 (0.9, 5.5) | −4.5 (−15.4, 6.4) | −5.1 (−8.6, −1.5) | 2.6 (−7.6, 12.8) | −3.0 (−6.4, 0.4) |
| NHES II (1963–65) | ||||||||
| NHES III (1966–70) | ||||||||
| NHANES I (1971–75) | 7.3 (0.5, 14.0) | 5.6 (3.4, 7.8) | −2.4 (−6.8, 2.1) | 2.2 (0.3, 4.1) | −4.8 (−15.9, 6.4) | −4.1 (−8.0, −1.6) | 2.7 (−5.0, 10.5) | 1.9 (−1.0, 4.9) |
| NHANES II (1976–80) | −2.3 (−8.0, 3.4) | 3.2 (1.3, 5.2) | 3.1 (1.7, 4.5) | 2.1 (0.6, 3.6) | −6.1 (−19.7, 7.6) | −4.4 (−7.4, −1.3) | −4.8 (−13.2, 3.7) | 1.1 (−0.8, 3.1) |
| NHANES III (1998–94) | 2.0 (0.2, 3.7) | 2.2 (0.5, 3.8) | 2.7 (0.9, 4.4) | 2.8 (1.7, 3.8) | 0.8 (−3.2, 4.8) | −0.2 (−3.7, 3.2) | 1.5 (−1.5, 4.5) | 2.4 (−0.2, 5.1) |
| NHANES 1999–2004 | 3.4 (0.2, 6.5) | 3.2 (1.8, 4.6) | 3.0 (0.9, 5.0) | 2.2 (1.1, 3.3) | 0.3 (−3.1, 3.6) | 2.0 (0.2, 3.9) | −1.8 (−5.8, 2.1) | 2.4 (0.7, 4.0) |
| NHANES 2005–08 | 4.7 (1.5, 7.8) | 4.2 (2.8, 5.7) | 4.3 (2.4, 6.2) | 3.6 (2. 7, 4.5) | −0.3 (−4.1, 3.5) | 0.6 (−1.8, 3.0) | 1.4 (−2.0, 4.8) | 0.8 (−1.1, 2.7) |
| (c) Child development | Pre-pubertal childhood height (ages 6–8) |
Age at menarche (adolescent recall; girls only) |
||||||
|---|---|---|---|---|---|---|---|---|
| Family income percentile (<20th vs ≥80th) |
Educational level (<4 yrs vs ≥4 yrs college) |
Family income percentile (<20thvs ≥80th) |
Educational level (<4 yrs vs ≥4 yrs college) |
|||||
| Black | White | Black | White | Black | White | Black | White | |
| NHES I (1959–62) | ||||||||
| NHES II (1963–65) | −4.0 (−7. 6, −0.5) | −3.4 (−4.7, −2.2) | ||||||
| NHES III (1966–70) | 1.5 (−19.6, 22.6) | 0.1 (−19.4, 19.7) | ||||||
| NHANES I (1971–75) | −4.0 (−7.2, −0.8) | −0.2 (−2.6, 2.2) | 18.4 (−13.1, 49.9) | 0.3 (−18.1, 18.6) | ||||
| NHANES II (1976–80) | −6.0 (−7.7, −4.3) | −2.6 (−4.8, −0.3) | 6.6 (−14.8, 27.9) | −1.9 (−20.9, 17.0) | ||||
| NHANES III (1998–94) | −1.5 (−4.5, 1.5) | −1.8 (−4.1, 0.5) | 6.3 (−21.1, 33.8) | −6.8 (−27.5, 13.9) | ||||
| NHANES 1999–2004 | −0.3 (−2.4, 1.8) | −1.7 (−4.1, 0.7) | 3.0 (−20.5, 26.5) | −4.1 (−21.6, 13.3) | ||||
| NHANES 2005–08 | 0.1 (−2.0, 2.2) | −1.3 (−3.3, 0.7) | 1.8 (−19.4, 23.0) | −5.6 (−23.8, 12.6) | ||||
Bold entries denote parameter estimates whose 95% CI excludes 0.
First, for body build (Figure 1), both BMI and waist circumference increased in all socioeconomic strata among both Black and White Americans. Comparing persons in the 20th (low) vs 80th (high) income percentiles, however, adverse socioeconomic inequalities (i.e. worse outcomes among those worst off) occurred only among Whites {overall difference: White = 0.54 kg/m2 [95% confidence interval (CI) 0.22, 0.86); Black = −0.17 kg/m2 [95% CI −0.60, 0.26]}, and the overall test for heterogeneity was null for both groups (White: P = 0.163; Black P = 0.814); a linear trend occurred only among the White Americans (P = 0.014). Education disparities, however, were greater, comparing persons with <4 vs >=4 years of college education [overall difference: White = 1.00 kg/m2 (95% CI 0.76, 1.42); Black = 0.87 (95% CI 0.38, 1.36)], and only among White Americans did these disparities increase over time [NHES I: 0.51 (95% CI 0.12, 0.91) vs NHANES 2005–08: 1.70 (95% CI 1.25, 2.14); overall test: P = 0.0001; test for trend: P = 0.019]; results were similar for percent change (Table 2).
For waist circumference, among White Americans the 20:80 income percentile gap rose from 0.71 cm (95% CI −0.74, 2.16) in NHES I to 2.10 (95% CI 0.96, 3.62) in NHANES 2005–08), with similar results for education [NHANES 2005–08: 2.95 cm (95% CI 1.79, 4.12); overall P = 0.001], as reflected also for percent change for education (Table 2). For Black Americans, the overall difference remained null throughout for the income measure, but for education, the overall gap equalled 2.17 cm (95% CI 1.23, 3.11), an estimate that did not vary across surveys (overall P = 0.703), with similar results for percent change (Table 2). No evidence of a linear trend occurred for either group.
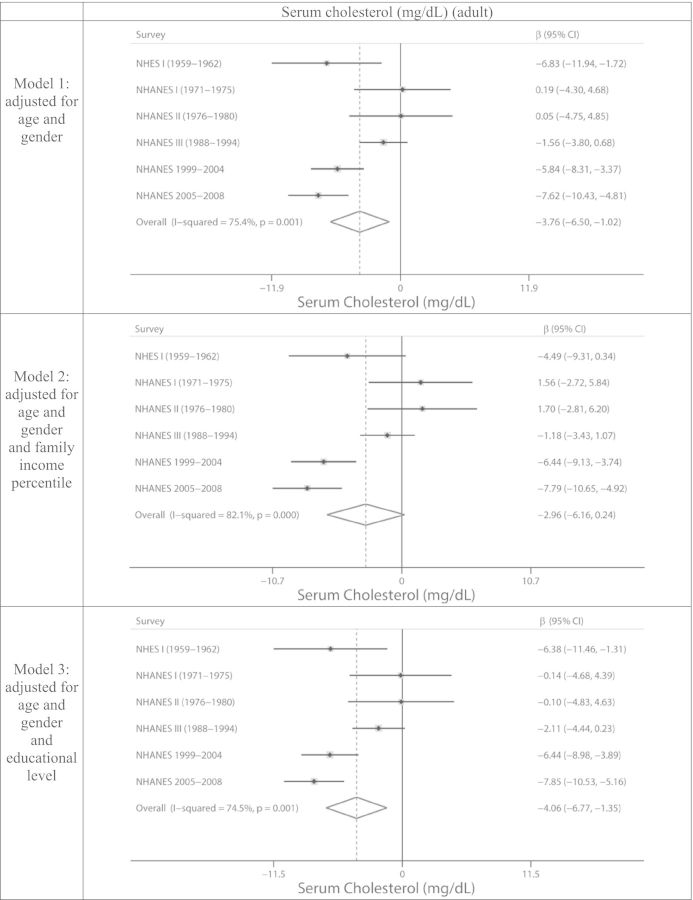
For the cardiovascular outcomes (Figure 2), although values for SBP fell sharply within all socioeconomic strata among Black Americans and for serum cholesterol among both Black and White Americans, especially between NHES I and NHANES II, SBP nevertheless adversely remained consistently about 3 mm Hg higher among person with less vs more income and education among both Black and White Americans, with no evidence of linear trend, and similar patterns held for percent change (Table 2). By contrast, no socioeconomic gradients existed for serum cholesterol among Black Americans; among White Americans, however, adverse socioeconomic inequalities decreased for income but increased for education, with the income trend showing evidence of being linear (P = 0.007), as also evident for percent change (Table 2).
Figure 2.
Cardiovascular outcomes (systolic blood pressure, serum cholesterol) by income percentile and education for US-born Black and White non-Hispanic participants (adults 25–74), National Health and Examination Survey I (1959–62) through National Health and Nutrition Examination Survey 2005–08.
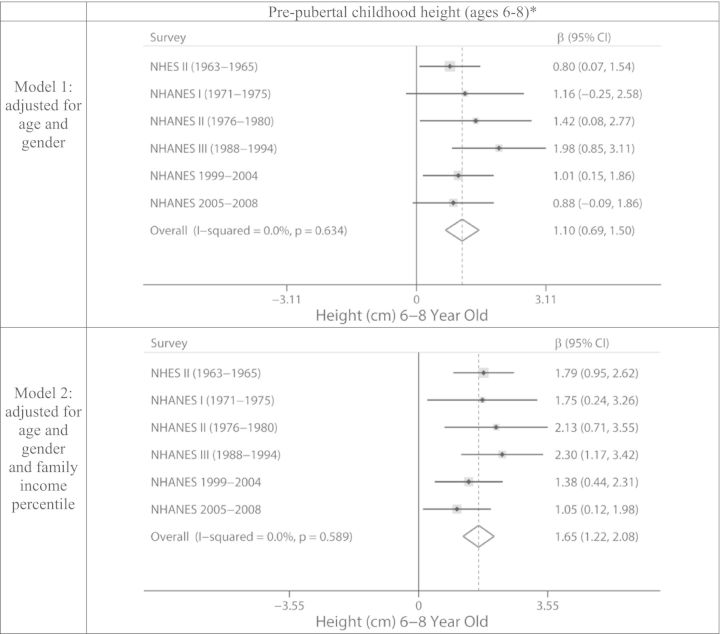
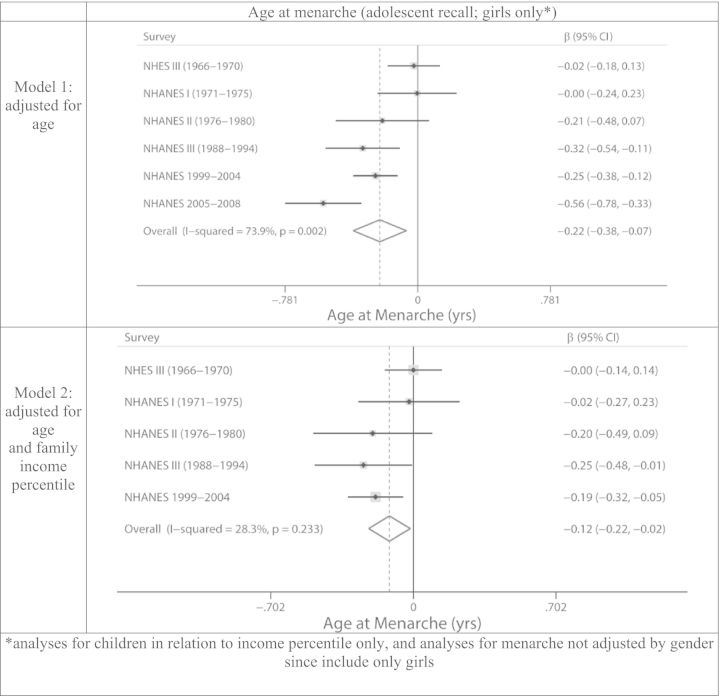
For child development (Figure 3), child height among both Blacks and Whites consistently rose in all socioeconomic groups even as the absolute socioeconomic gaps decreased, especially during the earlier years, as occurred also for percent change (Table 2). Thus, among children ages 6–8, comparing NHES II with NHANES 2005–08, the 20:80 income percentile gap shrank for Blacks from −3.59 cm (95% CI −7.48, 0.30) to 0.07 (95% CI −1.73, 1.88) (overall P = 0.000), and for Whites, from −2.98 cm (95% CI −4.03, −1.93) to −1.11 (95% CI −2.86, 0.64) (overall P = 0.149); only among Black children was there evidence of a linear trend (P = 0.018). For age at menarche as reported by girls age 9–17, no consistent temporal patterns in absolute or percent difference occurred within income strata for either Black or White girls. Even so, among Black girls, the 20:80 contrast for age at onset was consistently positive (i.e. lower income, higher age), by 0.34 years (95% CI 0.12, 0.55), whereas among the White girls, the null income difference in the early surveys became negative and by NHANES 2005–08 equalled −0.49 years (95% CI −0.86, −0.12; overall P = 0.0015; linear trend: P = 0.008) (i.e. lower income, lower age).
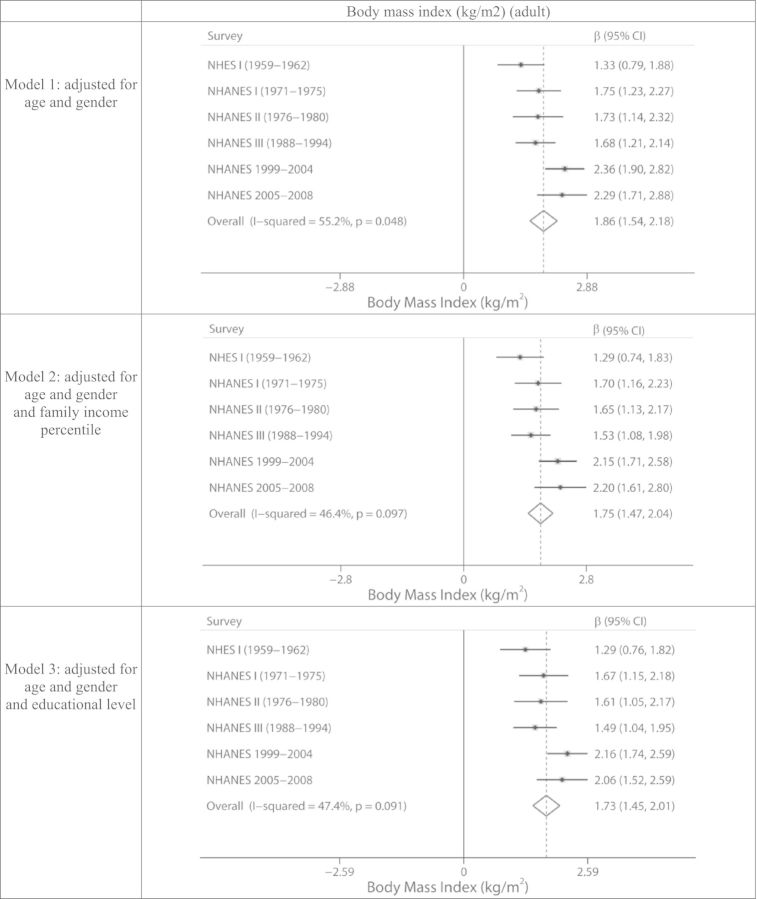
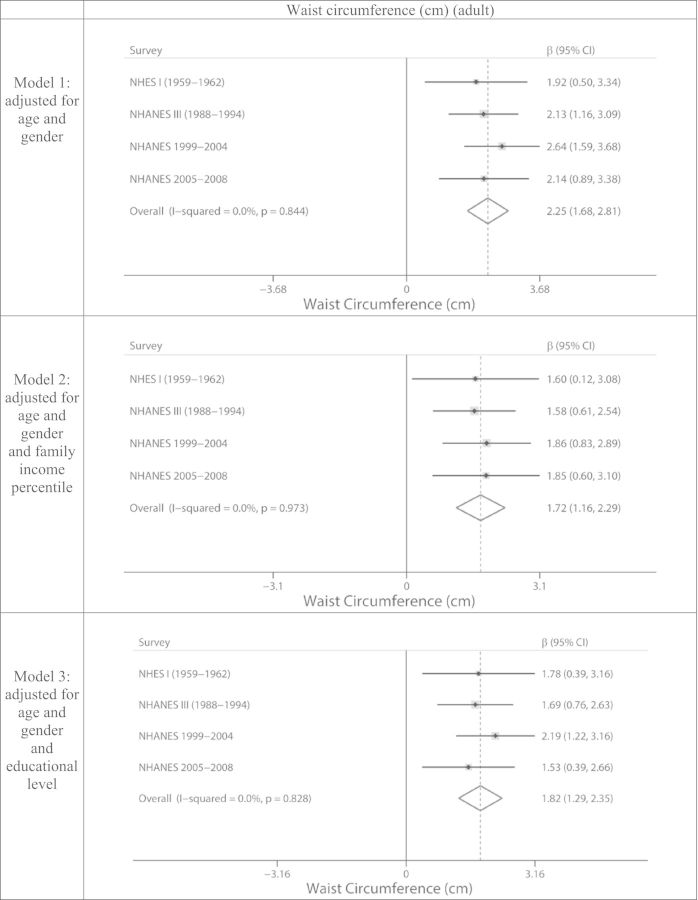
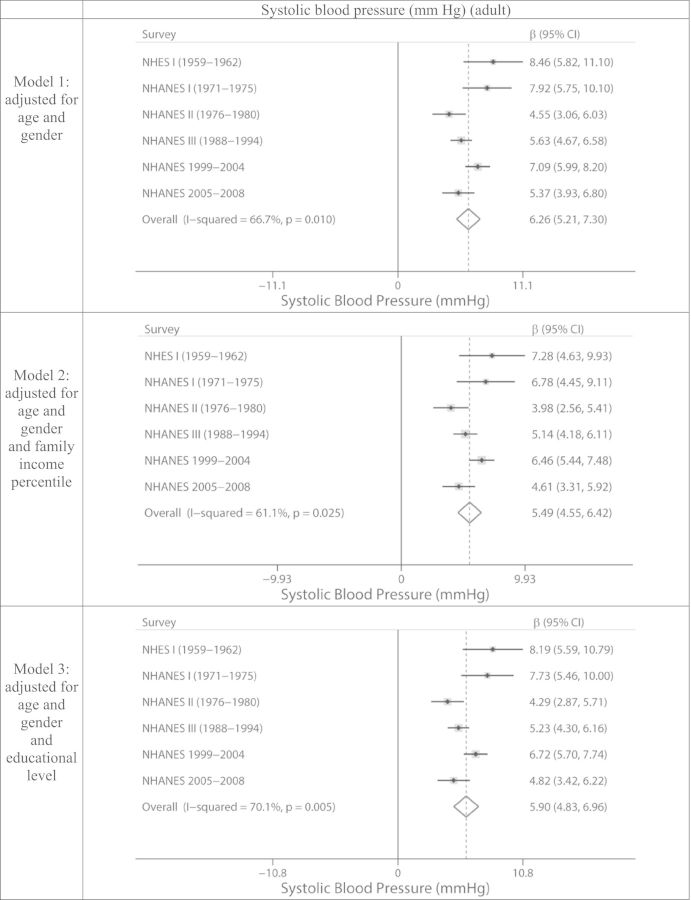
Finally, Figure 4 shows the forest plots for the Black/White comparisons, adjusted for age and gender. Additionally adjusting for socioeconomic position (regardless of measure used): only modestly attenuated the Black excess risk for BMI (increasing; overall P = 0.048), waist circumference (no change; overall P = 0.844) and SBP (decreasing; overall P = 0.010); rendered null the variably lower Black risk for serum cholesterol (overall P = 0.001); slightly increased the stable Black taller childhood height (overall P = 0.634); and left unaffected the increasingly younger Black age at menarche (overall P = 0.002).
Figure 4.
Black vs White differences for body build, cardiovascular, and child development outcomes for US-born Black and White non-Hispanic participants (adults 25–74; children –-17), National Health and Examination Survey I (1959–62) through National Health and Nutrition Examination Survey 2005–08: overall (adjusted for age and gender) and additionally adjusted for either income percentile or education. Analyses for children in relation to income percentile only, and analyses for menarche not adjusted by gender since include only girls.
Discussion
Two key findings emerge from our novel analysis of 50-year trends in US socioeconomic inequalities in measured health status among US-born Black and White non-Hispanic persons, with findings similar for absolute and relative inequities:
The magnitude of adverse socioeconomic inequalities (adjusted for age and gender) variously decreased (serum cholesterol, childhood height), stagnated (SBP), widened (BMI, WC) and in some cases reversed (age at menarche), even as on-average values rose (BMI, WC), idled (childhood height) or fell (SBP, serum cholesterol, age at menarche), with these patterns often varying by race/ethnicity and socioeconomic measure.
Adjusting for socioeconomic position only modestly altered Black/White health inequities, in ways that varied by outcome.
Thus, as hypothesized, US trends in population health and the magnitude of health inequities, for both socioeconomic position and race/ethnicity, do not neatly travel together.
Any interpretation of study findings first requires addressing study limitations and strengths. In particular, this study relied on six cross-sectional national surveys, which limits: (i) temporal comparisons, a problem offset by these periods being reasonably spaced during an interval spanning from 1959 to 2008; (ii) racial/ethnic comparisons, given data availability for the full time period for only Black and White Americans; and (iii) causal inference, albeit without affecting validity of estimates of observed health inequities. Strengths include: (i) use of nationally representative data for the US civilian non-institutionalized population; (ii) use of both income and education data, with the contrasts for income percentiles directly comparable over time and cross-nationally;20,21 and (iii) use of rigorous protocols9,10,16,17 for measuring the body build and cardiovascular outcomes thereby avoiding well-known socially-patterned biases in self-reported health [e.g. greater under-reporting of weight and over-reporting of height among person with vs without a college education;31 self-reported age at menarche, however, exhibits reliable recall, especially among adolescents (r > 0.8)32].
Moreover, our novel approach of using forest plots to compare estimates of absolute social inequalities in health across the surveys notably kept intact the surveys’ sample design and weighting methodology (as did the tests for trend for relative difference), an improvement over the handful of studies that have analysed NHES with both older and more recent NHANES data, but which disregarded these critical design elements.13,33,34 To our knowledge, meta-analysis has not been conducted before across the full range of NHES and NHANES surveys encompassed in our study, nor has it been used to test for heterogeneity in estimates of health inequities over time. Suggesting our approach is reasonable, however, other recent investigations have used meta-analysis to compare estimates of socioeconomic inequities in health across studies35,36 and to test heterogeneity of effect estimates over time.37
Together, the results attest to the importance of determinants of health inequities both within and outside the healthcare system1–4,38 and to the value of analysing multiple outcomes.4,7,8 The observed trends in levels and socioeconomic inequities in SBP and serum cholesterol among both Black and White Americans, for example, plausibly reflect changing availability of and access to effective treatments, involving introduction of effective antihypertensive medication in the 1950s17 and of statins in the 1980s,39 as aided by establishment of Medicare and Medicaid and desegregation of US medical facilities in the mid-1960s,40 but hindered by cut-backs in Medicaid and rising lack of health insurance in the more recent periods.4,6 One implication is that the health equity impact of new technologies may depend on context, counter to hypotheses suggesting technological innovations tend to increase health inequities.5
The concurrent rapid changes in body build, among both adults and children, at a pace considered high by evolutionary biologists for somatic traits,12 in turn not only likely reflect dramatic shifts in food production, marketing and consumption,41 but also societal changes in work and transportation (e.g. increasingly sedentary jobs across all occupations and greater use of cars42). Life-course implications include the observed decline, but not elimination, in the socioeconomic gap in childhood height (lower income, shorter height), especially among the Black children, and the elimination of a socioeconomic gap in age at menarche (lower income, higher age), including its reversal among the White girls only.12,13,34,43,44 Moreover, although we observed that height at ages 6–8 was on average taller among the Black compared with White children, even after adjusting for income, other research on attained adult height indicates that among US adults, Black men and women are on average shorter than their White counterparts,13 underscoring that social conditions after age 8 are germane to adult height.
Lastly, the modest effect of adjusting for either income or education on the observed and heterogeneous Black/White absolute differences in measured health status likely reflects both the paucity of socioeconomic measures in NHES and NHANES and the absence of data on racial discrimination.9,10 Had there been data available on wealth, for which Black/White inequities are much larger,20,45–49 we might have seen a greater effect of adjusting for socioeconomic position on observed Black/White disparities, as has been reported in other research.46 Nor could we control for the adverse health impact, within and across socioeconomic strata, of institutional and individual-level racial discrimination.47–50
In conclusion, our long-term data on trends in socioeconomic inequities in measured health status challenge assumptions that increasing health inequities necessarily accompany improvements in population health.5,6 They additionally affirm the need to reckon with the joint realities of socioeconomic and racial/ethnic inequality: an individual is not one day Black or White, and another day a college graduate or lacking a high school diploma; both matter.11,20,45–49 Relevant to not only the US but other countries,51 the broader implication is that adequate analysis of population health and health inequities requires attention to long-term trends, situated in their societal context, so as not to be misled into thinking current patterns are inevitable.
Supplementary Data
Supplementary data are available at IJE online.
Funding
This work was supported by the National Institute of Child Health and Human Development (NICHD) at the National Institutes of Health [grant number 1 R21 HD060828 to N.K.].
The funder (NIH) had no role in: the design and conduct of the study; collection, management, analysis or interpretation of the data; preparation, review or approval of the manuscript; or decision to submit the manuscript for publication.
Author contributions
All authors meet the International Committee of Medical Journal Editors (ICMJE) criteria for being an author, since all: (i) all have made ‘substantial contribution to conception and design, or acquisition of the data, or analysis and interpretation of the data’; (ii) all have participated in ‘drafting the article or revising it critically for important intellectual content’; and (ii) all have provided ‘final approval of the version to be published.’ Specifically: N.K.: conceived the study, oversaw data acquisition, guided data analysis, led interpretation of results, drafted the manuscript and has approved the final version to be published; A.K.: conducted the statistical analyses, assisted with acquiring the data and managing the database, contributed to interpretation of results, assisted with manuscript preparation and has approved the final version to be published; P.D.W.: acquired the data and assisted with managing the database, contributed to conducting the statistical analyses, assisted with producing the figures, contributed to interpreting results, assisted with manuscript preparation and has approved the final version to be published; J.T.C.: contributed to study design, assisted with acquiring the data and managing the database, advised on the statistical analyses, contributed to interpreting the results, assisted with manuscript preparation and has approved the final version to be published; J.B.: contributed to study design, advised on statistical analyses, contributed to interpreting the results, assisted with manuscript preparation and has approved the final version to be published; and M.K.: assisted with data analysis and producing the figures, contributed to interpreting the results, assisted with manuscript preparation and has approved the final version to be published. The principal investigator, N.K., had full access to all the data in the study and takes responsibility for the integrity of the data and the accuracy of the data analysis. All co-authors were involved in the data analysis and no one outside the co-authors was involved with the study (from data acquisition to analysis to manuscript preparation) in any manner whatsoever.
Conflict of interest: None declared.
Supplementary Material
References
- 1.Rio Political Declaration on Social Determinants of Health. World Conference on Social Determinants of Health, Rio de Janiero, Brazil, 19–21 October 2011. Sponsored by the World Health Organization.http://www.who.int/sdhconference/declaration/Rio_political_declaration.pdf (19 November 2013, date last accessed). [Google Scholar]
- 2.Helsinki Statement on Health in All Policies. The 8th Global Conference on Health Promotion, Helsinki, Finland, 10–14 June 2013. Co-sponsored by the World Health Organization and the Ministry of Social Affairs and Health, Finland.http://www.healthpromotion2013.org/images/8GCHP_Helsinki_Statement.pdf (19 November 2013, date last accessed). [Google Scholar]
- 3.United Nations. Political Declaration of the High-Level Meeting of the General Assembly on the Prevention and Control of Non-Communicable Diseases. 2011. http://www.who.int/nmh/events/un_ncd_summit2011/political_declaration_en.pdf (22 August 2013, date last accessed). [Google Scholar]
- 4.Bleich SN, Jarlenski MP, Bell CN, LaVeist TA. Health inequalities: trends, progress, policy. Annu Rev Public Health 2012;33:7–40. [DOI] [PMC free article] [PubMed] [Google Scholar]
- 5.Cutler D, Deaton A, Lleras-Muney A. The determinants of mortality. J Econ Perspect 2006;20:97–120. [Google Scholar]
- 6.Woolf S, Aaron L. (eds). Shorter Lives, Poorer Health: US Health in International Perspective. Washington, DC: National Academies Press, 2013. [PubMed] [Google Scholar]
- 7.Krieger N, Rehkopf DH, Chen JT, Waterman PD, Marcelli E, Kennedy M. The fall and rise of inequities in US premature mortality: 1960–2002. PLoS Med 2008;5:e46. [DOI] [PMC free article] [PubMed] [Google Scholar]
- 8.Kunitz SJ. The Health of Populations: General Theories and Particular Realities. New York: Oxford University Press, 2006. [Google Scholar]
- 9.National Center for Health Statistics. NHES I-III Data Files. http://www.cdc.gov/nchs/nhanes/cyclei_iii.htm (22 August 2013, date last accessed). [Google Scholar]
- 10.National Center for Health Statistics. National Health and Nutrition Examinationination Survey (NHANES). http://www.cdc.gov/nchs/nhanes.htm (22 August 2013, date last accessed). [Google Scholar]
- 11.Krieger N. Epidemiology and the People’s Health: Theory and Context. New York: Oxford University Press, 2011. [Google Scholar]
- 12.Krieger N, Chen JT, Waterman PD, Kosheleva A, Beckfield J. History, haldanes, and health inequities: exploring phenotypic changes in body size by generation and income level among the US-born White and Black non-Hispanic populations, 1959–1962 to 2005–2008. Int J Epidemiol 2013;42:281–95. [DOI] [PMC free article] [PubMed] [Google Scholar]
- 13.Komlos J, Lauderdale BE. Underperformance in affluence: the remarkable relative decline in U.S. heights in the second half of the 20th century. Soc Sci Q 2007;88:283–305. [Google Scholar]
- 14. U.S. Department of Health and Human Services, Office of Disease Prevention and Health Promotion. Healthy People 2020. Washington, DC, 2011. http://healthypeople.gov/2020/ (22 August 2013, date last accessed).
- 15.Chobanian AV, Bakris GL, Black HR, et al. The seventh report of the Joint National Committee on prevention, detection, evaluation, and treatment of high blood pressure: the JNC 7 report. JAMA 2003;289:2560–72. [DOI] [PubMed] [Google Scholar]
- 16.Carroll MD, Lacher DA, Sorlie PD, et al. Trends in serum lipids and lipoproteins of adults, 1960–2002. JAMA 2005;294:1773–81. [DOI] [PubMed] [Google Scholar]
- 17.Burt VL, Cutler JA, Higgins M, et al. Trends in the prevalence, awareness, treatment, and control of hypertension in the adult US population data from the Health Examination Surveys, 1960 to 1991. Hypertension 1995;26:60–69 Erratum in: Hypertension 1996;27:1192. [DOI] [PubMed] [Google Scholar]
- 18.Kuh D, Ben-Shlomo Y. (eds). A Life Course Approach to Chronic Disease Epidemiology. 2nd edn New York: Oxford University Press, 2004. [Google Scholar]
- 19.Krieger N, Davey Smith G. ‘Bodies count’ and body counts: social epidemiology and embodying inequality. Epidemiol Rev 2004;26:92–103. [DOI] [PubMed] [Google Scholar]
- 20.Krieger N, Williams DR, Moss NE. Measuring social class in US public health research: concepts, methodologies and guidelines. Annu Rev Public Health 1997;18:341–78. [DOI] [PubMed] [Google Scholar]
- 21.Shaw M, Galobardes B, Lawlor DA, Lynch J, Wheeler B, Davey Smith G. The Handbook of Inequality and Socioeconomic Position: Concepts and Measures. Bristol, UK: The Policy Press, 2007. [Google Scholar]
- 22.Chen JT, Beckfield J, Waterman PD, Krieger N. Can changes in the distributions of and associations between education and income bias temporal comparisons of health inequities? – an exploration with causal graphs and simulations. Am J Epidemiol 2013;177:870–81. [DOI] [PMC free article] [PubMed] [Google Scholar]
- 23.Goldin C, Katz LF. The race between education and technology: the evolution of U.S. educational wage differentials, 1890 to 2005. NBER working paper No. 12984, 2007. http://www.nber.org.ezp-prod1.hul.harvard.edu/papers/w12984.pdf (22 August 2013, date last accessed). [Google Scholar]
- 24.US Census Bureau . Income Data, Historical Tables, Family Income. http://www.census.gov/hhes/www/income/data/historical/families/ (22 August 2013, date last accessed). [Google Scholar]
- 25.Gottschalk P, Smeeding TM. Cross-national comparisons of earnings and income inequality. J Econ Lit 1997;35:633–87. [Google Scholar]
- 26.Fisher GM. Development of the Orshansky poverty thresholds and their subsequent history as the official U.S. poverty measure. Washington, DC: US Census Bureau, 1977. [Google Scholar]
- 27.EUROSTAT. Glossary: At-risk-of-poverty Rate (2013) . http://epp.eurostat.ec.europa.eu/statistics_explained/index.php/Glossary:At-risk-of-poverty_threshold (22 August 2013, date last accessed). [Google Scholar]
- 28.King G, Honaker J, Joseph A, Scheve K. Analysing incomplete political science data: an alternative algorithm for multiple imputation. Am Pol Sci Rev 2001;95:49–69. [Google Scholar]
- 29. SAS/STAT(R)9.2. User’s Guide. 2nd edn. 2010. http://www.sas.com/index.html (22 August 2013, date last accessed).
- 30.Harris RJ, Bradburn MJ, Deeks JJ, Harbord RM, Altman DG, Sterne CJ. metan: fixed- and random-effects meta-analysis. Stata J 2008;8:3–28. [Google Scholar]
- 31.Stommel M, Schoenborn CA. Accuracy and usefulness of BMI measures based on self-reported weight and height: findings from the NHANES & NHIS 2001–2006. BMC Public Health 2009;9:421. [DOI] [PMC free article] [PubMed] [Google Scholar]
- 32.Koprowski C, Coates RJ, Bernstein L. Ability of young women to recall past body size and age at menarche. Obes Res 2001;9:478–85. [DOI] [PubMed] [Google Scholar]
- 33.Goff DC, Jr, Gillespie C, Howard G, Labarthe DR. Is the obesity epidemic reversing favorable trends in blood pressure? Evidence from cohorts born between 1890 and 1990 in the United States. Ann Epidemiol 2012;22:554–61. [DOI] [PubMed] [Google Scholar]
- 34.Ljungvall Å, Zimmerman FJ. Bigger bodies: Long-term trends and disparities in obesity and body-mass index among U.S. adults, 1960–2008. Soc Sci Med 2012;75:109–19. [DOI] [PubMed] [Google Scholar]
- 35.Boillot A, El Halabi B, Batty GD, Rangé H, Czernichow S, Bouchard P. Education as a predictor of chronic periodontitis: A systematic review with meta-analysis population-based studies. PLoS One 2011;6:e21508. [DOI] [PMC free article] [PubMed] [Google Scholar]
- 36.Brion M-JA, Lawlor DA, Matijasevich A. What are the causal effects of breastfeeding on IQ, obesity and blood pressure? Evidence from comparing high-income with middle-income cohorts. Int J Epidemiol 2011;40:670–80. [DOI] [PMC free article] [PubMed] [Google Scholar]
- 37.Jordan SJ, Nagle CM, Coory MD, et al. Has the association between hysterectomy and ovarian cancer changed over time? A systematic review and meta-analysis. Eur J Cancer 2013;49:3638–47. [DOI] [PubMed] [Google Scholar]
- 38.Shortell SM. Bridging the divide between health and health care. JAMA 2013;309:1121–22. [DOI] [PubMed] [Google Scholar]
- 39.Tobert JA. Lovastatin and beyond: the history of the HMB-CoA reductase inhibitors. Nat Rev Drug Discov 2003;2:517–28. [DOI] [PubMed] [Google Scholar]
- 40.Smith DB. Racial and ethnic health disparities and the unfinished Civil Rights agenda. Health Affairs 2005;24:317–24. [DOI] [PubMed] [Google Scholar]
- 41.Zimmerman FJ. Using marketing muscle to sell fat: the rise of obesity in the modern economy. Annu Rev Public Health 2011;32:285–306. [DOI] [PubMed] [Google Scholar]
- 42.Brownson R, Boehmer TK, Luke DA. Declining rates of physical activity in the United States: what are the contributors? Annu Rev Public Health 2005;26:421–43. [DOI] [PubMed] [Google Scholar]
- 43.Troiano RP, Flegal KM. Overweight children and adolescents: description, epidemiology, and demographics. Pediatrics 1998;101:497–504. [PubMed] [Google Scholar]
- 44.Allison CM, Hyde JS. Early menarche: confluence of biological and contextual factors. Sex Roles 2013;68:55–64. [Google Scholar]
- 45.Taylor P, Kochar R, Fry R. Twenty-to-one: Wealth Gap Rises to Record Highs Between Whites, Blacks, and Hispanics . 2011. http://www.pewsocialtrends.org/files/2011/07/SDT-Wealth-Report_7-26-11_FINAL.pdf (22 August 2013, date last accessed). [Google Scholar]
- 46.Do DP, Frank R, Finch BK. Does SES explain more of the Black/White health gap than we thought? Revisiting our approach toward understanding racial disparities in health. Soc Sci Med 2012;74:1385–93. [DOI] [PubMed] [Google Scholar]
- 47.Krieger N. Discrimination and health inequities. In: Berkman L, Kawachi I, Glymour M. (eds). Social Epidemiology. 2nd edn New York: Oxford University Press; (in press). [Google Scholar]
- 48.Williams DR, Mohammed SA, Leavell J, Collins C. Race, socioeconomic status, and health: complexities, ongoing challenges, and research opportunities. Annals N Y Acad Sci 2010;1186:69–101. [DOI] [PMC free article] [PubMed] [Google Scholar]
- 49.Blank RM, Babady R, Citro CF. (eds). Measuring Racial Discrimination. National Research Council. Washington, DC: National Academies Press, 2004. [Google Scholar]
- 50.Smedley BD, Stith AY, Nelson AR. (eds). Unequal Treatment: Confronting Racial and Ethnic Disparities in Health Care. Institute of Medicine. Washington, DC: National Academies Press, 2003. [PubMed] [Google Scholar]
- 51.World Health Organization. Closing the Gap in a Generation: Health Equity Through Action on the Social Determinants of Health . Final report of the Commission on Social Determinants of Health. Geneva: World Health Organization, 2008. [Google Scholar]
- 52.Gibson C, Jun K. Historical census statistics on the foreign-born population of the United States: 1850–2000. U.S. Census Bureau, Population Division, Working Paper No. 81. Washington, DC: US Census Bureau, 2006. [Google Scholar]
Associated Data
This section collects any data citations, data availability statements, or supplementary materials included in this article.


