

Abstract
Background: Epidemiological and clinical studies suggest comorbidity between prostate cancer (PCA) and cardiovascular disease (CVD) risk factors. However, the relationship between these two phenotypes is still not well understood. Here we sought to identify shared genetic loci between PCA and CVD risk factors.
Methods: We applied a genetic epidemiology method based on conjunction false discovery rate (FDR) that combines summary statistics from different genome-wide association studies (GWAS), and allows identification of genetic overlap between two phenotypes. We evaluated summary statistics from large, multi-centre GWA studies of PCA (n = 50 000) and CVD risk factors (n = 200 000) [triglycerides (TG), low-density lipoprotein (LDL) cholesterol and high-density lipoprotein (HDL) cholesterol, systolic blood pressure, body mass index, waist-hip ratio and type 2 diabetes (T2D)]. Enrichment of single nucleotide polymorphisms (SNPs) associated with PCA and CVD risk factors was assessed with conditional quantile-quantile plots and the Anderson-Darling test. Moreover, we pinpointed shared loci using conjunction FDR.
Results: We found the strongest enrichment of P-values in PCA was conditional on LDL and conditional on TG. In contrast, we found only weak enrichment conditional on HDL or conditional on the other traits investigated. Conjunction FDR identified altogether 17 loci; 10 loci were associated with PCA and LDL, 3 loci were associated with PCA and TG and additionally 4 loci were associated with PCA, LDL and TG jointly (conjunction FDR < 0.01). For T2D, we detected one locus adjacent to HNF1B.
Conclusions: We found polygenic overlap between PCA predisposition and blood lipids, in particular LDL and TG, and identified 17 pleiotropic gene loci between PCA and LDL, and PCA and TG, respectively. These findings provide novel pathobiological insights and may have implications for trials using targeting lipid-lowering agents in a prevention or cancer setting.
Keywords: Prostate cancer, blood lipids, cholesterol, type 2 diabetes, genetic epidemiology, pleiotropy
Key Messages.
Epidemiological and clinical studies suggest comorbidity between prostate cancer and cardiovascular disease risk factors.
The relationship between these two phenotypes is still not well understood.
We used an established genetic epidemiology framework to show polygenic overlap between PCA predisposition and blood lipids, in particular triglycerides and low-density lipoprotein cholesterol.
This FDR-based framework allowed us to identify 17 pleiotropic gene loci between prostate cancer and those two blood lipids.
Introduction
Prostate cancer (PCA) is the most common cancer in men in Europe and the USA. There are numerous examples of both positive and negative risk associations between cardiovascular (CVD) risk factors and PCA risk. For example, some studies have reported a strong inverse correlation between type 2 diabetes (T2D) and PCA.1 Others have suggested that saturated animal fats and high general fat consumption are positively associated with PCA.2 PCA has also been associated with high dairy consumption, perhaps mediated through calcium levels.3 Many of these dietary factors are also linked to cardiovascular disease (CVD) risk. Systolic blood pressure (SBP),4 low-density lipoprotein cholesterol (LDL),5 high-density lipoprotein cholesterol (HDL),5 tryglycerides (TG),5 waist/hip ratio (WHR)6 and body mass index (BMI)7 are traits associated with CVD risk and collectively classified as metabolic syndrome.8 In a prospective CVD prevention study (Oslo I), approximately 16 000 men were recruited and 6500 were followed up for 26 years.9 The features of metabolic syndrome [high BMI, high non-fasting glucose, high TG and hypertension (i.e. high blood pressure)] were significant risk contributors to PCA incidence during the follow-up period.10 Subsequently, genome-wide association studies (GWAS) datasets have been generated to identify genetic risk factors contributing to T2D, PCA and metabolic syndrome traits. These datasets provide us with the unique possibility of seeking genetic risk factors across diseases.
The increasing prevalence of obesity, diabetes, PCA and CVD within Western populations creates enormous socioeconomic challenges.11 Consequently identifying shared risk factors, and ultimately biological intervention points, may help to tackle this challenge in the most effective manner. With the exception of the association between PCA and T2D,12 no single genetic epidemiology study has attempted to define common genetic risk factors for PCA and these other traits. Here, we investigated genetic pleiotropy (defined as a single gene or variant being associated with more than one distinct phenotype13) between PCA and several CVD risk factors. We employed a pleiotropy method that has successfully identified previously unsuspected shared genetic risk loci for schizophrenia and bipolar disorder,14 schizophrenia and CVD traits,15 and inflammatory bowel disease and primary sclerosing cholangitis.16 In particular, we found polygenic overlap between PCA and LDL and TG, respectively. This is the first time that this genetic association has been observed. Consequently, this association argues for more extensive and highly powered studies to identify more of the common genetic risk between PCA and blood lipids. We pinpointed 17 genomic locations that are shared between PCA and LDL, and PCA and TG, respectively
Materials and Methods
GWAS samples
We obtained complete GWAS summary statistics (two-tailed P-values) from public access websites or through collaboration with investigators. The summary statistics were based on GWAS for T2D17 (n = 149 821), SBP4 (n = 203 056), LDL, HDL, TG5 (n = 188 577), WHR6 (n = 77 167) and BMI7 (n = 123 865). The PCA summary statistics were obtained from the PRACTICAL component from the iCOGS study18 (n = 49 346) that used a custom Illumina array with 211 155 SNPs genotyped. Additionally, we used summary statistics on PCA from a smaller independent UK sample19 (n = 3748); for details see Supplementary Table 1, available as Supplementary data at IJE online. All P-values were corrected for inflation using the genomic control procedure described earlier,20 and for overlap in samples (n = 1111 for PCA and LDL, HDL, TG and SBP, respectively, and n = 1923 for PCA and BMI).21
Statistical analyses
Quantile-quantile (Q-Q) plots are tools for visualizing the distribution of P-values. In genomics they are used to depict over-abundance of low P-values compared with that expected by chance, also termed ‘enrichment’. We used conditional Q-Q plots to investigate if enrichment in the primary phenotype (PCA) is related to an auxiliary measure; here we conditioned on the significance in a second phenotype (CVD risk factor). Enrichment is reflected in a leftward deflection in the Q-Q plot. To assess the significance of enrichment we computed Q-Q plots and the respective confidence intervals based on a bootstrapping scheme with 100 replications that uses ‘pruning’ (r2 >0.2) to ensure that all SNPs contributing in one bootstrapping round were independent. Moreover, we used the Anderson–Darling test22 to test for polygenic overlap between two traits, i.e. if a second trait (CVD risk factor) stratifies the PCA P-values so distinctively that the resulting subsets have different distributions. More specifically, we tested the strata represented in the Q-Q plots, i.e. all SNPs with low P-values in the second trait (-log10 P-value >3, >2 and >1) against the depleted category (-log10 P-value < 1). Again we used the same bootstrapping scheme to ensure independence among SNPs. To account for multiple testing, we adjusted the P-values using the Bonferroni correction for all seven traits and all three strata (in total 21 tests). Of note, the Anderson–Darling test is not suitable to detect if there is one or just a few pleiotropic loci present. It is devised to detect larger shifts between distributions that can only occur when a larger number of SNPs is driving the deflection.
To pinpoint specific loci, we computed conjunction false discovery rates (FDRs), a statistical framework that is well suited to a genetic epidemiology approach to investigate genetic pleiotropy.14,15 The standard FDR framework is based on a mixture model following the assumption that SNPs are either associated with the phenotype (non-null) or are not related (null SNPs). The FDR is then the posterior probability of the SNP being null given its P-value is as small as or smaller than the observed one. An extension of the standard FDR is the conditional FDR, which can be used to incorporate information from GWAS summary statistics of a second phenotype. The conditional FDR is defined as the posterior probability of a SNP being null in the first phenotype given that the P-values in the first and second phenotype are as small as or smaller than the observed ones. It is crucial to note that ranking SNPs by FDR or by P-values is equivalent, in that both give the same ordering of SNPs. In contrast, ranking SNPs according to conditional FDR re-orders the SNPs, and results in a different list as a ranking based on P-values if and only if the primary and second phenotype are genetically related.
Low values in conditional FDR can be driven by association with both phenotypes or with the primary phenotype only. To detect true pleiotropic signal we computed the conjunction FDR, defined as the probability that a SNP is null for either phenotype or for both phenotypes simultaneously given its P-value in both phenotypes are as small or smaller as the observed ones. We aimed to keep an overall FDR of 0.05, which is equivalent with 5 expected false discoveries per 100 reported discoveries. Additionally, we constructed Manhattan plots based on the ranking of conjunction FDR to illustrate the genomic location. Detailed information on conditional Q-Q plots with confidence intervals, Manhattan plots and conditional and conjunction FDR, especially on the estimation, the bootstrapping scheme, simulation results and a comparison of different approaches to detect pleiotropy, can be found in the Supplementary data (available at IJE online).
Results
In order to assess pleiotropic enrichment between PCA and each of the traits, we used a two-step analysis strategy. First, we visually inspected enrichment via conditional Q-Q plots, and used confidence intervals and the Anderson–Darling test to delineate the phenotypes with polygenic overlap. Next, using conjunction FDR, we further evaluated these polygenic traits in a secondary analysis to identify overlapping loci. In each step we adjusted for multiple testing using a Bonferroni-type correction with the respective number of traits being under consideration.
Q-Q plots of PCA SNPs conditioned on associated CVD risk factors
Conditional Q-Q plots for PCA conditioned on nominal P-values of association with LDL (PCA|LDL, Figure 1A) showed enrichment across different levels of significance for LDL. The earlier departure from the null line (leftward shift) suggests a greater proportion of true associations for a given nominal PCA P-value. Successive leftward shifts for decreasing nominal LDL P-values indicate that the proportion of non-null SNPs varies considerably across different levels of association with LDL. In addition, we plotted the confidence intervals (Supplementary Figure 2, available as Supplementary data at IJE online) of the Q-Q plots for the condition with the largest enrichment in LDL (-log10 P-value > 3) vs the depleted category (-log10 P-value < 1), and found that they were non-overlapping for a wide range of P-values in PCA, i.e. between –log10 P-value of 2 to 3.5. Furthermore, a similar pattern can be seen for PCA|TG (Figure 1C). For T2D (Figure 1D), we only observed modest enrichment of P-values in PCA (PCA|T2D), which was driven by a few loci only. In contrast to the other blood lipid traits, we observed only weak enrichment in PCA conditioning on HDL (PCA|HDL, Figure 1B). The remaining conditional Q-Q plots also showed only weak enrichment (Supplementary Figure 1, available as Supplementary data at IJE online).
Figure 1.

Conditional Q-Q plots : PCA | CVD factors (LDL, HDL, TG, T2D). ‘Conditional Q-Q plot’ of nominal vs empirical -log10 P-values (corrected for inflation) in prostate cancer (PCA) below the standard GWAS threshold of -log10 P-values equal to 7.3 (equals P-values above 5 x 10⁻⁸) as a function of significance of association with (A) low-density lipoprotein cholesterol (LDL), (B) and high-density lipoprotein cholesterol (HDL, (C) triglycerides (TG) and (D) type 2 diabetes (T2D) at the level of -log10(p) >0, -log10(p) >1, -log10(p) >2, -log10(p) >3 corresponding to P < 1, P <0.1, P < 0.01, P < 0.001, respectively. Dotted lines indicate the theoretical line in case of no association.
Additionally, we used the Anderson–Darling test to quantify the degree of enrichment (Supplementary Table 2, available as Supplementary data at IJE online). As suggested by the Q-Q plots, we found the strongest enrichment for LDL and TG, where two, and three, strata, respectively, were significantly different from the depleted category after accounting for multiple testing. We observed weaker enrichment for HDL, T2D and BMI with one significant stratum each. No indication of enrichment was seen for WHR and SBP. Finally, we investigated if this general enrichment pattern replicated in the smaller UK 2008 GWAS. We observed a similar polygenic enrichment pattern of LDL and TG, illustrated by conditional Q-Q plots of the UK PCA GWAS given the identical CVD risk factors as presented above (Supplementary Figures 3 and 5, available as Supplementary data at IJE online). This suggests that the polygenic enrichment pattern of PCA given blood lipids is consistent. We also investigated how the enrichment pattern of the three different blood lipids varies with respect to different types of GWAS data for the secondary trait. Specifically, we compared three different studies, one conventional GWAS,23 one study on a customized chip (metabochip), and a meta-analysis of the GWAS and the customized chip. For details on the different studies we refer to Morris et al.17 The overall pattern of a very strong enrichment for LDL, a strong enrichment for TG, and a minor enrichment for HDL was present across these studies. A more detailed description of these results can be found in the Supplementary data (available at IJE online).
Pleiotropic gene loci in PCA and blood lipids (LDL, TG) identified with conjunction FDR
Based on significant polygenic enrichment in step one, the Anderson–Darling test, we took five traits into the conjunction FDR analysis, to investigate which SNPs associated with PCA were also associated with LDL (PCA&LDL), TG (PCA&TG), HDL (PCA&HDL), T2D (PCA&T2D) and BMI (PCA&BMI) based on conjunction FDR<0.01 per pair-wise comparison. Thus, we (conservatively) kept an overall FDR of 0.05. As expected from the Q-Q plots, we found the highest number of pleiotropic SNPs (with conjunction FDR < 0.01) between PCA and LDL (151 SNPs, contained in 14 independent loci) and PCA and TG (70 SNPs, contained in 7 loci). Of interest, of these 21 loci there were 4 that have a conjunction FDR <0.01 in both PCA&LDL and PCA&TG, as shown in Table 1.
Table 1.
Conjunction FDR (<0.01); PCA and LDL (PCA & LDL), and PCA and TG (PCA & TG)
| Rs number | gene | chr | PCA & LDL | PCA&TG | pval PCA | pval LDL | pval TG | UK PCA&LDL | UK PCA&TG | |
|---|---|---|---|---|---|---|---|---|---|---|
| 1 | rs267738 | LASS2 | 1 | 0.0010 | 0.8802 | 1.50E–04 | 4.33E–01 | 3.77E–03 | 0.6284 | 0.9776 |
| 2 | rs7255 | C2orf43 | 2 | 0.0007 | 0.9652 | 6.00E–06 | 9.93E–01 | 1.09E–06 | 0.2700 | 1.0000 |
| 3 | rs1534420 | BC038779 | 2 | 0.0003 | 0.8085 | 1.74E–05 | 5.85E–01 | 2.00E–05 | 0.1637 | 0.9211 |
| rs360808 | EHBP1 | 2 | 0.0001 | 0.6746 | 1.41E–08 | 3.73E–01 | 1.92E–05 | 0.1637 | 0.9211 | |
| rs4671052 | EHBP1 | 2 | 0.0013 | 0.7523 | 1.33E–04 | 1.11E–01 | 8.21E–05 | 0.4258 | 1.0000 | |
| 4 | rs17023900 | BC050344 | 3 | 0.0016 | 0.8212 | 7.85E-11 | 6.63E–01 | 3.16E–04 | 0.0036 | 0.9211 |
| 5 | rs2647256 | TET2 | 4 | 0.0054 | 0.7943 | 2.20E–06 | 2.30E–01 | 1.10E–03 | 0.3397 | 0.9591 |
| 6 | rs2074396 | PPA2 | 4 | 0.5305 | 0.0100 | 1.42E–05 | 5.90E–02 | 4.92E–01 | 0.7944 | 0.3651 |
| 7 | rs9405048 | MDC1 | 6 | 0.5305 | 0.0066 | 6.94E–05 | 9.24E–02 | 3.10E–01 | 0.9246 | 0.6619 |
| 8 | rs2535294 | C6orf15 | 6 | 0.5904 | 0.0005 | 9.88E–06 | 4.07E–03 | 8.07E–01 | 0.8793 | 0.3964 |
| rs3094220 | PSORS1C1 | 6 | 0.0209 | 0.0073 | 4.15E–04 | 8.33E–08 | 7.15E–03 | 0.5996 | 0.6163 | |
| rs2249742 | hla-b | 6 | 0.0016 | 0.7196 | 2.33E–04 | 2.29E–02 | 3.67E–06 | 0.2017 | 0.9063 | |
| 9 | rs2516464 | HCP5 | 6 | 0.0990 | 0.0073 | 5.34E–04 | 2.00E–01 | 2.81E–01 | 0.8273 | 0.7943 |
| 10 | rs2395175 | HLA-DRA | 6 | 0.0080 | 1.0000 | 9.92E–04 | 7.61E–01 | 4.08E–03 | 0.4671 | 1.0000 |
| rs3891175 | HLA-DQB1 | 6 | 0.0037 | 0.0073 | 4.27E–04 | 1.48E–03 | 3.05E–05 | 0.5996 | 0.6163 | |
| 11 | rs628031 | SLC22A1 | 6 | 0.0002 | 0.0506 | 8.45E–06 | 1.26E–02 | 1.12E–02 | 0.0354 | 0.1165 |
| 12 | rs6455682 | SLC22A1 | 6 | 0.0000 | 0.8401 | 3.16E–07 | 2.30E–01 | 1.81E–03 | 0.9129 | 1.0000 |
| 13 | rs3120137 | SLC22A3 | 6 | 0.0000 | 0.0228 | 3.13E–10 | 5.01E–04 | 1.31E–04 | 0.0023 | 0.0584 |
| rs2665357 | SLC22A3 | 6 | 0.0002 | 0.0005 | 7.24E–06 | 3.03E–07 | 2.90E–04 | 0.0023 | 0.0584 | |
| rs376563 | SLC22A3 | 6 | 0.0011 | 0.0001 | 1.22E–06 | 2.24E–05 | 1.33E–03 | 0.0309 | 0.0109 | |
| rs11751605 | LPA | 6 | 0.0000 | 0.0035 | 1.54E–09 | 3.45E–06 | 3.65E–09 | 0.0309 | 0.0109 | |
| 14 | rs9365233 | MAP3K4 | 6 | 0.0089 | 0.7291 | 1.08E–03 | 3.27E–01 | 3.30E–02 | 0.7948 | 0.9979 |
| 15 | rs7962595 | C12orf27 | 12 | 0.0057 | 0.7196 | 5.94E–04 | 7.41E–01 | 5.60E–06 | 0.8743 | 0.9994 |
| 16 | rs12602912 | BPTF | 17 | 0.0080 | 0.0073 | 6.40E–04 | 7.77E–05 | 6.24E–03 | 0.2344 | 0.3964 |
| 17 | rs6062509 | ZGPAT | 20 | 0.0066 | 0.9652 | 1.27E–11 | 9.33E–02 | 6.76E–03 | 0.8992 | 1.0000 |
Independent complex or single gene loci (r2 > 0.2) with SNP(s) with a conjunction FDR (conjFDR) <0.01 in both PCA and in LDL (PCA&LDL) and in both PCA and in TG (PCA&TG). We define and report the SNP with the strongest association in each LD block based on the minimum conjunction FDR (conjFDR). Additionally, we provide the P-values (pval PCA, pval LDL and pval TG) of the respective SNP for PCA, LDL and TG. We mark the conjunction FDR for those loci that overlap between all three traits in bold. All data were first corrected for genomic inflation. We included also HDL, T2D and BMI into the conjunction FDR analysis, but except for one locus for PCA&T2D (rs11651755), there was no single locus with conjFDR <0.01 in conjunction with those three traits. The last two columns give the conjunction FDR for PCA&LDL and PCA&TG in the UK replication data. It is important to note here that the replication data have far less power for detection as they have less than one-tenth of the sample size of the iCOGS data.
Thus, in total we identified 17 loci including 10 (non-overlapping) loci for PCA&LDL, 3 non-overlapping for PCA&TG and 4 loci overlapping for both LDL and TG (Table 1). There were no pleiotropic loci for PCA&HDL or PCA&BMI with conjunction FDR <0.01. For PCA&T2D, we found one pleiotropic locus (rs11651755) with a conjunction FDR equal to 5 x 10⁻⁵, and P-value of 1.4 x 10-37 in PCA, and 2.2 x10⁻⁷ in T2D. This locus was close to HNF1B which has been reported in previous T2D and PCA studies.12
The localization of the overlapping genetic markers between PCA and LDL and PCA and TG, are shown in ‘Conjunction FDR Manhattan plot’ (Figure 2). The red circles highlighted with a black line represent the SNP with the strongest association in each LD block with PCA&LDL, and the violet circles represent PCA&TG. The direction of effect varied across the different loci; for details see Supplementary Table 3, availabl at IJE online. We also conducted a replication study of the individual conjunction FDR loci using the UK 2008 GWAS as replication set, and replicated 86.8% of the SNPs in PCA&LDL, and 77.1% of the PCA&TG SNPs (discovery threshold conjunction FDR <0.2). Also the locus for PCA&T2D replicated. Table 1 also provides information on the replication in UK data; the last two columns give the conjunction FDR for PCA&LDL and for PCA&TG. It is important to note that the UK data have far less power for detection because the sample size is one-tenth of the iCOGS sample. Moreover, the UK sample represents a different population substructure from that in the iCOGS meta-analysis. Details on the replication analysis are presented in the Supplementary data and a summary of the replication results are presented in Supplementary Table 5 (available at IJE online). The one-directional conditional FDR results (conditional FDR <0.01 for PCA|CVD phenotypes) are listed in Supplementary Table 6, available as Supplementary data at IJE online.
Figure 2.
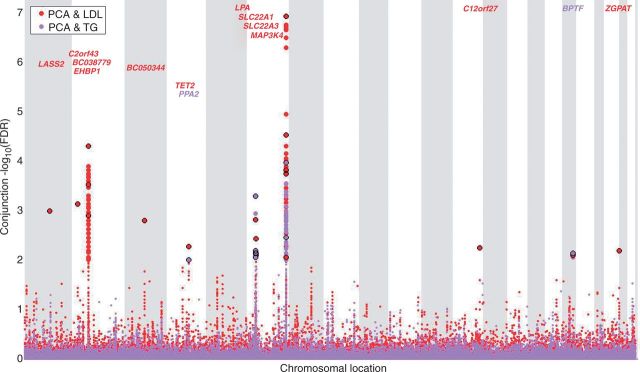
Conjunction FDR Manhattan plot. ‘Conjunction FDR Manhattan plot’ of conjunction -log10 (FDR) values for prostate cancer (PCA) and low-density lipoprotein cholesterol (LDL) and triglycerides (TG); the conjunctions are denoted as PCA&LDL, and PCA&TG, respectively. SNPs with -log10 (FDR) >2, (i.e. FDR <0.01) for both PCA & LDL (red), PCA and TG (violet), respectively, are shown with large points. A black line around the large points indicates the SNP with the strongest association in each LDL block and this SNP was annotated with the closest gene, which is listed above the symbols in each chromosome. The figure shows the localization of the ‘pleiotropic loci’, and further details are provided in Table 1.
Discussion
This study is the first attempt to quantify the degree of genetic overlap between PCA and a range of CVD risk factors, and to identify common genetic risk factors, applying a new genetic epidemiology approach. We found and replicated overlap between PCA and LDL, and PCA and TG, and identified 17 common gene loci, which may inform the underlying pathobiology of PCA. So far, these methods have not been applied to cancer genetic data, but have been shown to be useful for neuropsychiatric disorders,14,24 CVD traits,15 immune-related diseases16 and hypertension.24 The current findings in PCA suggest that the new statistical approach may also be a powerful tool in genetic epidemiology research in cancer. Moreover, the presented approach replicated one previously reported pleiotropic locus on HNF1B in PCA and T2D.12
Our two-step analysis strategy identified genetic pleiotropy between PCA and specific blood lipids. First, we computed conditional Q-Q plots in PCA for different strata of significance in a second phenotype (CVD risk factor). This method provided a visualization of polygenic cross-phenotype enrichment. Conditional Q-Q plots are optimized to identify polygenic risk rather than single examples of risk overlaps. The same is true for the Anderson–Darling test that we used to test if a secondary phenotype can stratify the distribution of summaries statistics for the first phenotype. Polygenic risk is arguably the more biologically relevant genetic basis for complex disease, given the significant molecular heterogeneity and multifocality of cancers and other disease types as highlighted by the many exome-sequencing and cancer genomics studies published recently.25 As a second step we computed the conjunction FDR to delineate the sites of genetic overlap. A polygenic risk analysis aims to identify multiple underlying risk factors that may in time be associated with genes and pathways that are poised, when combined with environmental factors and ageing, to trigger disease progression. Presently it is challenging to progress from polygenic risk to those genes/pathways, since the vast majority of risk factors are to be found in non-coding regions of the genome with putative roles in regulating transcription.26
The strongest polygenic overlap was observed between PCA and LDL, and PCA and TG, which may reflect a close biological association between PCA and these blood lipids. Regulatory associations linking the SNPs to differential gene expression need to be tested by expression quantitative trait loci (eQTL) analysis or a similar method as sample collections develop.27 However, we may speculate about underlying mechanisms based on current results. LDL regulates the availability of cholesterol and cholesterol is a metabolic precursor for steroid hormone biosynthesis in PCA cells, driving androgen receptor activity and contributing to PCA development.28 Consequently genetic factors that predispose individuals to hypercholesterolaemia may also affect the propensity to synthesize steroid hormones in prostate cells. This hypothesis is testable in future studies now that methods are available to assess steroid hormone levels not just in the bloodstream but also in prostate tissue.
In considering the epidemiological evidence for a relationship between cholesterol and PCA risk and progression, there are essentially four strands of evidence: observational studies of PCA and cholesterol; large population studies of cholesterol and disease risk; observational studies of cholesterol-lowering drugs and PCA; and randomized trials of cholesterol-lowering drugs that incorporate the reporting of cancer data. Between 1980 and 2000, only a minority of large population studies reporting cholesterol level, disease incidence and mortality included information on PCA, amounting to around 1600 cases across all studies.29 This makes association conclusions difficult to draw. A single recent Korean study included around 2500 PCA cases among 750 000 men and reported a hazard ratio (HR) of 1.24 for men in the highest quintile of cholesterol measurement.30 By contrast, studies specifically designed to address the association between cholesterol levels and PCA have much larger PCA cohort sizes allowing stratification based on disease grade and with many more advanced cases. There is of course some variation in findings here, too. Thompson et al. reported in 1989 (n = 100) and found no cholesterol-PCA association.31 Two publications by Platz et al. reported that low cholesterol was associated with a lower risk of high-grade PCA—one from the Health Professionals Follow-up Study (n = 698) with an odds ratio (OR) of 0.61,32 and the other from a placebo arm of a PCA prevention trial reporting an OR of 0.41.33 Hemelrijck and colleagues reported that LDL/HDL ratios of >3.70 were associated with increased PCA risk (HR of 1.21).34 These and other studies collectively suggest that men with hypercholesterolaemia are at increased risk for PCA or late stage, aggressive disease.35–37
Additional epidemiology data have arisen from studies using cholesterol-lowering drugs (principally 3-hydroxy-3-methylglutaryl coenzyme A (HMG-CoA) reductase inhibitors, collectively referred to as ‘statins’). It is noteworthy that these drugs do not just reduce cholesterol levels but also have profound effects on cholesterol-dependent regions of the plasma membrane known as lipid rafts, thus altering cell morphology, and also on inflammatory signalling.38 This therefore makes interpretation of these data in the context purely of cholesterol levels extremely challenging. Recent observational studies of statin effects on PCA risk, which contain large numbers of subjects, are largely supportive of the hypothesis that statins reduce risk of advanced PCA.39,40 However, many epidemiology studies have significant limitations including limited duration, no assessment of PCA grade and significant crossover between statin and control groups in the course of routine care.
Although our study does not yet resolve these challenges, it does contribute some candidate genetic risk factors that can be applied to past and future epidemiology studies exploring the relationship between statin use and PCA risk, as possible additional stratifiers. Interestingly, paradoxes remain apparent in the pleiotropic loci, with the same effect directions for some SNPs in PCA, LDL and TG and opposite effect directions for others. This reflects the fact that the traits investigated are composed of a number of different biological mechanisms with differing genetic backgrounds. Only the challenging long-term work to resolve their functional significance in a range of cell and tissue types will resolve these paradoxes, and this is far beyond what the field can achieve now.
The analytical approach presented here provides a conceptual framework that is open for extensions. Conditional and conjunction FDR are only capable of investigating two phenotypes at a time. Here, we focused on PCA as the main trait of interest, conditioning on various CVD risk factors. Because many of these CVD risk factors are involved in metabolic syndrome, we would predict that it is highly informative to study combinations of traits. Especially for the framework of conditional and conjunction FDR, it is highly desirable to extend our current approach to a truly multivariate setup, which is a potential future extension of the current methods building on our statistical framework. Further, our estimate of the conjunction FDR is also conservative, as we set the a priori proportion of null SNPs to zero. This reduces the possibility of discovering a rich polygenic risk landscape even further, and renders our approach more conservative than necessary. Further, the current findings are supported by the high level of replication in the independent UK PCA GWAS.
To conclude, the current findings showed the usefulness of the new statistical framework in the genetic epidemiology of cancer, and identified a strong genetic overlap between PCA and the blood lipids LDL and TG, suggesting 17 specific pleiotropic gene loci. These findings provide a basis for performing comprehensive genotyping, plasma, imaging, molecular and clinical assessments on epidemiology cohorts.10,41 This may facilitate discovery of new markers for early identification and new treatment targets which can lead to improved prevention and treatment regimens in PCA.
Supplementary Data
Supplementary data are available at IJE online.
Funding
This work was supported by the Kristian Gerhard Jebsen Foundation, Centre for Molecular Medicine Norway, Research Council of Norway (213837, 223273), South-East Norway Health Authorities (2013-123), National Institutes of Health (R01AG031224, R01EB000790 and RC2DA29475). I.G.M. and group members participate in the NIH Genetic Associations and Mechanisms in Oncology (GAME-ON): A Network of Consortia for Post-Genome Wide Association (Post-GWA) Research (prostate: 1U19CA148537-01).
This work was also supported by Cancer Research UK Grant C5047/A3354. We would also like to thank the following for funding support: the Institute of Cancer Research and the Everyman Campaign, the Prostate Cancer Research Foundation, Prostate Research Campaign UK (now known as Prostate Cancer UK), the National Cancer Research Network UK and the National Cancer Research Institute (NCRI) UK. The ProtecT study is ongoing and is funded by the Health Technology Assessment Programme (projects 96/20/06, 96/20/99). The ProtecT trial and its linked ProMPT and CAP (Comparison Arm for ProtecT) studies are supported by Department of Health, UK, Cancer Research UK grant number C522/A8649, Medical Research Council (UK) grant number G0500966, ID 75466 and the NCRI, UK. The epidemiological data for ProtecT were generated through funding from the Southwest National Health Service Research and Development.
Supplementary Material
Acknowledgements
We acknowledge the contribution of all members of the CVD GWAS consortia and the UKGPCS, BAUS and ProtecT study research groups, especially those listed in Supplementary data (available at IJE online).
Conflict of interest: None declared.
References
- 1.Pierce BL. Why are diabetics at reduced risk for prostate cancer? A review of the epidemiologic evidence. Urol Oncol 2012;30:735–43. [DOI] [PubMed] [Google Scholar]
- 2.Cohen JH, Kristal AR, Stanford JL. Fruit and vegetable intakes and prostate cancer risk. J Natl Cancer Inst 2000;92:61–68. [DOI] [PubMed] [Google Scholar]
- 3.Chan JM, Giovannucci EL. Dairy products, calcium, and vitamin D and risk of prostate cancer. Epidemiol Rev 2001;23:87–92. [DOI] [PubMed] [Google Scholar]
- 4.International Consortium for Blood Pressure Genome-Wide Association S, Ehret GB, Munroe PB, et al. Genetic variants in novel pathways influence blood pressure and cardiovascular disease risk. Nature 2011;478:103–09. [DOI] [PMC free article] [PubMed] [Google Scholar]
- 5.Global Lipids Genetics C, Willer CJ, Schmidt EM, et al. Discovery and refinement of loci associated with lipid levels. Nat Genet 2013;45:1274–83. [DOI] [PMC free article] [PubMed] [Google Scholar]
- 6.Heid IM, Jackson AU, Randall JC, et al. Meta-analysis identifies 13 new loci associated with waist-hip ratio and reveals sexual dimorphism in the genetic basis of fat distribution. Nat Genet 2010;42:949–60. [DOI] [PMC free article] [PubMed] [Google Scholar]
- 7.Speliotes EK, Willer CJ, Berndt SI, et al. Association analyses of 249,796 individuals reveal 18 new loci associated with body mass index. Nat Genet 2010;42:937–48. [DOI] [PMC free article] [PubMed] [Google Scholar]
- 8.Grundy SM, Brewer HB Jr, Cleeman JI, et al. Definition of metabolic syndrome: Report of the National Heart, Lung, and Institute/American Heart Association conference on scientific issues related to definition. Circulation 2004;109:433–38. [DOI] [PubMed] [Google Scholar]
- 9.Haheim LL, Holme I, Sogaard AJ, Lund-Larsen PG. Changes in cardiovascular risk factors among men in Oslo during 28 years. Tidsskr Nor Laegeforen 2006;126:2240–45. [PubMed] [Google Scholar]
- 10.Lund Haheim L, Wisloff TF, Holme I, Nafstad P. Metabolic syndrome predicts prostate cancer in a cohort of middle-aged Norwegian men followed for 27 years. Am J Epidemiol 2006;164:769–74. [DOI] [PubMed] [Google Scholar]
- 11.Scarborough P, Bhatnagar P, Wickramasinghe KK, Allender S, Foster C, Rayner M. The economic burden of ill health due to diet, physical inactivity, smoking, alcohol and obesity in the UK: an update to 2006-07 NHS costs. J Public Health 2011;33:527–35. [DOI] [PubMed] [Google Scholar]
- 12.Machiela MJ, Lindstrom S, Allen NE, et al. Association of type 2 diabetes susceptibility variants with advanced prostate cancer risk in the Breast and Prostate Cancer Cohort Consortium. Am J Epidemiol 2012;176:1121–29. [DOI] [PMC free article] [PubMed] [Google Scholar]
- 13.Solovieff N, Cotsapas C, Lee PH, Purcell SM, Smoller JW. Pleiotropy in complex traits: challenges and strategies. Nat Rev Genet 2013;14:483–95. [DOI] [PMC free article] [PubMed] [Google Scholar]
- 14.Andreassen OA, Thompson WK, Schork AJ, et al. Improved detection of common variants associated with schizophrenia and bipolar disorder using pleiotropy-informed conditional False Discovery Rate. PLoS Genet 2013;9:e1003455. [DOI] [PMC free article] [PubMed] [Google Scholar]
- 15.Andreassen OA, Djurovic S, Thompson WK, et al. Improved detection of common variants associated with schizophrenia by leveraging pleiotropy with cardiovascular-disease risk factors. Am J Hum Genet 2013;92:197–209. [DOI] [PMC free article] [PubMed] [Google Scholar]
- 16.Liu JZ, Hov JR, Folseraas T, et al. Dense genotyping of immune-related disease regions identifies nine new risk loci for primary sclerosing cholangitis. Nat Genet 2013;45:670–75. [DOI] [PMC free article] [PubMed] [Google Scholar]
- 17.Morris AP, Voight BF, Teslovich TM, et al. Large-scale association analysis provides insights into the genetic architecture and pathophysiology of type 2 diabetes. Nat Genet 2012;44:981–90. [DOI] [PMC free article] [PubMed] [Google Scholar]
- 18.Eeles RA, Olama AA, Benlloch S, et al. Identification of 23 new prostate cancer susceptibility loci using the iCOGS custom genotyping array. Nat Genet 2013;45:385–91. [DOI] [PMC free article] [PubMed] [Google Scholar]
- 19.Eeles RA, Kote-Jarai Z, Giles GG, et al. Multiple newly identified loci associated with prostate cancer susceptibility. Nat Genet 2008;40:316–21. [DOI] [PubMed] [Google Scholar]
- 20.Schork AJ, Thompson WK, Pham P, et al. All SNPs are not created equal: genome-wide association studies reveal a consistent pattern of enrichment among functionally annotated SNPs. PLoS Genet 2013;9:e1003449. [DOI] [PMC free article] [PubMed] [Google Scholar]
- 21.Lin DY, Sullivan PF. Meta-analysis of genome-wide association studies with overlapping subjects. Am J Hum Genet 2009;85:862–72. [DOI] [PMC free article] [PubMed] [Google Scholar]
- 22.Scholz FW, Stephens MA. K-Sample Anderson-Darling Tests. J Am Stat Assoc 1987;82:918–24. [Google Scholar]
- 23.Teslovich TM, Musunuru K, Smith AV, et al. Biological, clinical and population relevance of 95 loci for blood lipids. Nature 2010;466:707–13. [DOI] [PMC free article] [PubMed] [Google Scholar]
- 24.Andreassen OA, McEvoy LK, Thompson WK, et al. Identifying common genetic variants in blood pressure due to polygenic pleiotropy with associated phenotypes. Hypertension 2014;63:19–26. [DOI] [PMC free article] [PubMed] [Google Scholar]
- 25.Barbieri CE, Bangma CH, Bjartell A, et al. The mutational landscape of prostate cancer. Euro Urol 2013;64:567–76. [DOI] [PMC free article] [PubMed] [Google Scholar]
- 26.Ward LD, Kellis M. Interpreting noncoding genetic variation in complex traits and human disease. Nat Biotechnol 2012;30:1095–106. [DOI] [PMC free article] [PubMed] [Google Scholar]
- 27.Freedman ML, Monteiro AN, Gayther SA, et al. Principles for the post-GWAS functional characterization of cancer risk loci. Nat Genet 2011;43:513–18. [DOI] [PMC free article] [PubMed] [Google Scholar]
- 28.Cai C, Balk SP. Intratumoral androgen biosynthesis in prostate cancer pathogenesis and response to therapy. Endocr Relat Cancer 2011;18:R175–82. [DOI] [PMC free article] [PubMed] [Google Scholar]
- 29.Solomon KR, Freeman MR. The complex interplay between cholesterol and prostate malignancy. Urol Clin North Am 2011;38:243–59. [DOI] [PMC free article] [PubMed] [Google Scholar]
- 30.Kitahara CM, Berrington de Gonzalez A, Freedman ND, et al. Total cholesterol and cancer risk in a large prospective study in Korea. J Clin Oncol 2011;29:1592–98. [DOI] [PMC free article] [PubMed] [Google Scholar]
- 31.Thompson MM, Garland C, Barrett-Connor E, Khaw KT, Friedlander NJ, Wingard DL. Heart disease risk factors, diabetes, and prostatic cancer in an adult community. Am J Epidemiol 1989;129:511–17. [DOI] [PubMed] [Google Scholar]
- 32.Platz EA, Clinton SK, Giovannucci E. Association between plasma cholesterol and prostate cancer in the PSA era. Int J Cancer 2008;123:1693–98. [DOI] [PMC free article] [PubMed] [Google Scholar]
- 33.Platz EA, Till C, Goodman PJ, et al. Men with low serum cholesterol have a lower risk of high-grade prostate cancer in the placebo arm of the prostate cancer prevention trial. Cancer Epidemiol Biomarkers Prev 2009;18:2807–13. [DOI] [PMC free article] [PubMed] [Google Scholar]
- 34.Van Hemelrijck M, Walldius G, Jungner I, et al. Low levels of apolipoprotein A-I and HDL are associated with risk of prostate cancer in the Swedish AMORIS study. Cancer Causes Control 2011;22:1011–19. [DOI] [PubMed] [Google Scholar]
- 35.Batty GD, Kivimaki M, Clarke R, Davey Smith G, Shipley MJ. Modifiable risk factors for prostate cancer mortality in London: forty years of follow-up in the Whitehall study. Cancer Causes Control 2011;22:311–18. [DOI] [PMC free article] [PubMed] [Google Scholar]
- 36.Farwell WR, D'Avolio LW, Scranton RE, Lawler EV, Gaziano JM. Statins and prostate cancer diagnosis and grade in a veterans population. J Natl Cancer Inst 2011;103:885–92. [DOI] [PMC free article] [PubMed] [Google Scholar]
- 37.Shafique K, McLoone P, Qureshi K, Leung H, Hart C, Morrison DS. Cholesterol and the risk of grade-specific prostate cancer incidence: evidence from two large prospective cohort studies with up to 37 years' follow up. BMC Cancer 2012;12:25. [DOI] [PMC free article] [PubMed] [Google Scholar]
- 38.Freeman MR, Solomon KR. Cholesterol and prostate cancer. J Cell Biol 2004;91:54–69. [DOI] [PubMed] [Google Scholar]
- 39.Demierre MF, Higgins PD, Gruber SB, Hawk E, Lippman SM. Statins and cancer prevention. Nat Rev Cancer 2005;5:930–42. [DOI] [PubMed] [Google Scholar]
- 40.Platz EA, Leitzmann MF, Visvanathan K, et al. Statin drugs and risk of advanced prostate cancer. J Natl Cancer Inst 2006;98:1819–25. [DOI] [PubMed] [Google Scholar]
- 41.Stocks T, Borena W, Strohmaier S, et al. Cohort Profile: The Metabolic syndrome and Cancer project (Me-Can). Int J Epidemiol 2010;39:660–67. [DOI] [PMC free article] [PubMed] [Google Scholar]
Associated Data
This section collects any data citations, data availability statements, or supplementary materials included in this article.