Abstract
During kidney development, the vasculature develops via both angiogenesis (branching from major vessels) and vasculogenesis (de novo vessel formation). The formation and perfusion of renal blood vessels are vastly understudied. In the present study, we investigated the regulatory role of renal blood flow and O2 concentration on nephron progenitor differentiation during ontogeny. To elucidate the presence of blood flow, ultrasound-guided intracardiac microinjection was performed, and FITC-tagged tomato lectin was perfused through the embryo. Kidneys were costained for the vasculature, ureteric epithelium, nephron progenitors, and nephron structures. We also analyzed nephron differentiation in normoxia compared with hypoxia. At embryonic day 13.5 (E13.5), the major vascular branches were perfused; however, smaller-caliber peripheral vessels remained unperfused. By E15.5, peripheral vessels started to be perfused as well as glomeruli. While the interior kidney vessels were perfused, the peripheral vessels (nephrogenic zone) remained unperfused. Directly adjacent and internal to the nephrogenic zone, we found differentiated nephron structures surrounded and infiltrated by perfused vessels. Furthermore, we determined that at low O2 concentration, little nephron progenitor differentiation was observed; at higher O2 concentrations, more differentiation of the nephron progenitors was induced. The formation of the developing renal vessels occurs before the onset of blood flow. Furthermore, renal blood flow and oxygenation are critical for nephron progenitor differentiation.
Keywords: blood flow, endothelium, hypoxia, kidney development, vasculature
formation of the mature kidney involves reciprocal inductive interactions between the metanephric mesenchyme and the ureteric bud. This process is initiated when the ureteric bud invades the metanephric mesenchyme at approximately embryonic day 10.5 (E10.5) (7). Invasion into the adjacent metanephric mesenchyme, a progenitor cell population, by the ureteric bud ultimately initiates the process of nephrogenesis through inductive signaling and a multitude of extracellular factors (for reviews, see Refs. 3, 4, and 7). Repeated branching of the ureteric bud into the rapidly condensing metanephric cap mesenchyme begins the formation of the functional units of the kidney, the nephron. At the same time, the renal stromal compartment is developing around these nephron units. The stromal compartment is critical for the overall architecture of the kidney, giving rise to many of the vascular supportive cells and, as we recently found, to a subset of endothelial progenitors (19, 21). More recently, the importance of stromal cells that secrete critical factors to aid in nephron and vascular differentiation has been determined (5, 11). With every new generation of ureteric bud and nephron, older generations are displaced into the inner cortex and medulla, where they then undergo further maturation within primarily vascular-dense environments. Interestingly, however, much of the early nephron maturation occurs within the outer cortex, a nephrogenic zone that is almost completely unperfused during early developmental stages (17).
During vascularization of the developing kidney, there are two vascular processes that take place: angiogenesis, which is the process whereby a vessel sprouts from a major preexisting vessel, and vasculogenesis, which is the de novo formation of vessels from resident endothelial progenitors (1, 12, 21). Angiogenesis is a process that is synonymous with blood flow, whereas vasculogenesis is thought to largely take place in the absence of blood flow. For the majority of mammalian gestation, the embryo possesses a nonexistent or immature cardiovascular system. As a consequence, many of the embryonic tissues, including the kidney, develop within a low O2 tension environment. Despite this hypoxic environment, many mouse organ systems still maintain the ability to undergo rapid development and organogenesis. Interestingly, many developing organs will often use changes in O2 concentration to signal progenitor cells to differentiate (8–10, 13, 20). However, this phenomenon has yet to be shown in the developing kidney.
The mature mammalian kidney is a highly vascularized organ whose primary role is to filter the blood that is perfused through it and to remove waste products (the kidney receives ∼20% of cardiac output). This highly synchronized process is poorly understood, particularly as it relates to development. Previously, a technique has been developed to microinject the embryonic heart with FITC-tagged tomato lectin (TL), which sticks to the endothelium and subsequently is a measure of where blood has flowed. This technique has been used to evaluate blood flow in the developing pancreas and also to evaluate vasculogenesis versus angiogenesis in pancreas development. In addition, the need for hypoxic environments for developmental pancreatic differentiation and a direct correlation between O2 tensions and blood flow were shown (20).
In the present study, we used intracardiac microinjection of TL to characterize blood flow through various stages of kidney development. We determined that vasculogenic vessels form and are not perfused at early developmental time points. However, as the kidney continues to develop, we observed a greater proportion of vessels that are perfused. Furthermore, we found that the degree of perfusion was directly correlated with the presence of differentiated structures. Subsequently, we determined that nephron progenitor differentiation could be manipulated by altering O2 concentration in vitro.
MATERIALS AND METHODS
Animals.
For the majority of the experiments, wild-type time-mated CD1 mice were used from Charles River. For hypoxic experiments, we used transgenic Six2creGFP mice that express Cre recombinase and green fluorescent protein (GFP) in the nephron progenitor cell population (14). Six2creGFP mice were subsequently bred with a GT Rosa CAG reporter mouse (tdTomato), which contains a stop codon flanked by LoxP sites adjacent to red fluorescent protein (RFP). When the tdTomato mouse was bred to Six2creGFP mice, the progeny have the stop codon spliced out, which turns on expression of RFP in all Cre-positive derivatives to permanently label nephron progenitors (18). The Institutional Animal Care and Use Committee of the University of Pittsburgh approved all experiments.
Genotyping.
For the tdTomato reporter mouse experiments, RFP-positive embryos revealed the presence of Six2cre (including in the eyes and kidneys). However, all positive embryos were confirmed via PCR genotyping. Genotyping was performed as previously described (11, 21). In brief, tail clippings or embryonic facial structures were collected, and genomic DNA was extracted. PCR was used to identify all mouse genotypes. The primers used to detect the Six2creGFP transgene were forward 5′-ATGCTCATCCGGAGTTCCGTATG-3′ and reverse 5′-CACCTTGTCGCCTTGCGTATAA-3′, giving a single band at 350 bp. The primers used to detect tdTomato were wild-type forward 5′-AAGGGAGCTGCAGTGGAGTA-3′ and wild-type reverse 5′-CCGAAAATCTGTGGGAAGTC-3′, which showed a band at 297 bp, and mutant forward 5′-CTGTTCCTGTACGGCATGG-3′ and mutant reverse 5′-GGCATTAAAGCAGCGTATCC-3′, which showed a single band at 196 bp.
In utero TL injection in mouse embryos.
This technique was used as previously described (20). In brief, pregnant mice were anesthetized and subjected to a laparotomy to expose the uterus from E11.5 to E17.5 embryonic time points. A minimum of six separate litters (n = 6) was injected for each experimental time point. A fenestrated petri dish was then placed over the mother, and embryos were brought through the opening one or two at a time and immersed in 37°C PBS. To guide the glass needle to the embryo heart, an ultrasound microscope probe was used. The needle, holding 2.5 μl of FITC-tagged TL, was guided to the heart and injected in low volume to allow passive flow into the organ and tissues. Embryos were then sequentially injected and placed back into the mother, and the injected TL was allowed to circulate for ∼15 min as it adhered to the endothelial wall of the renal vasculature. Over the course of injections, the mother's heart rate, temperature, and stress were monitored before, during, and after the procedure to ensure that injections were performed within normal homeostatic and hemodynamic conditions. After this, embryos were located, and the viability of the embryos was observed before they were harvested and photographed to gauge the fluorescence. Embryonic kidneys were dissected and then fixed in 4% paraformaldehyde (PFA) overnight at 4°C.
Tissue collection.
For frozen sectioning, six litters of whole embryos and kidneys were dissected at each time point, fixed in 4% PFA, dehydrated in 30% sucrose, and then embedded in OCT medium. Sections were subsequently cut at 6 μm on a cryostat and stored at −80°C. For whole mount collection, an additional kidney from each pair was dissected in a similar manner, fixed in 4% PFA overnight, dehydrated through 100% methanol the next day, and subsequently stored in chamber wells at −20°C.
Immunohistochemistry.
For cryosectioned immunofluorescence, embryonic or isolated tissue sections were blocked in a 10% BSA and donkey serum solution in PBS and incubated at 4°C overnight with primary antibodies at varying dilutions (Table 1). Experiments were repeated a minimum of three times from the various injections performed. The next day, slides were washed several times in PBS, and secondary and tertiary stains were applied for 1 h each (Table 2). 4′,6-Diamidino-2-phenylindole stains were applied over the last 15 min. Kidney samples were finally washed in PBS for a third cycle, mounted, and visualized with a Leica upright microscope (Buffalo Grove, IL).
Table 1.
List of primary antibodies
| Antibody | Species | Company | Catalog Number | Concentration |
|---|---|---|---|---|
| Amphyphisin | Rabbit | Proteintech | 13379-1-AP | 1:100 |
| Calbindin D28K | Mouse | Sigma-Aldrich | C9848 | 1:100 |
| DAPI | N/A | Sigma-Aldrich | 022M4004V | 1:5,000 |
| Jagged1 | Rabbit | Santa Cruz Biotechnology | SC8303 | 1:100 |
| Pax2 | Rabbit | Covance | PRB-276P | 1:100 |
| PDGFR-β | Rabbit | Millipore | 04–397 | 1:100 |
| PECAM | Rat | BD Biosciences | 553370 | 1:100 |
| α-SMA | Mouse | Sigma-Alrich | A2347 | 1:500 |
| Six2 | Rabbit | Proteintech | 11562-1-AP | 1:100 |
| FITC-tomato lectin | N/A | Vector Laboratories | FL-1321 | 2.5 μl/embryo |
| Biotin-LTL | N/A | Vector Laboratories | B-1325 | 1:100 |
DAPI, 4′,6-diamidino-2-phenylindole; PDGFR, platelet-derived growth factor receptor-β; PECAM, platelet endothelial cell adhesion molecule; α-SMA, α-smooth muscle actin; LTL, Lotus tetragonolobus lectin; N/A, not applicable.
Table 2.
List of secondary and tertiary antibodies
| Antibody | Company | Catalog Number | Concentration |
|---|---|---|---|
| Biotin-SP-conjugated donkey anti-rat | Jackson Immunoresearch | 712-065-150 | 1:200 |
| Donkey anti-goat Alexa fluor-488 | Invitrogen | A11055 | 1:200 |
| Donkey anti-rat Alexa fluor-488 | Jackson Immunoresearch | 712-605-150 | 1:200 |
| Donkey anti-mouse Alexa fluor-594 | Jackson Immunoresearch | 715-585-020 | 1:200 |
| Goat anti-rabbit Alexa fluor-594 | Invitrogen | A11080 | 1:200 |
| Streptavidin Alexa fluor 647 | Jackson Immunoresearch | 712-605-150 | 1:200 |
| Streptavidin Alexa fluor 594 | Jackson Immunoresearch | 016-580-084 | 1:200 |
Hypoxic organ culture experiment.
Embryonic kidneys from Six2cre × tdTomato embryos were dissected on E12.5 in PBS and placed on Whatman nuclepore filter membranes with DMEM, penicillin-streptomycin, and 10% FBS media. A minimum of three separate experiments was performed for each concentration of O2. Kidneys from each animal were separated for either normoxic incubation (21% O2 tension) or hypoxic incubation (1 or 5% O2 tension) and allowed to grow for 3–7 days in their respective chambers. Images were taken at this time as day 0 images. Every 3 days, media were changed to allow consistent and continuous growth. On the final day, tissues were imaged to gauge development, fixed in 4% PFA, dehydrated through 100% methanol, and finally stored at −20°C. Six2 is known to give rise to the cells of the glomerulus; subsequently, the differentiated nephron structures were counted in the various conditions. Statistical analysis was carried out for the 3- and 7-day groups by a t-test for the 3-day samples or one-way ANOVA for the 7-day samples followed by the appropriate post hoc test.
RESULTS
TL injections to label the intrarenal perfused embryonic vasculature.
Most embryonic tissues (including the kidney) contain a dense vasculature (1, 11, 19, 21). This dense vascularity, however, does not prove that those tissues are also well perfused. To analyze blood flow in the developing kidney, we used a method of in utero embryonic intracardiac injection (20). Using a high-resolution ultrasound to identify the embryonic heart, and after extracting and exposing a single uterine saccule via a laparotomy, we were able to inject E11.5, E13, E15, and E17 embryos with 2.5 μl TL (FITC-conjugated TL). As the embryonic heart continues to pump, the TL tracer is pumped throughout the body to demarcate the vessels that are perfused throughout the embryos (Fig. 1A). Once good perfusion was observed, the kidneys were dissected and visualized to observe the three-dimensional arrangement of the perfused vessels. At E11.5, we found that the perfused vessels surrounded the developing kidney in a web-like arrangement (Fig. 1B). By E13.5, the major vessels were perfused with few of the smaller accessory vessels stained with TL (Fig. 1C). Staining could also be seen throughout some of the ureteric epithelium; this may either be from glomeruli that are already perfused or due to the leakiness of the early embryonic vessels. By E15.5, the major vessels were perfused; however, a large number of glomeruli could also be observed, suggesting that significant filtering occurred (Fig. 1D). Also at this time point a number of the smaller vessels appeared perfused, although a significant proportion of the outer nephrogenic zone appeared to be devoid of blood flow. However, by E17.5, the majority of the kidney was perfused (except for the very peripheral nephrogenic zone), smaller vessels contained the lectin, and the number of perfused glomeruli had dramatically increased (Fig. 1E).
Fig. 1.

Kidney blood flow occurs in a sequential spatiotemporal pattern. A–E: representative images of a tomato lectin (TL; green)-injected embryo (A) and kidneys (B–E) at various developmental stages. A: embryonic day 11.5 (E11.5) embryo showing perfused vessels throughout the head (white arrowheads) and body of the embryo, with the site of injection showing very bright staining (yellow arrowhead). B: dissected E11.5 kidney showing perfused vessels surrounding the developing kidney in a honeycomb arrangement (as marked by the dotted line). C: E13.5 kidney (as marked by the dotted line) showing perfusion of the major renal vessels (white arrowheads). Some lectin can also been seen sticking to the ureteric epithelium (yellow arrowhead). D: E15.5 kidney (as marked by the dotted line) showing perfusion of the smaller vascular branches (yellow arrowheads) as well as several perfused glomeruli (white arrowheads). E: E17.5 kidney showing significant perfusion throughout the developing kidney including numerous perfused glomeruli (white arrowheads) and smaller caliber vessels (yellow arrowheads).
Vascular formation precedes flow in the developing kidney.
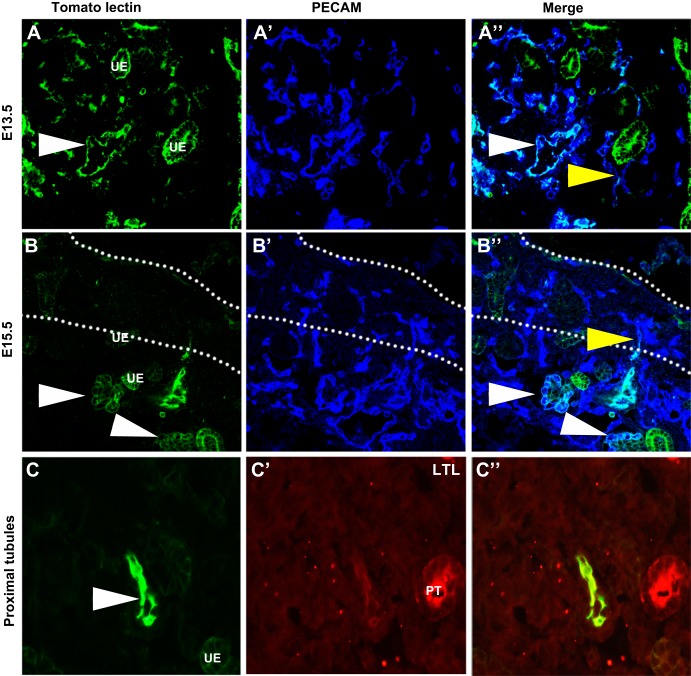
Our preliminary whole mount assessment of embryonic renal blood flow suggested TL staining largely within the vessels except at sites where potential filtering or leaking was occurring (Fig. 1). Subsequently, we costained vessels with a universal vascular endothelium marker [platelet endothelial cell adhesion molecule (PECAM)] to determine the relationship between the vessels and branching ureteric epithelium, which was marked by a ureteric epithelial marker (calbindin). From these whole mount images, we found that from E13.5 onward the major central blood vessels were perfused; however, there were many smaller vessels that did not contain blood flow (Fig. 2A). By E15.5, the developing vasculature could be seen nestled in between the branching ureteric epithelium. Many of the peripheral vessels now contained blood flow except toward the periphery in the presumptive nephrogenic zone (Fig. 2B). By E17.5, the majority of the smaller interdigitating vessels were now perfused, although the very peripheral nephrogenic zone was devoid of perfused vessels. We then cut sections from the various time points and confirmed that at E13.5 the major vessels were perfused (PECAM positive and TL positive), but this perfusion did not extend into the nephrogenic zone, where many unperfused vessels were observed (PECAM positive and TL negative; Fig. 3A). Similarly, at E15.5 (Fig. 3B), we found that the major vessels and some of the smaller caliber vessels were perfused, but the peripheral nephrogenic zone vessels remained unperfused (Fig. 3B). We also observed that the ureteric epithelium was seen to have lectin positivity. It is unlikely that this is due to filtering but more likely due to leakiness of the vessels, which is common in the developing vasculature. We did not observe TL staining in the proximal tubules, likely due to the distance from the perfused vessels.
Fig. 2.
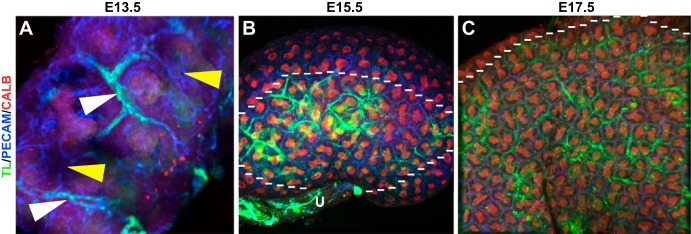
Whole mount images suggesting that the formation of renal vessels precedes renal blood flow. A–C: whole mount images of blood flow in the developing kidney (green) at various developmental stages colabeled with vascular [platelet endothelial cell adhesion molecule (PECAM; blue)] and ureteric epithelial (calbindin, red) markers. A: representative E13.5 kidney showing the major vessels (white arrowhead) that are perfused and peripheral areas of the kidney that are vascularized but lacking blood flow (yellow arrowheads). B: E15.5 whole mount kidney showing that the more centralized vessels (inside the dotted line) that are closer to the ureter (U) and angiogenic vessels are perfused and interdigitating between the ureteric epithelium (red), but the peripheral vessels (outside the dotted line), likely of vasculogenic origin, are unperfused. C: representative E17.5 kidney showing significantly more perfusion throughout the kidney interdigitating between the branching ureteric epithelium (below the dotted line). However, in the presumptive nephrogenic zone, the vessels are unperfused (above the dotted line).
Fig. 3.
Confirmation that the renal vasculature develops before blood flow. A and B: sections of TL (green) perfused embryos colabeled with PECAM (blue). A–A″: representative E13.5 sections showing the major vessels as marked with PECAM perfused with TL (white arrowheads). In a small number of peripheral vessels, TL can also been seen in a subset of vessels that attached to unperfused vessels (yellow arrowhead). B–B″: E15.5 sections showing a peripheral vessel that showed positive lectin staining, indicating perfusion, until the outer cortex. Past this point, the vessel lacks perfusion (yellow arrowhead). Glomeruli are also apparent that are clearly perfused at this time point (white arrowheads). C–C″: E15.5 sections injected with TL and costained with the proximal tubule (PT) marker Lotus tetragonolobus lectin (LTL). C: TL injection site with a perfused vessel clearly demarcated (white arrowhead). Some staining was also observed in the ureteric epithelium (UE), whereas no staining is observed in the proximal tubule.
Blood flow does not extend into undifferentiated nephron progenitors.
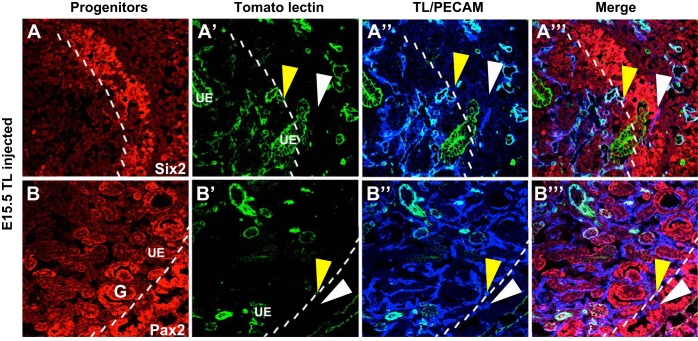
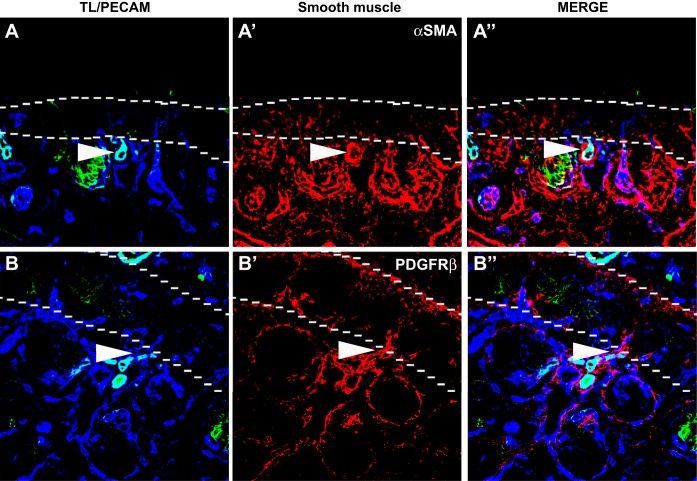
From the previous experiments, there appeared to be a clear demarcation between the areas of renal blood flow and the nephrogenic zone where renal stem cells exist. To specifically examine this issue, we studied blood flow (FITC-conjugated TL), blood vessels (PECAM staining), and nephron progenitors (Six2 and Pax2 staining), which are located within the nephrogenic zone. From E13.5 to E15.5, PECAM+ perfused vessels seemed to abut the border of Six2 or Pax2+ undifferentiated nephron progenitors (Fig. 4 and data not shown). Furthermore, unperfused vessels could be seen throughout the nephrogenic zone. We also observed that at the demarcation of the nephrogenic zone, there was a piling up of smooth muscle cells and pericytes (Fig. 5).
Fig. 4.
Blood flow does not extend into the undifferentiated nephron progenitors. A and B: representative images of E15.5 kidneys perfused with FITC-TL and colabeled for markers of nephron progenitors (Six2 and Pax2, red) and the vasculature (PECAM, blue). A–A″′: Six2 (red) is shown to mark nephron progenitors, which reside in the nephrogenic zone (marked by the dotted line). Perfused vessels (yellow arrowheads) stained with TL (green) and PECAM (blue) can be seen all the way to the nephrogenic zone, and unperfused vessels (white arrowheads) are then seen throughout the nephrogenic zone. B–B″′: a similar expression pattern is seen with Pax2 (red), although staining for Pax2 was also observed in the ureteric epithelium and developing glomeruli (G). Whereby perfused vessels (yellow arrowheads) marked by TL (green) abut the nephrogenic zone, however, the blood flow does not penetrate, leaving the vessels marked with PECAM (blue) within the nephrogenic zone unperfused (white arrowheads).
Fig. 5.
Smooth muscle cells and pericytes aggregate nephrogenic zone. A and B: representative E15.5 images showing smooth muscle/pericyte formation in relation to blood flow. A–A″: representative images showing blood flow in relation to smooth muscle formation. As shown, where there was cessation of blood flow into the nephrogenic zone (dotted line), there was an abundance of smooth muscle cells (white arrowheads). α-SMA, α-smooth muscle actin. B–B″: similarly, when we observed representative images of the pericyte marker platelet-derived growth factor receptor (PDGFR)-β, we found a similar clumping of PDGFR-β-positive cells (white arrowheads) at the border of blood flow and the nephrogenic zone (dotted line).
Nephron progenitor differentiation appears in concert with blood flow.
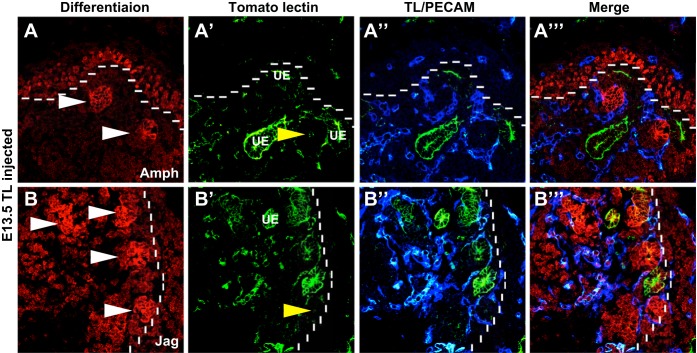
A clear relationship was emerging as to the areas of blood flow and nephron progenitor differentiation. To more closely study this relationship, we costained kidneys with the differentiation markers amphyphisin and jagged1. At E13.5, amphyphisin (Fig. 6A)- and jagged1 (Fig. 6B)-positive differentiated nephron structures were present just outside the nephrogenic zone, more proximal to the medulla; these early nephron structures were surrounded by perfused blood vessels. Similarly, at E15.5, there was a clear demarcation of the nephrogenic zone, and the differentiated structures appeared just adjacent to the nephrogenic zone (data not shown). These differentiated structures appear to have perfused vessels surrounding these structures and also penetrating into them. These results support a possible role for vascular perfusion as a signal for differentiation of renal progenitor cells.
Fig. 6.
Renal blood flow is closely associated with nephron differentiation. A and B: representative images of E13.5 TL (green)-injected kidneys stained for nephron differentiation markers amphyphisin and jagged1 (Amph and Jag; red) and the vasculature (PECAM, blue). A–A″′: amphiphysin (red) staining was found in the early renal vesicles (white arrowheads) and also throughout the nephron progenitors in the neprogenic zone (dotted line). Perfused vessels were found encircling these differentiating structures and also contained within them (yellow arrowheads). B–B″′: similarly, jagged1-positive renal vesicles (white arrowheads) were observed surrounded by perfused vessels. The vessels were also located within the vesicles (yellow arrowheads).
O2 concentration drives nephron progenitor differentiation.
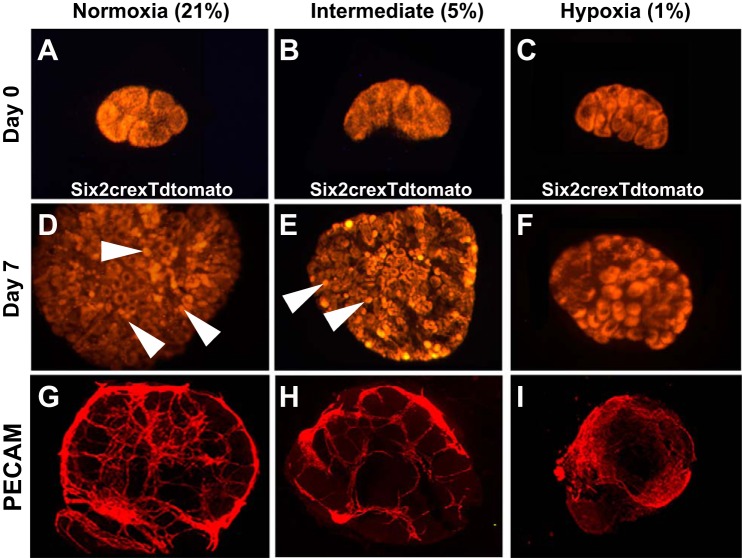
From these series of experiments, there seemed to be an intricate link between blood flow and nephron progenitor differentiation. Thus, next, we wanted to determine whether an increase in O2 tension is sufficient to drive nephron progenitor differentiation in the absence of blood flow. We placed Six2-cre; tdTomato embryonic kidneys (permanently tdTomato-labeled kidneys) into various O2 concentrations [normal (21%), intermediate (5%), and hypoxic (1%)] and grew kidneys for 7 days. What we observed in the 7-day cultures was that the normoxic explants contained numerous differentiated structures (49.00 ± 8.11), which appeared adjacent to the presumptive nephrogenic zone. Conversely, under hypoxic conditions, we observed little nephron differentiation (3.11 ± 2.52, P < 0.0001) and the nephron progenitor caps maintained their undifferentiated appearance (Fig. 7). When we used an intermittent O2 concentration (5%), some differentiation (19.67 ± 1.52, P < 0.0001) was induced but not back to the normal O2 condition (Fig. 7). Furthermore, when we correlated vascular growth in these explants using PECAM staining, we observed that under hypoxic conditions, the vessels were less organized as the degree of O2 decreased (Fig. 7, G–I).
Fig. 7.
Varying O2 concentrations mediate the amount of nephron progenitor differentiation. A–F: Six2cre mice bred with a tdTomato reporter mouse (red) were grown under varying O2 concentrations for 7 days. A–C: E12.5 kidneys at 0 days of culture showing the kidneys placed in normoxia (A), intermediate hypoxia (B), and hypoxia (C) at developmentally comparable stages. There was a presence of nephron progenitors but no differentiated structures. D–F: after 7 days of culture in normoxia (C), the kidney showed numerous differentiated nephron structures (white arrowheads), whereas a stepwise reduction in the number of glomerular structures was observed in the intermediate (E) and hypoxic (F) conditions. G–I: representative whole mount images of PECAM staining in explants at various O2 concentrations. Under the normal O2 concentration (G), significant differentiation and patterning of vessels were observed. There was still relatively well-defined differentiation at 3% O2 concentration (H), but a complete lack of vascular organization was observed in the 1% O2 concentration (I).
DISCUSSION
This study used a novel intracardiac injection technique in the embryo to interrogate blood flow in the developing kidney. The microinjection of TL into the embryonic heart of embryos at various time points allowed us to generate an “atlas” of when blood vessels begin to be perfused in the kidney. Furthermore, the spatial-temporal pattern of blood flow suggested an inductive role for blood flow in nephron progenitor cell proliferation and differentiation. Finally, we determined that placing kidneys into hypoxic conditions blocks nephron differentiation.
The kidney receives ∼20% of cardiac output postnatally; however, little is known about developmental blood flow within the kidney. Here, we describe, for the first time, the intimate relationship between blood flow and the formation of embryonic renal vessels. Imaging of the developing vasculature in vivo is challenging; several techniques have previously been used, although the majority are time consuming and do not depict true functional embryonic perfusion of the vasculature. Microdissection of the developing vasculature has been performed (19), but information related to the relationship of the vessels to other renal structures is lost. Postnatal experiments have been performed that use intravascular resins that harden and thus depict a static representation of the kidney vasculature (2). These corrosion cast experiments have been greatly improved with the integration of advanced imaging techniques (24). Renal blood flow can be assessed in mice postnatally using ultrasound guidance and microbubble contrast agents (22). These ultrasound-imaging studies provide accurate information about blood flow but are not translatable to embryos. Furthermore, contrast-enhanced ultrasound is not optimal for delineating the relationship with other vessels and kidney structures. Here, we provide imaging of embryonic renal blood flow throughout development, thus shedding light on how blood flow may affect organ formation.
Our data suggest that perfusion of the embryonic renal vasculature progresses in a sequential manner, with the major vessels being perfused first followed by the smaller peripheral renal vessels. However, early on, there are numerous vessels that are unperfused, perhaps reflecting an intimate relationship between angiogenic vessels and vasculogenic vessels. It is known that angiogenic vessels require blood flow for their growth and development (25), whereas vasculogenic vessels can form from endothelial progenitors in the absence of blood flow (16, 19, 21). Thus, it seems likely that the early perfused vessels arose by angiogenesis. Interestingly, we did note that there were areas where perfused and unperfused vessels appeared to be connected, suggesting communication between angiogenic and vasculogenic vessels. Early in development, the lack of perfusion may be explained by a lack of any obvious connection between angiogenic and vasculogenic vessels, as has been shown in the pancreas (20) and lung (6). However, later in development, there continues to be a lack of perfusion into the peripheral areas (as is the case with the nephrogenic zone) despite connections, which are apparent between angiogenic and vasculogenic vessels. One possibility is that embryonic cardiac output is very low and thus the resulting lower perfusion pressure is inadequate to perfuse the smaller vasculogenic vessels. Such a differential perfusion may be an important regulatory mechanism, as it would theoretically provide oxygenation to the areas of greatest need (those that are undergoing differentiation) while leaving low O2 concentrations in those areas where cells remain undifferentiated. Our findings suggest that the inhibition of flow may also be mediated by smooth muscle cells and pericytes at the junction of the nephrogenic zone at critical points that inhibit the flow of blood (15). This likely contributes to the maintenance of the hypoxic nephrogenic zone and allows for stem cell proliferation without differentiation.
The data that we present point to a role for blood flow and oxygenation in driving nephron progenitor differentiation. The immunohistochemistry experiments suggest regional differences in blood flow and O2 concentration that continue throughout kidney development, until the entire organ is perfused postnatally. The nephrogenic zone represents the stem cell niche, and it is widely known that undifferentiated stem cells often reside in areas of low O2 concentration. When we used the hypoxic chamber (in the absence of blood flow) to lower the O2 concentration, we were able to maintain progenitor cells in an undifferentiated state. Many studies have focused on various critical factors that affect nephron differentiation (23). Previously we have determined that when the renal stroma is ablated, the vessels are enlarged and disorganized accompanied by a lack of nephron progenitor differentiation (11). These previous findings are strikingly similar to what was observed here in hypoxic organ cultures. suggesting that the renal ablation model may be lacking blood flow. The present study suggests that blood flow and O2 concentration are critical determinant of progenitor cell differentiation and could prove to be critical factors in mediating this process.
In conclusion, these experimental findings, when taken together, suggest that one of the key factors in driving nephron progenitor differentiation is O2 concentration (as mediated by blood flow). The harnessing of this phenomenon could prove to be therapeutically relevant as the field strives for technologies to generate ne novo functional nephrons.
GRANTS
S. Sims-Lucas was supported by American Heart Association Fellowship 11POST7330002. In addition, S. Sims-Lucas and this work were supported by National Institute of Diabetes and Digestive and Kidney Diseases Mentored Research Scientist Development Award DK-096996 and by the Children's Hospital of Pittsburgh.
DISCLOSURES
No conflicts of interest, financial or otherwise, are declared by the author(s).
AUTHOR CONTRIBUTIONS
Author contributions: C.R., J.P., D.A.P., G.K.G., C.M.B., and S.S.-L. conception and design of research; C.R., J.P., K.H., C.S., J.W., G.Z., D.A.P., S.V., and S.S.-L. performed experiments; C.R., J.P., K.H., D.A.P., S.V., G.K.G., C.M.B., and S.S.-L. analyzed data; C.R., K.H., D.A.P., S.V., G.K.G., C.M.B., and S.S.-L. interpreted results of experiments; C.R., G.K.G., C.M.B., and S.S.-L. prepared figures; C.R., G.K.G., C.M.B., and S.S.-L. drafted manuscript; C.R., S.V., G.K.G., C.M.B., and S.S.-L. edited and revised manuscript; C.R., J.P., C.S., J.W., G.Z., D.A.P., G.K.G., C.M.B., and S.S.-L. approved final version of manuscript.
REFERENCES
- 1.Abrahamson DR, Robert B, Hyink DP, St John PL, Daniel TO. Origins and formation of microvasculature in the developing kidney. Kidney Int Suppl 67: S7–S11, 1998 [DOI] [PubMed] [Google Scholar]
- 2.Andres AC, Munarini N, Djonov V, Bruneau S, Zuercher G, Loercher S, Rohrbach V, Ziemiecki A. EphB4 receptor tyrosine kinase transgenic mice develop glomerulopathies reminiscent of aglomerular vascular shunts. Mech Dev 120: 511–516, 2003 [DOI] [PubMed] [Google Scholar]
- 3.Costantini F. Genetic controls and cellular behaviors in branching morphogenesis of the renal collecting system. Wiley Interdisip Rev Dev Biol 1: 693–713, 2012 [DOI] [PMC free article] [PubMed] [Google Scholar]
- 4.Costantini F, Kopan R. Patterning a complex organ: branching morphogenesis and nephron segmentation in kidney development. Dev Cell 18: 698–712, 2010 [DOI] [PMC free article] [PubMed] [Google Scholar]
- 5.Das A, Tanigawa S, Karner CM, Xin M, Lum L, Chen C, Olson EN, Perantoni AO, Carroll TJ. Stromal-epithelial crosstalk regulates kidney progenitor cell differentiation. Nat Cell Biol 15: 1035–1044, 2013 [DOI] [PMC free article] [PubMed] [Google Scholar]
- 6.deMello DE, Sawyer D, Galvin N, Reid LM. Early fetal development of lung vasculature. Am J Respir Cell Mol Biol 16: 568–581, 1997 [DOI] [PubMed] [Google Scholar]
- 7.Dressler GR. Advances in early kidney specification, development and patterning. Development 136: 3863–3874, 2009 [DOI] [PMC free article] [PubMed] [Google Scholar]
- 8.Fraker CA, Alvarez S, Papadopoulos P, Giraldo J, Gu W, Ricordi C, Inverardi L, Dominguez-Bendala J. Enhanced oxygenation promotes β-cell differentiation in vitro. Stem Cells 25: 3155–3164, 2007 [DOI] [PubMed] [Google Scholar]
- 9.Heinis M, Simon MT, Ilc K, Mazure NM, Pouyssegur J, Scharfmann R, Duvillie B. Oxygen tension regulates pancreatic beta-cell differentiation through hypoxia-inducible factor 1α. Diabetes 59: 662–669, 2010 [DOI] [PMC free article] [PubMed] [Google Scholar]
- 10.Hirao M, Tamai N, Tsumaki N, Yoshikawa H, Myoui A. Oxygen tension regulates chondrocyte differentiation and function during endochondral ossification. J Biol Chem 281: 31079–31092, 2006 [DOI] [PubMed] [Google Scholar]
- 11.Hum S, Rymer C, Schaefer C, Bushnell D, Sims-Lucas S. Ablation of the renal stroma defines its critical role in nephron progenitor and vasculature patterning. PLOS ONE 9: e88400, 2014 [DOI] [PMC free article] [PubMed] [Google Scholar]
- 12.Hyink DP, Tucker DC, St John PL, Leardkamolkarn V, Accavitti MA, Abrass CK, Abrahamson DR. Endogenous origin of glomerular endothelial and mesangial cells in grafts of embryonic kidneys. Am J Physiol Renal Fluid Electrolyte Physiol 270: F886–F899, 1996 [DOI] [PubMed] [Google Scholar]
- 13.Jean JC, George E, Kaestner KH, Brown LA, Spira A, Joyce-Brady M. Transcription factor Klf4, induced in the lung by oxygen at birth, regulates perinatal fibroblast and myofibroblast differentiation. PLOS ONE 8: e54806, 2013 [DOI] [PMC free article] [PubMed] [Google Scholar]
- 14.Kobayashi A, Valerius MT, Mugford JW, Carroll TJ, Self M, Oliver G, McMahon AP. Six2 defines and regulates a multipotent self-renewing nephron progenitor population throughout mammalian kidney development. Cell Stem Cell 3: 169–181, 2008 [DOI] [PMC free article] [PubMed] [Google Scholar]
- 15.Kutcher ME, Herman IM. The pericyte: cellular regulator of microvascular blood flow. Microvasc Res 77: 235–246, 2009 [DOI] [PMC free article] [PubMed] [Google Scholar]
- 16.Lancrin C, Sroczynska P, Serrano AG, Gandillet A, Ferreras C, Kouskoff V, Lacaud G. Blood cell generation from the hemangioblast. J Mol Med 88: 167–172, 2010 [DOI] [PubMed] [Google Scholar]
- 17.Levinson RS, Batourina E, Choi C, Vorontchikhina M, Kitajewski J, Mendelsohn CL. Foxd1-dependent signals control cellularity in the renal capsule, a structure required for normal renal development. Development 132: 529–539, 2005 [DOI] [PubMed] [Google Scholar]
- 18.Madisen L, Zwingman TA, Sunkin SM, Oh SW, Zariwala HA, Gu H, Ng LL, Palmiter RD, Hawrylycz MJ, Jones AR, Lein ES, Zeng H. A robust and high-throughput Cre reporting and characterization system for the whole mouse brain. Nat Neurosci 13: 133–140, 2010 [DOI] [PMC free article] [PubMed] [Google Scholar]
- 19.Sequeira Lopez ML, Gomez RA. Development of the renal arterioles. J Am Soc Nephrol 22: 2156–2165, 2011 [DOI] [PMC free article] [PubMed] [Google Scholar]
- 20.Shah SR, Esni F, Jakub A, Paredes J, Lath N, Malek M, Potoka DA, Prasadan K, Mastroberardino PG, Shiota C, Guo P, Miller KA, Hackam DJ, Burns RC, Tulachan SS, Gittes GK. Embryonic mouse blood flow and oxygen correlate with early pancreatic differentiation. Dev Biol 349: 342–349, 2011 [DOI] [PMC free article] [PubMed] [Google Scholar]
- 21.Sims-Lucas S, Schaefer C, Bushnell D, Ho J, Logar A, Prochownik E, Gittes G, Bates CM. Endothelial progenitors exist within the kidney and lung mesenchyme. PLOS ONE 8: e65993, 2013 [DOI] [PMC free article] [PubMed] [Google Scholar]
- 22.Sullivan JC, Wang B, Boesen EI, D'Angelo G, Pollock JS, Pollock DM. Novel use of ultrasound to examine regional blood flow in the mouse kidney. Am J Physiol Renal Physiol 297: F228–F235, 2009 [DOI] [PMC free article] [PubMed] [Google Scholar]
- 23.Takasato M, Er PX, Becroft M, Vanslambrouck JM, Stanley EG, Elefanty AG, Little MH. Directing human embryonic stem cell differentiation towards a renal lineage generates a self-organizing kidney. Nat Cell Biol 16: 118–126, 2014 [DOI] [PubMed] [Google Scholar]
- 24.Wagner R, Van Loo D, Hossler F, Czymmek K, Pauwels E, Van Hoorebeke L. High-resolution imaging of kidney vascular corrosion casts with Nano-CT. Microsc Microanal 17: 215–219, 2011 [DOI] [PubMed] [Google Scholar]
- 25.Watson O, Novodvorsky P, Gray C, Rothman AM, Lawrie A, Crossman DC, Haase A, McMahon K, Gering M, Van Eeden FJ, Chico TJ. Blood flow suppresses vascular Notch signalling via dll4 and is required for angiogenesis in response to hypoxic signalling. Cardiovasc Res 100: 252–261, 2013 [DOI] [PMC free article] [PubMed] [Google Scholar]


