

Abstract
We have developed a highly detailed mathematical model of solute transport in the renal medulla of the rat kidney to study the impact of the structured organization of nephrons and vessels revealed in anatomic studies. The model represents the arrangement of tubules around a vascular bundle in the outer medulla and around a collecting duct cluster in the upper inner medulla. Model simulations yield marked gradients in intrabundle and interbundle interstitial fluid oxygen tension (Po2), NaCl concentration, and osmolality in the outer medulla, owing to the vigorous active reabsorption of NaCl by the thick ascending limbs. In the inner medulla, where the thin ascending limbs do not mediate significant active NaCl transport, interstitial fluid composition becomes much more homogeneous with respect to NaCl, urea, and osmolality. Nonetheless, a substantial Po2 gradient remains, owing to the relatively high oxygen demand of the inner medullary collecting ducts. Perhaps more importantly, the model predicts that in the absence of the three-dimensional medullary architecture, oxygen delivery to the inner medulla would drastically decrease, with the terminal inner medulla nearly completely deprived of oxygen. Thus model results suggest that the functional role of the three-dimensional medullary architecture may be to preserve oxygen delivery to the papilla. Additionally, a simulation that represents low medullary blood flow suggests that the separation of thick limbs from the vascular bundles substantially increases the risk of the segments to hypoxic injury. When nephrons and vessels are more homogeneously distributed, luminal Po2 in the thick ascending limb of superficial nephrons increases by 66% in the inner stripe. Furthermore, simulations predict that owing to the Bohr effect, the presumed greater acidity of blood in the interbundle regions, where thick ascending limbs are located, relative to that in the vascular bundles, facilitates the delivery of O2 to support the high metabolic requirements of the thick limbs and raises NaCl reabsorption.
Keywords: mathematical model, hypoxia, thick ascending limb transport, metabolism
anatomic studies in the medulla of rodent kidneys have revealed a highly structured organization of nephrons and vessels. In the inner stripe, descending vasa recta (DVR) and some of the ascending vasa recta (AVR) are isolated within tightly packed vascular bundles, separated from the thick ascending limbs (TALs) and collecting ducts (CDs). That arrangement continues into the upper inner medulla (IM), with CDs forming clusters that exclude DVR.
In the outer medulla (OM), the compartmentalization of medullary blood flow is believed to contribute to the vulnerability of the TAL to hypoxic injuries. Indeed, despite receiving ∼25% of the cardiac output, the mammalian kidney is susceptible to hypoxia, with medullary tissue oxygen tension of ∼20 and ∼10 mmHg in the OM and IM, respectively (42). The low renal oxygen tension can be attributed in part to the high metabolic demands of the Na+-K+-ATPase, which accounts for the majority of the energy consumption in the kidney. Because the thick limbs are found outside of the vascular bundles, an arrangement that limits their oxygen supply, they are vulnerable to hypoxic injuries. On the other hand, the countercurrent arrangement among the DVR and AVR within the vascular bundles is believed to preserve oxygen delivery for the IM. Besides preserving medullary oxygenation, the OM morphology is also believed to increase the osmolality of the tubular fluid delivered to the IM via the CD.
The implication of the medullary morphology on IM function appears to be less clear. It has been proposed that the medulla tubular-vascular patterns and relationships may facilitate the production of a highly concentrated urine (29, 59). Layton et al. (29) proposed that, in the upper IM, the countercurrent system in the central region of the CD cluster may function specifically to raise the osmolality of CD tubular fluid by facilitating the targeted delivery of NaCl via loop-bend segments. In the terminal IM, where the CD clusters can no longer be distinguished, the CDs and descending limbs may be well configured for the delivery of urea and NaCl, respectively, for a solute-mixing concentrating mechanism. However, while mathematical models of the proposed concentrating mechanism have predicted a moderately concentrated urine, with composition consistent with experimental findings (19, 49), those models have been unable to predict a urine osmolality near that of the maximum osmolality measured.
It has been proposed that the functional implication of the IM morphology lies not in the urine concentrating mechanism but in IM oxidative metabolism (57). Thus a principal goal of this study is to assess the extent to which the medullary anatomy affects oxygen transport. We further investigate the extent to which the resulting medullary oxygenation may have a significant impact on the concentrating mechanism.
MODEL DESCRIPTION
The model is based on a previously applied model of the urine concentrating mechanism of the rat kidney (29, 30, 31) and on an oxygen transport model of the rat OM (10, 11). We combined those models, both of which account for the three-dimensional (3D) architecture of the renal medulla using the “region-based” approach (more below), to simulate oxygen transport in the renal medulla. In addition to NaCl and urea (and a nonreabsorbable solute “NR” in the CD only), the present model also includes red blood cells (RBCs), hemoglobin (Hb), and O2.
Tubules and vasa recta are represented by rigid tubes that extend from the corticomedullary boundary (x = 0) to the papillary tip (x = L). The model represents loops of Henle, two-thirds of which turn at the OM-IM boundary and the remainder of which turn at all levels of the IM; the model also represents vasa recta that terminate or originate at all levels of the medulla and a composite CD. RBCs within vasa recta are represented by rigid tubes and interact with the surrounding plasma.
The region-based approach represents the 3D architecture of the renal medulla and the resulting preferential interactions among tubules and vessels by specifying the radial positions of those tubules and vessels within interconnected regions. Each region represents merged capillary plasma, interstitial cells, and interstitial space and is assumed to be a well-mixed compartment at a given medullary level. At every depth along the corticomedullary axis, a fraction of the DVR is assumed to peel off and supply the capillary plexus. Depending on the depth, different fractions of that dumped DVR flow are assigned to each of the regions. Within each region is a RBC compartment that represents RBCs within the capillaries that traverse that region. [This formulation of the capillary RBC differs from our previous work (11). Key model equations are given in the appendix.] To specify the relative positions of the tubules and vasa recta, each tubule or vas rectum is assigned to a particular region, or, in some cases, fractions of a tubule or vas rectum are distributed to two regions. Tubules and vasa recta that are in contact with different regions are influenced by different interstitial environments.
In the OM, four regions are represented, centered around a vascular bundle. The radial organization in the IM is also represented by means of four regions: one denotes a cluster of CDs, and the other three denote intercluster regions. The positions of the tubules and vessels are shown in Fig. 1. In the OM, vasa recta that supply the IM form the vascular bundle and are contained within the innermost region (R1). TALs, which have high metabolic demands owing to their active reabsorption of NaCl, are located in the interbundle regions (R3 and R4), distant from the oxygen-carrying DVR (34). In the upper 3–3.5 mm of the IM, CDs form clusters (R4), with DVR found outside those clusters (R1) (45, 46, 47, 48). In the remainder of the IM, CD clusters are no longer clearly distinguishable, and the radial organization of the tubules and vessels is assumed to be increasingly homogeneous.
Fig. 1.

Schematic diagram of a cross section through the outer stripe, inner stripe, upper inner medulla (IM), mid-IM, and deep IM, showing interstitial regions (R1, R2, R3, and R4) and relative positions of tubules and vessels. Decimal numbers indicate relative interaction weightings with regions. SDL/SAL, descending/ascending limbs of short loops of Henle; LDL/LAL, descending/ascending limbs of long loops of Henle; CD, collecting duct; SDV, short descending vasa recta; LDV, long descending vas rectum; AVRs, populations of ascending vasa recta. Subscripts S, M, and L associated with a LAL denote limbs that turn with the first millimeters of the IM (S), within the mid-IM (M), or reach into the deep IM (L). Dotted-line box in deep IM indicates that LDV, LDL, LALL, and CD are weighted evenly among the 4 regions.
Below we summarize key components of the model that represent oxygen consumption. Full model equations can be found in Refs. 11, 31.
O2 consumption.
The model represents basal O2 consumption by interstitial cells, vascular endothelial cells, and tubular epithelial cells, and O2 consumption for active transport in TALs, CDs, and proximal straight tubules. The volumetric rate of basal O2 consumption in tubule or vas rectum i is given by
| (1) |
where Ci,O2 is the concentration of O2 in tubule or vessel i, KM,O2 is the Michaelis constant, and Rmax,O2basal is the maximum volumetric rate of O2 consumption [in units of μmol/(cm2·s)]. Here, KM,O2 = 5.4 μM, under basal conditions for nitric oxide (8), and Rmax,O2basal = 10 μM/s (11).
As endothelial and epithelial cells are located between the interstitium and the tubule or vas rectum lumen, the fraction (θcell) of Ri,O2basal attributed to the lumen (here, taken to be 0.5) is calculated based on luminal CO2, whereas the remaining fraction (1 − θcell) is calculated based on the surrounding interstitial CO2 (11).
The model characterizes active NaCl transport (denoted Ψi,Naactive, a volumetric rate) by Michaelis-Menten kinetics
| (2) |
where Ci,Na is the Na+ concentration in tubule i, Vmax,i,Na denotes the maximum rate of Na+ transport [in nmol/(cm2·s)], and KM,Na is the Michaelis-Menten constant. At sufficiently low luminal Po2 (below some critical value Pi,c), the maximum transport rate becomes limited by O2 concentration and is assumed to be a linearly decreasing function of Po2. When this occurs, anaerobic metabolism may supply a fraction of the energy needed to actively transport NaCl, so that, in the absence of O2 supply, some of the active transport is sustained. Thus the maximum rate of Na+ transport is given by
| (3) |
where is the maximal rate of Na+ transport when oxygen is not limiting, and FAN is the fraction of due to anaerobic metabolism when Po2 = 0. We assume that FAN is 0.5 in the OMCD (54, 60), 0.4 in the IMCD (50), 0.1 in the TALs (3), and 0.14 in the proximal straight tubule (16).
In isolated mitochondria, the Po2 at which metabolism becomes oxygen limited is <1 mmHg (51). However, additional barriers to diffusion in tissue result in a significantly larger critical Po2 value in the renal medulla. A review of measured values outside of isolated mitochondria (40) reports a range from 6 to 28 mmHg in dog, rat, and rabbit specimens. Another review reports a more narrow range of 10 to 17 mmHg in isolated tubules and kidney cells (21). Based on these experimental measurements, we estimate a base-case value of Pi,c = 10 mmHg for both TALs and CDs.
The Na+-K+-ATPase stoichiometry suggests that at maximum efficiency, 18 mol of Na+ are reabsorbed through the transcellular pathway per mole of O2 consumed, which yields a TNa-to-QO2 (TQ, where TNa denotes the moles of Na+ transported, and QO2 denotes the amount of O2 consumed) ratio of 18. Favorable thermodynamic conditions may allow additional moles of Na+ to be reabsorbed paracellularly, thereby increasing the TQ ratio; conversely, unfavorable thermodynamic conditions would decrease the TQ ratio. Based on simulations of transport across tubular epithelia (41, 56), baseline TQ ratios were set to 18 for the ascending and descending limbs and 12 for the CD. (Simulation results, not shown, indicate that urine concentration is not substantially affected by physiological variations in TQ ratios.)
The model rate of O2 consumption due to active transport by the proximal straight tubule, TAL, or CD cells is given by
| (4) |
where ri is the inner radius of the tubule (denoted by i), Ai,cell is the cross-sectional area of the epithelial cells (in the plane perpendicular to the corticomedullary axis), and TQi is the TQ ratio of tubule i.
The DVR are assumed to deliver oxygen to the medulla as O2 dissolved in the blood and as HbO2 bound to Hb in the RBCs. The reaction kinetics of HbO2 dissociation are considerably faster than the diffusion of O2; thus the reaction is taken to be at equilibrium (11a). Equilibrium data for oxyhemoglobin saturation (So2) are well fitted by the Hill equation, such that So2, by definition, equals
| (5) |
where C50 is the O2 concentration at 50% saturation (taken to be 41.2 μM) and n is the Hill equation exponent (taken to be 2.6) (22). The dissolved O2 concentration is proportional to Po2, so that CO2 = αPo2, where α is the solubility coefficient. Here, α is taken to be 1.34 μM/mmHg in plasma and tubular fluid and 1.56 μM/mmHg in RBCs (11).
Model parameters not stated above can be found in Refs. 11, 31. Inflow and solute concentrations for the descending limbs and DVR are listed in Table 1; these boundary conditions are prescribed following our previous modeling study (32). Boundary conditions for the CD are described in the appendix.
Table 1.
Boundary conditions for descending tubules and vessels at x = 0
| DVR |
|||||
|---|---|---|---|---|---|
| SDL | LDL | CD | Plasma | RBC | |
| Fv,† nl/min | 10 | 12 | 6.6* | 6 | 2 |
| CNa, mM | 160 | 160 | 74.3* | 163.7 | 163.7 |
| Curea, mM | 15 | 15 | 164.6* | 8 | 8 |
| CO2, mM | 15.2 × 10⁻³ | 15.2 × 10⁻³ | 15.2 × 10⁻³ | 60.4 × 10⁻³ | 60.4 × 10⁻³ |
| CHb, mM | 0 | 0 | 0 | 0 | 3.0 |
| CHbO2, mM | 0 | 0 | 0 | 0 | 17.3 |
SDL/LDL, descending limb of short/long loop of Henle; DVR, descending vasa recta; RBC, red blood cells.
Collecting duct (CD) inflow concentrations (C) are obtained as described in the appendix.
Fluid flows (Fv) are given for individual tubule or vessel.
RESULTS
Base case results.
With the base-case parameters and boundary conditions, the overall supply of O2 to the OM, which is given by the total molar flow per nephron of O2 and HbO2 entering the descending vessels and tubules at the corticomedullary boundary, is computed to be 27.8 pmol·min−1·nephron−1. Of that supply, 81.2% (or, 22.6 pmol·min−1·nephron−1) is consumed in the OM, and 16.5% (or, 4.58 pmol·min−1·nephron−1) is delivered to the IM.
In the OM, the TALs, with their active NaCl transport, at a rate of 457.5 pmol·min−1·nephron−1, have by far the highest metabolic demand among all tubules and vessels, accounting for 97% of the total OM oxygen consumption of 22.6 pmol·min−1·nephron−1 (see Table 2). Thus the separation of the oxygen-supplying DVR, which are sequestered within the vascular bundles, from the TALs, which are located in the interbundle regions, generates a substantial radial gradient in interstitial Po2, as can be seen in Fig. 2A.
Table 2.
O2 consumption and Na+ reabsorption in OM and IM
| O2 consumption,* pmol·min−1·nephron−1 | Active Na+ Reabsorption,† pmol·min−1·nephron−1 |
||
|---|---|---|---|
| Base case | Base case | With Bohr effect | |
| OM | 22.6 | 457.5 | 477.6 |
| IM | 3.43 | 71.4 | 77.6 |
O2 consumption includes basal and active consumptions of all tubules and vessels.
Active Na+ reabsorption by thick ascending limb (TAL) in the outer medulla (OM) and by the CD in the inner medulla (IM).
Fig. 2.
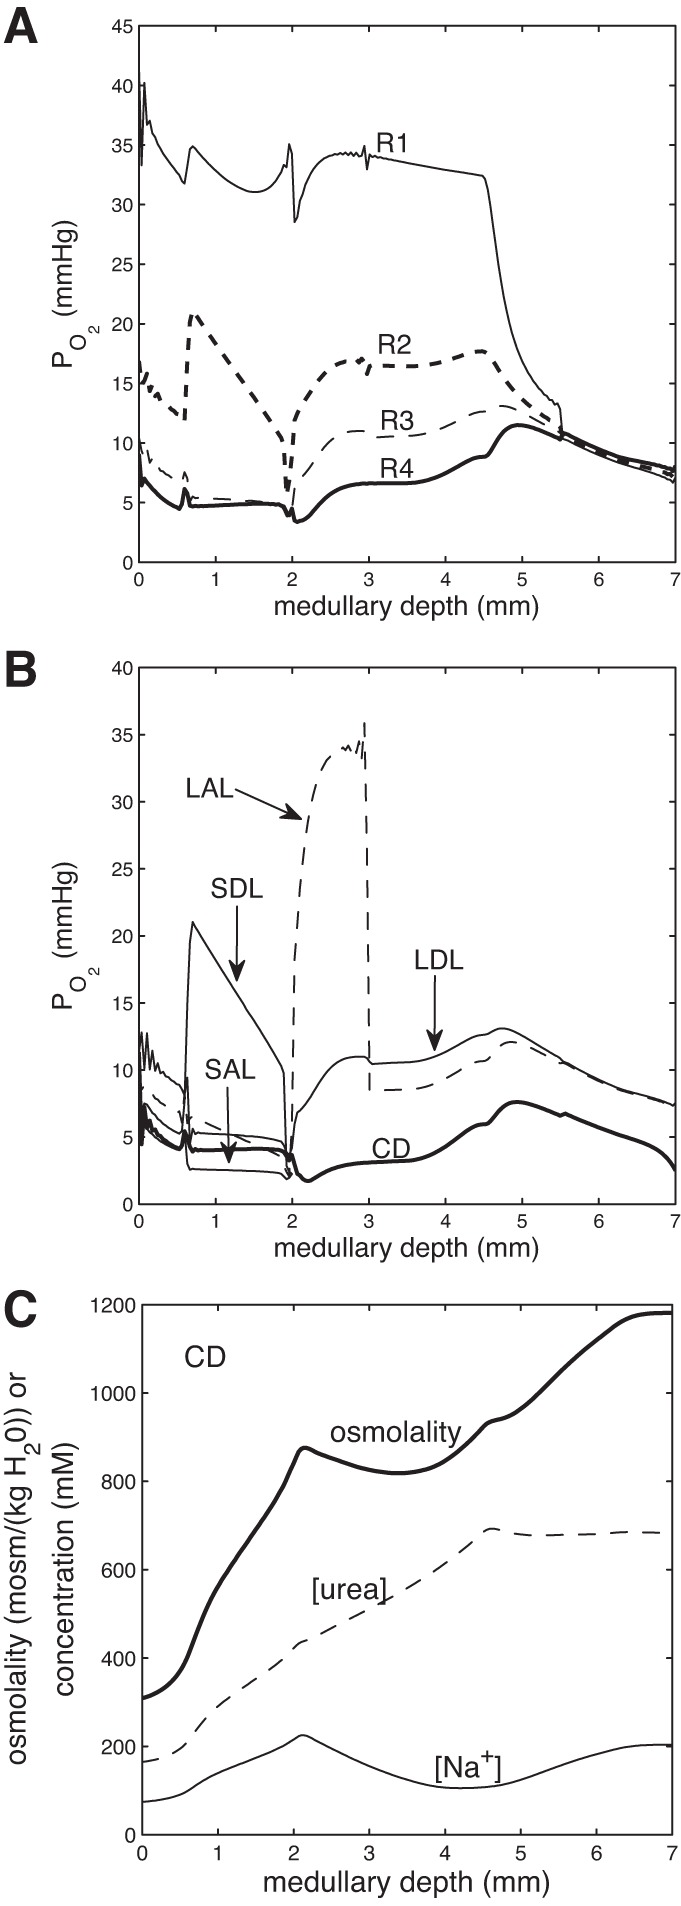
Concentration and osmolality profiles. A: interstitial region Po2. B: short loop, longest loop, and CD tubular fluid Po2. C: CD tubular fluid Na+ concentration, urea concentration, and osmolality.
An analogous configuration is found in the IM. There, the IMCD cells actively reabsorb NaCl and account for the majority (96%) of the IM O2 consumption. The total active NaCl reabsorption by IMCD is computed to be 77.6 pmol·min−1·nephron−1 (Table 2). In the upper IM, the CD occupies a position away from the DVR. As a result, a substantial radial gradient is again found in interstitial Po2 in the upper IM. That radial gradient dissipates in the deep IM, where the distribution of tubules and vessels becomes homogeneous. The luminal Po2 of the long ascending limb rises when it moves into an oxygen-rich position neighboring the DVR (see Fig. 2B). That luminal Po2 drops precipitously once active transport begins in the TALs.
The active reabsorption of NaCl from the TALs generates an axial fluid osmolality gradient along almost all structures, with the osmolality of the OMCD tubular fluid increasing 2.72-fold, from 309 mosmol/kgH2O at the corticomedullary boundary to 840 mosmol/kgH2O at the OM-IM boundary (see Fig. 2C). In the IM, the active NaCl transport of the CD is followed by water reabsorption, which lessens the osmotic load on the IM concentrating mechanism, allowing a moderately concentrated urine with an osmolality of 1,182 mosmol/kgH2O to be generated, at a rate of 0.098 nl·min−1·nephron−1.1
Impact of 3D architecture.
Our model represents the structural organization of the medulla by means of interconnected regions. To assess the impact of radial separation among different classes of tubules and vessels, we varied the solute permeabilities of the region boundaries. The degree of separation increases as the region boundary permeabilities decrease. In this study, the base-case boundary solute permeabilities are scaled by factors of ρ = 0.1, 10, and 100; ρ = 0.1 corresponds to greatest separation, whereas ρ = 100 corresponds to least separation.
When the degree of separation is lowered, oxygen delivery to the deep IM is reduced from 0.56 pmol·min−1·nephron−1 at 2.5 mm below the OM-IM boundary obtained for ρ = 0.1 to 0.15 pmol·min−1·nephron−1 for ρ = 100. Indeed, as can be seen from the interstitial Po2 profiles shown in Fig. 3, the model predicts that with a spatially homogeneous medulla (represented by ρ = 100), the deep IM is almost depleted of oxygen. This suggests that a functional role of the 3D architecture may be to preserve oxygen delivery to the papilla.
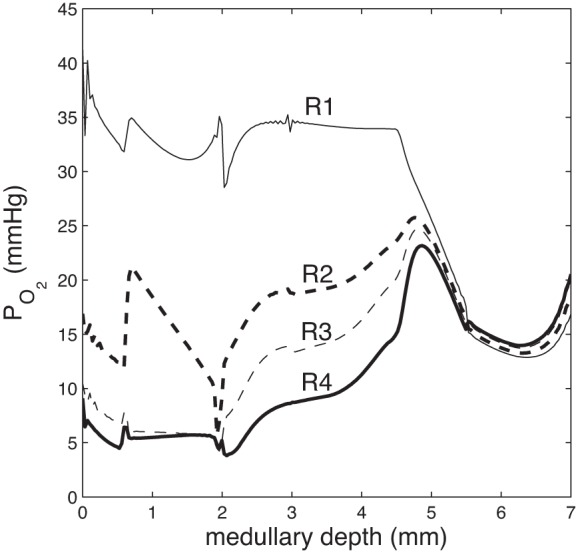
Fig. 3.

Region Po2 as a function of medullary depth, for varying degrees of regionalization, obtained by multiplying the region boundary solute permeabilities (PR,R′) by 0.1, 1 (base case), 10, and 100. When regionalization decreases, the separation between region Po2 decreases, and oxygen delivery to the deep IM decreases.
Through its effect on oxygen transport, medullary structural organization also impacts the urine concentrating mechanism. As the degree of separation decreases, the model predicts that the urine osmolality increases, as can be seen from the CD tubular fluid osmolality profiles shown in Fig. 4. This result is consistent with our previous sensitivity studies (30, 33). With more mixing, the OMCD delivers a less concentrated fluid to the IM. However, that decrease in OMCD fluid osmolality is accompanied by an elevation of fluid osmolality in the DVR. A more concentrated fluid carried by the DVR has less of a diluting effect on the IM concentrating mechanism, resulting in the eventual production of a more concentrated urine. These results suggest that the functional implication of the 3D architecture of the renal medulla may not lie in the production of a highly concentrated urine, or at least not directly, but rather in the delivery of a sufficiently oxygenated blood to the papilla.
Fig. 4.
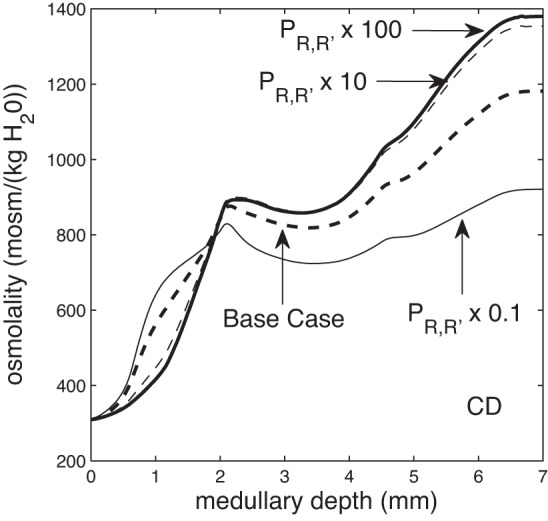
CD tubular fluid osmolality as a function of medullary depth, for varying degrees of regionalization, obtained by multiplying the region boundary solute permeabilities by 0.1, 1 (base case), 10, and 100. When regionalization decreases, CD tubular fluid osmolality attains a larger increase in the IM, resulting in a higher urine osmolality.
Because of their high metabolic demand and because of their separation from the vascular bundles, the TALs, particularly those of superficial nephrons, operate near hypoxia, with average luminal Po2 as low as 2.5 mmHg in the inner stripe. We hypothesize that when oxygen supply is decreased, the 3D architecture in the OM exacerbates the hypoxic conditions.
To assess the validity of that hypothesis, we consider a scenario that is known to frequently result in acute kidney injury: cardiac surgery performed on cardiopulmonary bypass (23). DVR inflow conditions are adjusted to simulate medullary blood flow during the surgery: boundary vascular flow is reduced to 5 nl/min and hematocrit is reduced to 0.14 (1).
Because the TALs appear to be most readily injured in hypoxia, we report TAL luminal Po2 and interstitial Po2 for the base case, and for two hypoxia scenarios, one with baseline 3D architecture and another with reduced separation (region permeabilities increased by 100-fold). These values, averaged over the outer stripe or inner stripe, are shown in Fig. 5. The model predicts that the short ascending limb operates at the lowest Po2. In the base case, its inner stripe luminal Po2 averages 2.46 mmHg; that Po2 falls by over 60% to 0.98 mmHg when oxygen supply is reduced, which indicates a significant danger of injury. A similar drop in Po2 is observed in the surrounding interstitial fluid. In the more homogeneous OM, however, average short ascending limb inner stripe luminal Po2 would be substantially higher, at 1.39 mmHg. Similar results are predicted for its surrounding interstitial fluid.
Fig. 5.
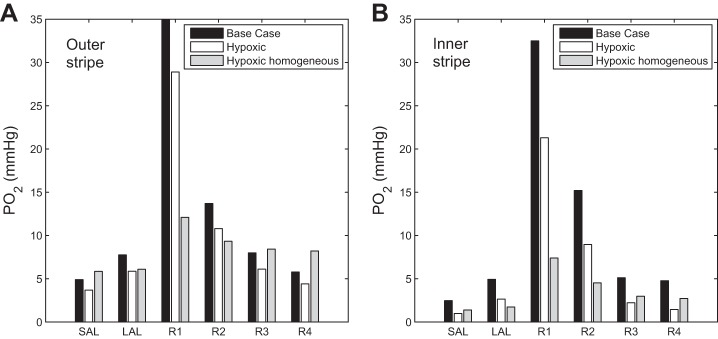
Simulated renal tissue oxygenation representing baseline and two hypoxic conditions. Vascular inflow and hematocrit are reduced under hypoxic conditions. “Hypoxic” assumes baseline medullary three-dimensional (3D) architecture; “Hypoxic homogeneous” assumes reduced regionalization. Results show average Po2 in the SAL lumen, LAL lumen, and interstitial fluid in the 4 regions, in the outer stripe (A) and inner stripe (B). Results suggest that the medullary 3D architecture renders the SAL particularly vulnerable to hypoxic injury under low medullary blood flow conditions.
Effects of varying vascular inflow.
Medullary blood flow is known to be modulated by vasopressin (13, 43, 53) and to increase when renal interstitial hydrostatic pressure is elevated (14). To understand how variations in medullary blood flow impact medullary oxygenation and urine concentration, we conduct simulations in which DVR fluid flow is set to 5, 7, 9, and 12 nl/min at the corticomedullary boundary (base-case inflow is 8 nl/min). Vascular boundary solute concentrations are kept at the base-case values.
The higher vascular flows raise medullary oxygen tension. With a vascular inflow of 12 nl/min, mid-inner stripe and papillary tip average Po2 were computed to be 16.4 and 12.1 mmHg, respectively, which correspond to 14 and 57% increases above base case. On the other hand, increasing vascular inflow to 9 and 12 nl/min results in 10.2 and 32.8% decreases in urine osmolality, respectively. This finding is intuitive, inasmuch as higher blood flow augments the load on the concentrating mechanism and consequently lowers the concentrating effect. This result is also consistent with the predictions of a whole-kidney model by Moss and Thomas (39), which only produces a moderately concentrated urine when only one out of five efferent arterioles associated with the juxtamedullary nephrons is assumed to perfuse the medulla (which yields a DVR inflow of ∼6.5 nl/min).
Decreasing vascular inflow to 7 and 5 nl/min yields two competing effects. The lower oxygen supply results in a lower Po2 everywhere, with interstitial fluid Po2 reduced by approximately 1–2 mmHg for the 7 nl/min case and approximately 2–8 mmHg for the 5 nl/min case. Taken in isolation, a sufficiently low Po2 limits Na+-K+-ATP transport activity and reduces urine concentration. Indeed, TAL active NaCl transport is slightly reduced, and the CD fluid osmolality is lower than base case in the outer stripe, albeit only by a minute amount. However, capillary flow is also reduced, which becomes a substantially more dominant effect in the inner stripe and IM, where the DVR break into radial capillary flow at a much higher rate than in the outer stripe. Together, these factors result in 9.7 and 30.0% increases in urine osmolality with DVR inflows of 7 and 5 nl/min, respectively, compared with base case.
Critical Po2 for active transport.
The critical Po2 values below which TAL and CD active transport becomes oxygen limited (denoted Pc) are not well characterized. To assess the sensitivity of model results to Pc, we conduct simulations for Pc = 1, 5, and 20 mmHg (base-case Pc = 10 mmHg). With a higher Pc, TAL active transport becomes slower and less O2 is consumed in the inner stripe, preserving more O2 for the IM. Consequently, IM Po2 is higher, as is the active reabsorption of NaCl by the IMCD, resulting in a slightly more concentrated urine. Nevertheless, the overall effect on the concentrating mechanism is small: as Pc increases from 1 to 20 mmHg, urine osmolality increases by only 1.6%. The effect on interstitial Po2 is noticeable but minor; see Fig. 6.
Fig. 6.
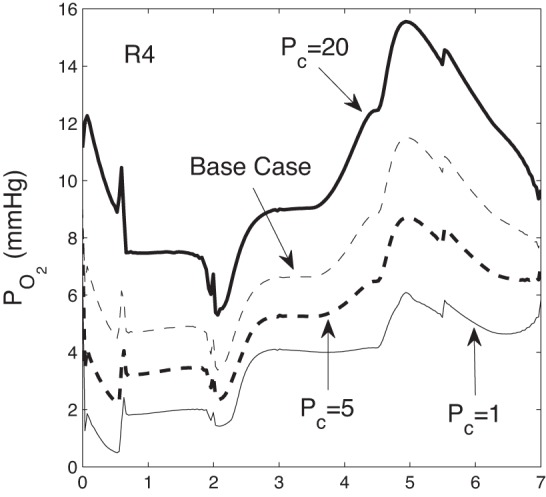
R4 Po2 as a function of medullary depth for critical Po2 Pc = 1, 5, 10 (base case), 20 mmHg.
Effect of pH on oxygenation and sodium transport.
In a phenomenon known as the Bohr effect, the affinity of Hb for O2 decreases with a decrease in pH. Burke et al. (9) observed an increase in tissue pH, from 7.20 to 7.31, after addition of furosemide, a finding that suggests the interstitial fluid surrounding the TALs may have a pH lower than that in the vascular bundles. Kuramochi et al. (27) measured pH values in the IM of 6.02 in the CD and 6.71 and 6.57 in the DVR and AVR, respectively, indicating that the IM is more acidic than the OM and that the interstitial fluid surrounding the IMCD may have a noticeably lower pH than that around the vasa recta. Thus the Bohr effect may play an important role in modulating O2 availability in the medulla.
To assess the impact of the Bohr effect, we allow the O2 dissociation curve to shift to the right under conditions of increased acidity. Specifically, we calculate the parameter C50 (in Eq. 5) as follows, assuming a constant Bohr coefficient of −0.48 (61):
| (6) |
where CO2 = αPo2, as in Eq. 5.
We assume that within the OM, fluid in the interstitium, vessels, and tubules has a pH of 7.4 in the vascular bundles (R1 and R2), and a pH of 7.2 in the interbundle regions (R3 and R4). In the IM, we decrease the pH linearly, such that at 1 mm above the papillary tip, the pH in the intercluster regions (R1 and R2) is 6.64, and that in the intracluster regions (R3 and R4) is 6.02 (27).
The acidity in the interbundle and intracluster regions (R3 and R4) facilitates the dissociation of HbO2; the predicted interstitial Po2 profiles are shown in Fig. 7. The higher O2 availability increases active Na+ reabsorption from the TALs and IMCDs, by 4.4 and 8.7%, respectively (see Table 2).
Fig. 7.
Region Po2 as a function of medullary depth, taking into account the shift in the oxygen dissociation curve due to the Bohr effect.
DISCUSSION
We extended a highly detailed mathematical model of oxygen transport in the OM of the rat kidney (10, 11) to include the IM. The model represents radial organization of renal tubules and vessels, with respect to vascular bundles in the OM and CD clusters in the IM, using a region-based approach. RBCs and oxygen consumption are explicitly represented. The model predicts in all represented structures the concentrations of Na+, urea, and O2 (and also Hb in RBCs), intratubular and intravascular flow rates of water and solutes, and transmural fluxes of water and solutes.
Comparison with experimental results.
Measurements of Po2 in the renal OM typically range from 20 to 30 mmHg (6, 17, 18, 37, 44). Model predictions are in agreement with the low end of the data (see Fig. 2). The significantly higher Po2 predicted in the core of the vascular bundles (30–40 mmHg) is likely irrelevant in a comparison with experimental data, owing to the near absence of interstitial cells in that region.
Po2 measurements in the renal IM range from 4 to 26 mmHg, generally measured in the upper half of the IM. In the dog kidney, Po2 was measured as 8–10 mmHg at a depth of 2–4 mm below the corticomedullary boundary, i.e., ∼0–2 mm below the OM-IM boundary (5). In the rat kidney, Po2 was estimated to be 25 mmHg at a depth of 1–2 mm below the OM-IM boundary (38). In the human kidney, Po2 was measured to be 26 mmHg at the OM-IM boundary and 22 mmHg at 3 mm below the OM-IM boundary (35). In another study using the dog kidney, a Po2 of ∼4 mmHg was measured in the IM (2). Model predictions from the present study generally lie within this range throughout the IM: in R2, Po2 ranges from 7.2 to 18 mmHg; in R3, Po2 ranges from 6.2 to 13 mmHg; and in R4, Po2 ranges from 3.4 to 12 mmHg.
The model predicts an oxygen consumption-to-delivery ratio of 81% in the OM, in good agreement with the estimate of 79% from Ref. 7, and an overall medullary ratio of 93.5%. Furthermore, the model predicts that basal metabolic rate contributes to ∼4% of overall oxygen consumption in the medulla, at the low end of the range of 3–18% estimated for the mammalian kidney (12). It is possible that the model underestimates the level of basal O2 consumption.
Impact of 3D architecture on medullary oxygenation.
Model results indicate that the separation of the oxygen-rich DVR from the metabolically demanding nephron segments generates a substantial Po2 radial gradient in the OM (see Fig. 2). That radial gradient preserves O2 delivery to the deep medulla. The model predicts that 16.5% of the medullary O2 supply reaches the IM. That fraction is rather large, inasmuch as almost four-fifths of the DVR turn within the OM, which implies that ∼80% of the medullary O2 supply must bypass the IM. However, because of the isolation of the DVR and (some) AVR within the vascular bundles and of their countercurrent arrangement, the DVR deliver to the IM a fluid with a relatively high Po2 (∼36 mmHg).
A similar Po2 radial gradient is predicted in the upper IM, where the DVR are situated away from the IMCD. That separation preserves oxygen delivery to deep IM in the base case, with 3.3% of the O2 supplied to the IM reaching the terminal 1.5 mm. When the arrangement of tubules and vessels is assumed nearly homogeneous throughout the medulla, the fractional O2 delivery drops to 0.8% (see Fig. 4).
Its separation from the DVR renders the TAL particularly vulnerable to hypoxic injury when medullary oxygen supply is reduced. One such example we considered is cardiopulmonary bypass surgery, of which acute kidney injury is a prevalent complication (23). Our calculations indicate that during surgery, hemodilution lowers medullary oxygen supply by 64%, from 27.8 (base case) to 9.95 pmol·min−1·nephron−1. Together medullary fractional oxygen extraction increases from 93.5 to 96.6%, and average inner stripe luminal Po2 of TAL of short loops falls from its base-case value of 2.46 to 0.98 mmHg, which suggests a substantial risk of hypoxic injury.
Impact of 3D architecture on solute distribution.
Model results indicate that the marked radial organization of the OM, in which tubules are organized around the vascular bundles, has a significant impact on the concentrations of the interstitial fluid that interacts with different tubules and vessels. This result has been predicted by many investigators (4, 15, 20, 24, 25, 26, 36, 52, 55, 59) and by our own modeling studies (11, 29, 32). In the context of the urine concentrating mechanism, the OM radial organization results in a focusing of TAL concentrating capacity on the descending limbs and CDs, resulting in a substantial radial NaCl concentration gradient, and thus an osmolality gradient, across the regions. Similarly, the high oxygen consumption rate of the TAL generates a marked radial Po2 gradient (see Fig. 2A).
The functional implication of the 3D architecture in the IM is more controversial. Recently, Weinstein (57) argued that the structure of the IM may have little effect on understanding the urine concentrating mechanism, as short diffusion distances between different regions and low relative fluxes across interstitial layers would lead to trivially small radial Na+ and urea concentration gradients. However, a substantial radial O2 concentration gradient could still be produced, due to IM consumption of O2, which would drive up fluxes in an interstitial layer with the same permeability.
Results from the present model support much of that hypothesis. The model predicts a much more homogeneous interstitial fluid NaCl concentration, urea concentration, and osmolality in the IM, relative to the OM, even in the initial IM where the structural organization of the tubules and vessels is assumed to be well defined. Again, this result is consistent with our previous modeling studies (30). The much smaller difference in NaCl concentration among the regions, compared with the OM, is a result of the absence of significant active Na+ transport in the thin ascending limbs.
In contrast, a marked Po2 gradient is predicted in the upper IM, where Po2 differences between regions are as high as 27 mmHg in the early IM (Fig. 2A), due in large part to active IMCD O2 consumption. Furthermore, simulation results suggest that the absence of regionalization would yield almost complete depletion of oxygen in the deep IM. Thus our results support the hypothesis of Weinstein (57) that the IM 3D architecture may serve to preserve oxygen delivery to the papilla, rather than to produce a highly concentrated urine.
Based on tubular separation values that Westrick et al. (58) measured, Weinstein (57) estimated the radial concentration gradients required to drive representative fluxes across a 10-μm IM interstitial layer, which is the distance between a typical descending limb and its closest IMCD. To compare Weinstein's estimates with predictions by the present model, we consider the concentration differences between R3 and R4, where the descending limbs and CD are located, respectively. Note, however, that in the model, R3 and R4 separate a typical descending limb and a typical IMCD, whereas the 10-μm distance used by Weinstein represents the separation between a typical descending limb and its closest IMCD. Table 3 shows fluxes and concentration gradients predicted by our model and estimated by Weinstein, assuming 80% diffusion hindrance by structures within the interstitial layer. Solute fluxes are obtained 1 mm below the OM-IM boundary. The concentration gradients are given by the difference between R3 and R4. The present model predicts relatively small IMCD urea fluxes in the upper IM, because the IMCD is assumed to have a large urea permeability in the deep IM only. The concentration differences predicted by the model agree well with Weinstein's estimates. The discrepancies can be attributed, in part, to 1) water reabsorption from the CD and other water-permeable structures, which may reduce the concentration gradient; and 2) solute fluxes from structures other than the CD.
Table 3.
Solute fluxes and radial concentration gradients across a 10-μm IM interstitial layer, 1 mm below the OM-IM boundary
Anaerobic metabolism.
Experiments have demonstrated that when Po2 becomes critically low in the rat IMCD, cellular ATP levels can be maintained at 40% of the control (i.e., the case when the IM CD is sufficiently oxygenated) (50). In the mouse OMCD, ATP levels are 80% of control in the deoxygenated case (54) vs. 30–40% in the rabbit (60). Thus FAN is taken to be 0.4 in the IMCD and 0.5 in the OMCD. In the medullary TALs, data from mice indicate that the ATP levels drop without oxygen to ∼5% of control (54). Under hypoxic conditions, lactate production can increase significantly in the rat medullary TAL (3), indicating that anaerobic metabolism may be higher in the rat medullary TAL than in the mouse. Thus FAN is taken to be 0.1 in the medullary TAL. Experiments in the rat proximal tubules (16) indicate that ATP levels drop 86% compared with control in the absence of oxygen. Although these data are not from the rat, they represent the closest available estimate; thus FAN is taken to be 0.14 in the model proximal tubule.
The model predicts that, under baseline conditions, only a small fraction of the TAL active transport is anaerobic. Suppose the contribution of anaerobic metabolism (denoted rAN) is given by the ratio of anaerobic to total (aerobic and anaerobic) active NaCl transport. The model estimates rAN to be 19 and 7% for the long and short ascending limbs, respectively. The fraction of anaerobic active NaCl transport is substantially higher for the CD, in large part because of its higher FAN value (see discussion): rAN is evaluated as 34% for the OMCD and 46% for the IMCD.
In summary, model results suggest that the 3D medullary architecture preserves oxygen delivery to the deep IM but also significantly increases the likelihood of hypoxic injury in the TALs. If the interbundle region, where the medullary TALs are located, is more acidic than the vascular bundles, then O2 delivery to TALs will increase, as will NaCl reabsorption from the thick limbs.
GRANTS
This research was supported by the National Institute of Diabetes and Digestive and Kidney Diseases Grant DK-089066.
DISCLOSURES
No conflicts of interest, financial or otherwise, are declared by the author(s).
AUTHOR CONTRIBUTIONS
Author contributions: B.C.F., A.E., and A.T.L. conception and design of research; B.C.F. performed experiments; B.C.F., A.E., I.S., and A.T.L. analyzed data; B.C.F., A.E., I.S., and A.T.L. interpreted results of experiments; B.C.F. prepared figures; B.C.F. and A.T.L. drafted manuscript; B.C.F., A.E., I.S., and A.T.L. edited and revised manuscript; B.C.F., A.E., I.S., and A.T.L. approved final version of manuscript.
Appendix
Model equations for capillary RBCs.
In Ref. 11, capillary RBCs were explicitly represented as radially traversing tubes. That formulation requires the estimate of the total length of capillaries within each region, which is not well characterized. Furthermore, each medullary depth is associated with a series of capillary tubes, all of which must be discretized in the numerical computations, adding to the computational cost. Thus, in the present study, we have adopted a simpler formulation that represents RBCs within the capillaries that traverse a given region as a RBC compartment. The two formulations yield very similar results, with the new formulation having a substantially lower computational cost.
Solute conservation for the capillary RBC (denoted B) in region R is given by:
| (7) |
where k denotes the solute index. A schematic diagram is shown in Fig. A1. The first term represents the diffusive solute flux into the RBC from the associated interstitial region. The next term represents the solute flux from descending RBC tubes terminating at level y = x into the capillary RBC region compartments (where −dωDRBC/dx represents the rate at which descending RBC tubes break up at depth x and empty into capillary RBCs). The coefficients αB represent the fraction of total descending RBC (DRBC) flow dumped into the particular capillary RBC compartment. In the OM, these coefficients are given by αB1 = 1 − αB2, αB2 = 0.95, and αB3 = αB4 = 0; in the IM, they are αB1 = 1 − αB3 − αB4, αB2 = 0, αB3 = 0.3, and αB4 = 0.5. The term CB′,kQB′,B − CB,k (QARBC + QB,B″) represents the net solute that is carried by flow at the local concentration into ascending RBCs (ARBCs) or into a neighboring capillary RBC compartment. A fraction βB,i (i = OM,IM) of net fluid accumulation in RBC region B is taken up by ARBCs, and the remainder enters the next region, B″. Here, QB′,B represents flow dumped from capillary RBC compartment B′ into capillary RBC compartment B. Similarly, QB,B″ represents flow dumped from compartment B into compartment B″. In the OM, we have
| (8) |
where βB1,OM = 0.95, βB2,OM = 0.05, and βB3,OM = 0.2. In the IM, we have
| (9) |
where βB4,IM = 0.5, βB1,IM = 0.9, and βB3,IM = 0.99. The last term in Eq. 7 denotes the consumption rate of solute k by scavenging reactions; AB is the cross-sectional area, per nephron, occupied by capillary RBCs in region R. The solute permeability between RBC compartment B and its surrounding region R is the same in all four regions; here, PB,R,urea = 1.56 × 10⁻⁴ cm/s, PB,R,O2 = 1.33 × 10⁻³ cm/s, and PB,R,k = 0 for k = Na+, HbO2, and Hb (28). AB is a function of medullary depth in the IM and in the outer stripe of the OM. In the outer stripe, AB changes linearly, from 1.50 × 10⁻⁷ to 2.01 × 10⁻⁷ cm2 in B1, from 3.96 × 10⁻⁶ to 6.88 × 10⁻⁷ cm2 in B2, from 1.69 × 10⁻⁶ to 5.47 × 10⁻⁷ cm2 in B3, and from 1.79 × 10⁻⁷ to 1.37 × 10⁻⁷ cm2 in B4. In the inner stripe, AB is constant, equal to 2.01 × 10⁻⁷ cm2 in B1, 6.88 × 10⁻⁷ cm2 in B2, 5.47 × 10⁻⁷ cm2 in B3, and 1.37 × 10⁻⁷ cm2 in B4. In the IM, AB is a function of CD population, which decreases exponentially from its inner stripe value at the OM-IM boundary to zero at the papillary tip.
Fig. A1.
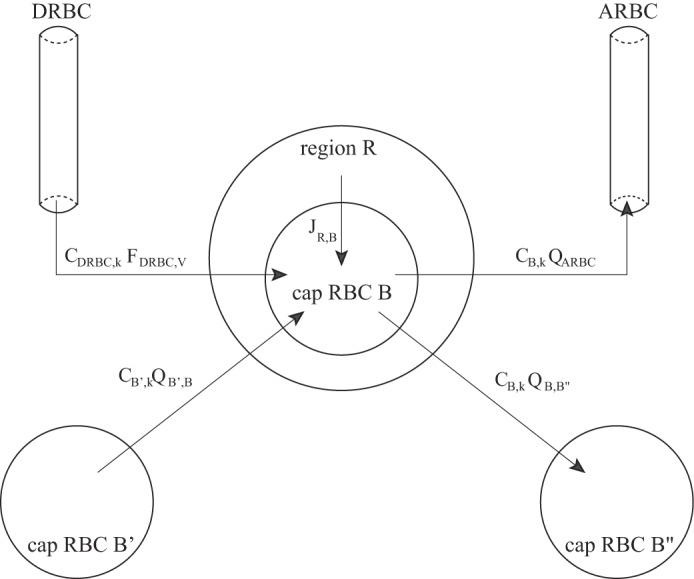
Schematic diagram of a capillary red blood cell (RBC) compartment B (denoted “cap RBC”) and its associated solute fluxes, from Eq. 7. The JR,B term corresponds to the first term of Eq. 7, representing diffusive flux between the RBC compartment B and its surrounding region R.
Water conservation for the capillary RBC compartment is given by:
| (10) |
The first term represents water flux between RBC capillary compartment B and neighboring region R, where dB is the product of the water partial molar volume and the water permeability, σk is the reflection coefficient for solute k, and ϕk is the osmotic coefficient of solute k. The second term represents the water flux from descending RBC tubes terminating at level y = x into capillary RBC compartment B. The remaining terms represent the water source and sink terms associated with the ascending RBC (QARBC) or into neighboring capillary RBC compartments (QB′,B and QB,B″). The first three terms in Eq. 10 are used to determine the total accumulation of water flow in compartment B, which then determines QARBC and QB,B″.
CD inflow boundary conditions.
Boundary conditions for CD inflow follow our previous approach (29, 32) with minor adjustments in parameters. The model assumes that 1) 82% of the water that is delivered to the early distal tubule by the cortical TAL is absorbed in the cortex by the distal tubule, connecting tubules, and cortical CD; 2) the osmolality of CD fluid at the corticomedullary boundary is equal to blood plasma osmolality, and NR concentration is set to 7 mM; 3) CD O2 concentration is set to 15.2 × 10⁻³ mM (11.3 mmHg); and 4) 92.5% of the Na+ that is delivered to the early distal tubule by the cortical TAL is absorbed in the cortex. Together, these assumptions determine CD boundary fluid flow and all solute concentrations.
Footnotes
We use the word “osmotic load” to mean a descending tubular or vascular fluid flow that must be concentrated by the concentrating mechanism.
REFERENCES
- 1.Andersson LG, Bratteby LE, Ekroth R, Hallhagen S, Joachimsson PO, Linden van der J, Wesslén O. Renal function during cardiopulmonary bypass: influence of pump flow and systemic blood pressure. Eur J Cardiothorac Surg 8: 597–602, 1994 [DOI] [PubMed] [Google Scholar]
- 2.Aperia AC. The influence of arterial PO2 on renal tissue PO2. Acta Physiol Scand 75: 353–359, 1969 [DOI] [PubMed] [Google Scholar]
- 3.Bagnasco S, Good D, Balaban R, Burg M. Lactate production in isolated segments of the rat nephron. Am J Physiol Renal Fluid Electrolyte Physiol 248: F522–F526, 1985 [DOI] [PubMed] [Google Scholar]
- 4.Bankir L, de Rouffignac C. Urinary concentrating ability: insights from comparative anatomy. Am J Physiol Regul Integr Comp Physiol 249: R643–R666, 1985 [DOI] [PubMed] [Google Scholar]
- 5.Baumgartl H, Leichtweiss HP, Lubbers DW, Weiss C, Huland H. The oxygen supply of the dog kidney: measurements of intrarenal pO2. Microvasc Res 4: 247–257, 1972 [DOI] [PubMed] [Google Scholar]
- 6.Brezis M, Heyman SN, Epstein FH. Determinants of intrarenal oxygenation. II. Hemodynamic effects. Am J Physiol Renal Fluid Electrolyte Physiol 267: F1063–F1068, 1994 [DOI] [PubMed] [Google Scholar]
- 7.Brezis M, Rosen S, Silva P, Epstein FH. Renal ischemia: a new perspective. Kidney Int 26: 375–383, 1984 [DOI] [PubMed] [Google Scholar]
- 8.Buerk D, Lamkin-Kennard K, Jaron D. Modeling the influence of superoxide dismutase on superoxide and nitric oxide interactions, including reversible inhibition of oxygen consumption. Free Radic Biol Med 34: 1488–1503, 2003 [DOI] [PubMed] [Google Scholar]
- 9.Burke TJ, Malhotra D, Shapiro JL. Factors maintaining a pH gradient within the kidney: role of the vascular architecture. Kidney Int 56: 1826–1837, 1999 [DOI] [PubMed] [Google Scholar]
- 10.Chen J, Edwards A, Layton AT. A mathematical model of oxygen transport in the rat outer medulla: II. Impacts of outer medullary architecture. Am J Physiol Renal Physiol 297: F537–F548, 2009 [DOI] [PMC free article] [PubMed] [Google Scholar]
- 11.Chen J, Layton AT, Edwards A. A mathematical model of oxygen transport in the rat outer medulla: I. Model formulation and baseline results. Am J Physiol Renal Physiol 297: F517–F536, 2009 [DOI] [PMC free article] [PubMed] [Google Scholar]
- 11a.Clark A, Jr, Federspiel WJ, Clark PA, Cokelet GR. Oxygen delivery from red cells. Biophys J 47: 171–181, 1985 [DOI] [PMC free article] [PubMed] [Google Scholar]
- 12.Cohen JJ, Kamm DE. Renal metabolism: relation to renal function. In: The Kidney (2nd ed), edited by Brenner BM, Rector RC. Philadelphia, PA: Saunders, 1981, p. 144–248 [Google Scholar]
- 13.Correia AG, Denton KM, Evans RG. Effects of activation of vasopressin-V1-receptors on regional kidney blood flow and glomerular arteriole diameters. J Hypertens 19: 649–657, 2001 [DOI] [PubMed] [Google Scholar]
- 14.Cowley AW., Jr Control of the renal medullary circulation by vasopressin v1 and v2 receptors in the rat. Exp Physiol 85: 223s–231s, 2000 [DOI] [PubMed] [Google Scholar]
- 15.de Rouffignac C. The urinary concentrating mechanism. In: Urinary Concentrating Mechanisms, edited by Kinne RK. Basel, Switzerland: Karger, 1990, p. 31–102 [Google Scholar]
- 16.Dickman KG, Mandel LJ. Differential effects of respiratory inhibitors on glycolysis in proximal tubules. Am J Physiol Renal Fluid Electrolyte Physiol 258: F1608–F1615, 1990 [DOI] [PubMed] [Google Scholar]
- 17.Dinour D, Brezis M. Effects of adenosine on intrarenal oxygenation. Am J Physiol Renal Fluid Electrolyte Physiol 261: F787–F791, 1991 [DOI] [PubMed] [Google Scholar]
- 18.dos Santos E, Li LP, Ji L, Prasad P. Early changes with diabetes in renal medullary hemodynamics as evaluated by fiberoptic probes and bold magnetic resonance imaging. Invest Radiol 42: 157–162, 2007 [DOI] [PMC free article] [PubMed] [Google Scholar]
- 19.Hai MA, Thomas S. The time-course of changes in renal tissue composition during lysine vasopressin infusion in the rat. Pflügers Arch 310: 297–319, 1969 [DOI] [PubMed] [Google Scholar]
- 20.Jamison RL, Kriz W. Urinary Concentrating Mechanism: Structure and Function. New York: Oxford Univ Press, 1982 [Google Scholar]
- 21.Jones DP. Renal metabolism during normoxia, hypoxia, and ischemic injury. Annu Rev Physiol 48: 33–50, 1986 [DOI] [PubMed] [Google Scholar]
- 23.Karkouti Ke Wijeysundera DN, Yau TM, Callum JL, Cheng DC, Crowther M, Dupuis JY, Fremes SE, Kent B, Laflamme C, Lamy A, Legare JF, Mazer CD, McCluskey SA, Rubens FD, Sawchuk C, Beattie WS. Acute kidney injury after cardiac surgery: focus on modifiable risk factors. Circulation 119: 495–502, 2009 [DOI] [PubMed] [Google Scholar]
- 24.Knepper MA, Roch-Ramel F. Pathways of urea transport in the mammalian kidney. Kidney Int 31: 629–633, 1987 [DOI] [PubMed] [Google Scholar]
- 25.Kriz W. Structural organization of the renal medulla: comparative and functional aspects. Am J Physiol Regul Integr Comp Physiol 241: R3–R16, 1981 [DOI] [PubMed] [Google Scholar]
- 26.Kriz W, Lever AF. Renal countercurrent mechanisms: structure and function. Am Heart J 78: 101–118, 1969 [DOI] [PubMed] [Google Scholar]
- 27.Kuramochi G, Kersting U, Silbernagl S, Dantzler WH. Changes in the countercurrent system in the renal papilla: diuresis increases pH and HCO3− gradients between collecting duct and vasa recta. Pflügers Arch 432: 1062–1068, 1996 [DOI] [PubMed] [Google Scholar]
- 28.Layton AT. Role of UTB urea transporters in the urine concentrating mechanism of the rat kidney. Bull Math Biol 69: 887–929, 2007 [DOI] [PubMed] [Google Scholar]
- 29.Layton AT. A mathematical model of the urine concentrating mechanism in the rat renal medulla: I. Formulation and base-case results. Am J Physiol Renal Physiol 300: F356–F371, 2011 [DOI] [PMC free article] [PubMed] [Google Scholar]
- 30.Layton AT. A mathematical model of the urine concentrating mechanism in the rat renal medulla: II. Functional impliciations of three-dimensional architecture. Am J Physiol Renal Physiol 300: F372–F394, 2011 [DOI] [PMC free article] [PubMed] [Google Scholar]
- 31.Layton AT, Dantzler WH, Pannabecker TL. Urine concentrating mechanism: impact of vascular and tubular architecture and a proposed descending limb urea-Na+ cotransporter. Am J Physiol Renal Physiol 302: F591–F605, 2012 [DOI] [PMC free article] [PubMed] [Google Scholar]
- 32.Layton AT, Layton HE. A region-based mathematical model of the urine concentrating mechanism in the rat outer medulla: I. Formulation and base-case results. Am J Physiol Renal Physiol 289: F1346–F1366, 2005 [DOI] [PubMed] [Google Scholar]
- 33.Layton AT, Pannabecker TL, Dantzler WH, Layton HE. Hyperfiltration and innerstripe hypertrophy may explain findings by Gamble and coworkers. Am J Physiol Renal Physiol 298: F962–F972, 2010 [DOI] [PMC free article] [PubMed] [Google Scholar]
- 34.Lemley KV, Kriz W. Cycles and separations: the histotopography of the urinary concentrating process. Kidney Int 31: 538–548, 1987 [DOI] [PubMed] [Google Scholar]
- 35.Leonhardt KO, Landes RR. Oxygen tension of the urine and renal structures. N Engl J Med 269: 115–121, 1963 [DOI] [PubMed] [Google Scholar]
- 36.Lever AF, Kriz W. Countercurrent exchange between the vasa recta and the loop of Henle. Lancet 14: 1057–1060, 1966 [DOI] [PubMed] [Google Scholar]
- 37.Liss P, Nygren A, Erikson U, Ulfendahl HR. Injection of low and iso-osmolar contrast medium decreases oxygen tension in the renal medulla. Kidney Int 53: 698- 702, 1998 [DOI] [PubMed] [Google Scholar]
- 38.Liss P, Nygren A, Revsbech NP, Ulfendahl HR. Intrarenal oxygen tension measured by a modified clark electrode at normal and low blood pressure and after injection of x-ray contrast media. Pflügers Arch 434: 705–711, 1997 [DOI] [PubMed] [Google Scholar]
- 39.Moss R, Thomas SR. Hormonal regulation of salt and water excretion: a mathematical model of whole kidney function and pressure natriuresis. Am J Physiol Renal Physiol 306: F224–F248, 2014 [DOI] [PubMed] [Google Scholar]
- 40.Nelimarkka O. Renal oxygen and lactate metabolism in hemorrhagic shock. An experimental study. Acta Chir Scand Suppl 518: 1–44, 1984 [PubMed] [Google Scholar]
- 41.Nieves-Gonzalez A, Clausen C, Layton AT, Layton HE, Moore LC. Transport efficiency and workload distribution in a mathematical model of the thick ascending limb. Am J Physiol Renal Physiol 304: F653–F664, 2013 [DOI] [PMC free article] [PubMed] [Google Scholar]
- 42.Neuhofer W, Beck FX. Cell survival in the hostile environment of the renal medulla. Annu Rev Physiol 67: 531–555, 2005 [DOI] [PubMed] [Google Scholar]
- 43.Pallone TL, Turner MR, Edwards A, Jamison RL. Countercurrent exchange in the renal medulla. Am J Physiol Regul Integr Comp Physiol 284: R113–R1175, 2003 [DOI] [PubMed] [Google Scholar]
- 44.Palm F, Friedrich M, Carlsson PO, Hansell P, Teerlink T, Liss P. Reduced nitric oxide in diabetic kidneys due to increased hepatic arginine metabolism: implications for renomedullary oxygen availability. Am J Physiol Renal Physiol 294: F30–F37, 2008 [DOI] [PubMed] [Google Scholar]
- 45.Pannabecker TL, Abbott DE, Dantzler WH. Three-dimensional functional reconstruction of inner medullary thin limbs of Henle's loop. Am J Physiol Renal Physiol 286: F38–F45, 2004 [DOI] [PubMed] [Google Scholar]
- 46.Pannabecker TL, Dantzler WH. Three-dimensional lateral and vertical relationship of inner medullary loops of Henle and collecting duct. Am J Physiol Renal Physiol 287: F767–F774, 2004 [DOI] [PubMed] [Google Scholar]
- 47.Pannabecker TL, Dantzler WH. Three-dimensional architecture of inner medullary vasa recta. Am J Physiol Renal Physiol 290: F1355–F1366, 2006 [DOI] [PubMed] [Google Scholar]
- 48.Pannabecker TL, Dantzler WH. Three-dimensional architecture of collecting ducts, loops of Henle, and blood vessels in the renal papilla. Am J Physiol Renal Physiol 293: F696–F704, 2007 [DOI] [PubMed] [Google Scholar]
- 49.Pennell JP, Lacy FB, Jamison RL. An in vivo study of the concentrating process in the descending limb of Henle's loop. Kidney Int 5: 337–347, 1974 [DOI] [PubMed] [Google Scholar]
- 50.Stokes JB, Grupp C, Kinne RK. Purification of rat papillary collecting duct cells: functional and metabolic assessment. Am J Physiol Renal Fluid Electrolyte Physiol 253: F251–F262, 1987 [DOI] [PubMed] [Google Scholar]
- 51.Sugano T, Oshino N, Chance B. Mitochondrial functions under hypoxic conditions: the steady states of cytochrome c reduction and of energy metabolism. Acta Chir Scand Suppl 518: 1–44, 1984 [DOI] [PubMed] [Google Scholar]
- 52.Thomas SR. Cycles and separations in a model of the renal medulla. Am J Physiol Renal Physiol 275: F671–F690, 1998 [DOI] [PubMed] [Google Scholar]
- 53.Turner MR, Pallone TL. Vasopressin constricts outer medullary descending vasa recta isolated from rat kidneys. Am J Physiol Renal Physiol 272: F147–F151, 1997 [DOI] [PubMed] [Google Scholar]
- 54.Uchida S, Endou H. Substrate specificity to maintain cellular ATP along the mouse nephron. Am J Physiol Renal Fluid Electrolyte Physiol 255: F977–F983, 1988 [DOI] [PubMed] [Google Scholar]
- 55.Valtin H. Structural and functional heterogeneity of mammalian nephrons. Am J Physiol Renal Fluid Electrolyte Physiol 233: F491–F501, 1977 [DOI] [PubMed] [Google Scholar]
- 56.Weinstein AM. A mathematical model of the inner medullary collecting duct of the rat: pathways for Na and K transport. Am J Physiol Renal Physiol 274: F841–F855, 1998 [DOI] [PubMed] [Google Scholar]
- 57.Weinstein AM. Identifying renal medullary neighborhoods–when do distances matter? Am J Physiol Renal Physiol 304: F1411–F1412, 2013 [DOI] [PMC free article] [PubMed] [Google Scholar]
- 58.Westrick KY, Serack B, Dantzler WH, Pannabecker TL. Axial compartments of descending and ascending thin limbs of Henle's loops. Am J Physiol Renal Physiol 304: F308–F316, 2013 [DOI] [PMC free article] [PubMed] [Google Scholar]
- 59.Wexler AS, Kalaba RE, Marsh DJ. Three-dimensional anatomy and renal concentrating mechanism. I. Modeling results. Am J Physiol Renal Fluid Electrolyte Physiol 260: F368–F383, 1991 [DOI] [PubMed] [Google Scholar]
- 60.Zeidel ML, Silva P, Seifter JL. Intracellular ph regulation and proton transport by rabbit renal medullary collecting duct cells: role of plasma membrane proton adenosine triphosphatase. J Clin Invest 77: 113–120, 1986 [DOI] [PMC free article] [PubMed] [Google Scholar]
- 61.Zhang Y, Kobayashi K, Kitazawa K, Imai K, Kobayashi M. Contribution of cooperativity and the Bohr effect to efficient oxygen transport by hemoglobins from five mammalian species. Zoolog Sci 23: 49–55, 2006 [DOI] [PubMed] [Google Scholar]