

Abstract
Immobilization causes skeletal muscle atrophy via complex signaling pathways that are not well understood. To better understand these pathways, we investigated the roles of p53 and ATF4, two transcription factors that mediate adaptations to a variety of cellular stresses. Using mouse models, we demonstrate that 3 days of muscle immobilization induces muscle atrophy and increases expression of p53 and ATF4. Furthermore, muscle fibers lacking p53 or ATF4 are partially resistant to immobilization-induced muscle atrophy, and forced expression of p53 or ATF4 induces muscle fiber atrophy in the absence of immobilization. Importantly, however, p53 and ATF4 do not require each other to promote atrophy, and coexpression of p53 and ATF4 induces more atrophy than either transcription factor alone. Moreover, muscle fibers lacking both p53 and ATF4 are more resistant to immobilization-induced atrophy than fibers lacking only p53 or ATF4. Interestingly, the independent and additive nature of the p53 and ATF4 pathways allows for combinatorial control of at least one downstream effector, p21. Using genome-wide mRNA expression arrays, we identified p21 mRNA as a skeletal muscle transcript that is highly induced in immobilized muscle via the combined actions of p53 and ATF4. Additionally, in mouse muscle, p21 induces atrophy in a manner that does not require immobilization, p53 or ATF4, and p21 is required for atrophy induced by immobilization, p53, and ATF4. Collectively, these results identify p53 and ATF4 as essential and complementary mediators of immobilization-induced muscle atrophy and discover p21 as a critical downstream effector of the p53 and ATF4 pathways.
Keywords: skeletal muscle, skeletal muscle atrophy, immobilization, p53, activating transcription factor 4, p21
injuries and illnesses typically involve a period of immobilization that may be generalized (as in bed rest) or localized (as in limb casting). Immobilization can have therapeutic effects; for example, it can allow healing of a fracture. However, immobilization also has a deleterious consequence, skeletal muscle atrophy. When skeletal muscles are immobilized, they undergo disuse muscle atrophy. This causes weakness, which in turn delays recovery (2, 4). Physical therapy is often employed to enhance recovery of muscle mass and strength but is frequently insufficient for complete recovery (15, 43, 45, 61). Nutritional or pharmacological therapies to prevent muscle atrophy during immobilization would be ideal, but current approaches are often not effective enough to completely prevent muscle atrophy. Moreover, the development of new therapies is hindered by a lack of knowledge. Although immobilization-induced skeletal muscle atrophy is a common and serious problem in medicine and surgery, it is scarcely understood at the molecular level.
To better understand molecular mechanisms of immobilization-induced skeletal muscle atrophy, we recently investigated the role of activating transcription factor 4 (ATF4), an evolutionarily ancient basic leucine zipper transcription factor that mediates a wide variety of cellular stress responses (25, 46, 56). In skeletal muscle, muscle disuse increases ATF4 expression (49), and increased skeletal muscle ATF4 expression is sufficient to induce skeletal muscle fiber atrophy (18). Furthermore, when mice lack ATF4 expression in skeletal muscle fibers, they undergo less skeletal muscle atrophy during limb immobilization (17). Taken together, these findings indicate that ATF4 plays a key role in immobilization-induced muscle atrophy.
However, it is also clear that ATF4 is not the only mediator of immobilization-induced muscle atrophy. This conclusion is based on the finding that muscles lacking ATF4 are not completely resistant to immobilization-induced muscle atrophy (17). The atrophy that occurs in the absence of ATF4 indicates the existence of at least one other essential pro-atrophy factor, which work(s) in concert with ATF4 to promote muscle atrophy during immobilization.
In the current study, we sought to identify an ATF4-independent factor that promotes immobilization-induced skeletal muscle atrophy. Because ATF4 is a fundamental mediator of cellular stress responses (25, 46, 56), we reasoned that its counterpart might also be a fundamental mediator of cellular stress responses. From this perspective, the tumor suppressor p53 seemed an attractive candidate. Like ATF4, p53 is a stress-induced transcription factor that mediates cellular adaptations to stress (27, 39, 47). In addition, there is evidence that p53 promotes skeletal muscle atrophy. For example, transgenic mice that globally express an activated p53 construct age prematurely, and this is accompanied by severe muscle atrophy (51). Conversely, mice with a global loss of p53 expression are prone to cancer but resistant to cancer-induced skeletal muscle atrophy (52). Furthermore, diverse muscle atrophy stimuli (muscle unloading, muscle denervation, aging, and Huntington's Disease) increase expression of p53 and p53 target genes in skeletal muscle, suggesting that p53 may play an important role in muscle loss in these settings (19, 20, 57–59, 63, 64). Based on these considerations, we hypothesized that p53 might mediate the ATF4-independent pathway to skeletal muscle atrophy during limb immobilization.
MATERIALS AND METHODS
Mouse strains.
C57BL/6 mice were obtained from the National Cancer Institute. All transgenic and knockout mice were on a C57BL/6 background. p53f/f mice were obtained from Jackson Laboratories and are homozygous for a floxed p53 allele [exons 2–10 of the p53 gene are flanked by LoxP restriction sites (41)]. p53-muscle knockout (mKO) mice were generated by crossing p53f/f mice to transgenic mice expressing Cre recombinase under control of the muscle creatine kinase (MCK) promoter (8). In studies of p53-mKO mice, control mice were p53f/f littermates that lacked the MCK-Cre transgene. ATF4-mKO mice were described previously (17) and were generated by crossing mice homozygous for a floxed ATF4 allele (ATF4f/f) to MCK-Cre mice. In studies of ATF4-mKO mice, control mice were ATF4f/f littermates that lacked the MCK-Cre transgene. p53/ATF4 double-mKO mice were generated by crossing p53f/f and ATF4f/f mice to generate mice homozygous for floxed p53 and ATF4 alleles (p53f/fATF4f/f) and then crossing p53f/fATF4f/f mice to MCK-Cre mice. In studies of p53/ATF4 double-mKO mice, control mice were p53f/fATF4f/f littermates that lacked the MCK-Cre transgene.
Mouse protocols.
All animal procedures were approved by the Institutional Animal Care and Use Committee of the University of Iowa. All mice were 8- to 12-wk-old males. Mice were housed at 21°C in colony cages with 12:12-h light-dark cycles and provided ad libitum access to standard chow (Harlan-Teklad formula 7913) and water. Unilateral hindlimb immobilization was performed under isoflurane anesthesia using an Autosuture Royal 35W skinstapler (Tyco Healthcare). Briefly, the ankle joint and tibialis anterior muscle were immobilized by fixing the ventral side of the foot to the distal portion of the calf; the knee and hip joints remained mobile, and ambulation was impaired but not entirely prevented, as described previously (10, 17). Forelimb grip strength was determined using a grip strength meter equipped with a triangular pull bar (Columbus Instruments), as described previously (34). Transfection of mouse skeletal muscle with plasmid DNA was performed as described previously (18).
Histological analysis of mouse skeletal muscle.
Hematoxylin and eosin (H & E) stains and myosin ATPase stains were performed by embedding and freezing skeletal muscles in tissue freezing medium (Triangle Biomedical) and then preparing 10-μm sections from the midbelly of the muscle with a Microm HM 505E cryostat. For H & E stains, muscle sections were fixed in ice-cold zinc formalin for 15 min before staining with a DRS-601 automatic slide stainer (Sakura). Myosin ATPase stains were performed as described previously (7, 16). Briefly, muscle sections were incubated for 5 min in buffer A (50 mM sodium acetate and 30 mM barbital sodium, pH 4.3) to stain type I muscle fibers or incubated for 15 min in buffer B (20 mM barbital sodium and 18 mM CaCl2, pH 9.4) to stain type II muscle fibers. Sections were then incubated for 30 min in buffer C (20 mM barbital sodium, 9 mM CaCl2, and 2.7 mM ATP, pH 9.4), followed by three 3-min washes with 1% (wt/vol) CaCl2. Slides were then incubated for 3 min in 2% (wt/vol) CoCl2, followed by three 1-min washes in deionized water. Slides were then incubated for 20 s in 1% (vol/vol) (NH4)2S, followed by a 5-min wash in water. Slides were then dehydrated with ethanol, cleared with xylene, and mounted with solvent 100 (IMEB). H & E- and myosin ATPase-stained sections were imaged using an Olympus BX-61 automated upright microscope, and image analysis was performed with ImageJ. For visualization of green fluorescent protein (GFP) fluorescence, muscles were fixed in 4% paraformaldehyde (wt/vol) for 16 h, incubated in 30% sucrose for 24 h, embedded in tissue freezing medium, and then snap-frozen using a Stand-Alone Gentle Jane. A Microm HM 505E cryostat was then used to prepare 10-μm sections from the midbelly of the muscle. Sections were then washed three times with PBS and mounted with Vectashield (Vector Laboratories). Sections were imaged on an Olympus IX-71 microscope, and image analysis was performed with ImageJ. Transfected fibers were defined as fibers having a mean fluorescence of ≥25 arbitrary units above background, as described previously (18). For all muscle fiber measurements, the diameters of ≥200 muscle fibers per muscle were measured using the lesser diameter (minimal Feret diameter) method, as recommended elsewhere (16).
Plasmids.
p-wt-p53 encodes wild-type mouse p53 (NM_011640.3) under control of the cytomegalovirus (CMV) promoter. p-mut-p53 encodes mouse p53 with two point mutations (R270H and P275S) that disrupt DNA binding (13) under control of the CMV promoter. p-ATF4-FLAG was described previously (18) and encodes wild-type mouse ATF4 (NM_009716) with three copies of the FLAG epitope tag at the NH3 terminus, under control of the CMV promoter. p-eGFP encodes eGFP under control of the CMV promoter. p-p21-FLAG was generated by amplifying the coding region of mouse p21 (NM_007669) from mouse muscle cDNA and then cloning into p3XFLAG-CMV10 (Sigma) to place three copies of the FLAG epitope tag at the NH3 terminus. p-miR-control encodes both a nontargeting pre-miRNA and emerald green fluorescent protein (EmGFP) under control of the CMV promoter (17). p-MiR-p21 #1 and p-MiR-p21 #2 were generated by ligating Mmi506259 and Mmi506257 oligonucleotide duplexes (Invitrogen), respectively, into the pcDNA6.2GW/EmGFP miR plasmid (Invitrogen), which contains a CMV promoter driving cocistronic expression of engineered pre-miRNAs and EmGFP (Invitrogen).
Immunoblot analysis of mouse skeletal muscle.
Skeletal muscles were snap-frozen in liquid nitrogen and homogenized in 1 ml of ice-cold homogenization buffer [50 mM HEPES, 4 mM EGTA, 10 mM EDTA, 15 mM sodium pyrophosphate, 100 mM β-glycerophosphate, Complete Mini protease inhibitor mixture (Roche Applied Science), 25 mM sodium fluoride, 1% (vol/vol) Triton X-100, and 1:100 dilution of phosphatase inhibitor cocktails 2 and 3 (Sigma)] (6) using a Tissue Master 240 (Omni International) for 1 min on setting no. 10. The muscle homogenate was rotated for 1 h at 4°C and then centrifuged at 16,000 g for 20 min at 4°C. An aliquot of the supernatant was used to determine protein concentration by the BCA method (Pierce), and another aliquot was mixed with 0.25 volume of sample buffer [250 mM Tris·HCl, pH 6.8, 10% SDS, 25% glycerol, 0.2% (wt/vol) bromophenol blue, and 5% (wt/vol) 2-mercaptoethanol] and heated at 95°C for 5 min. An equal amount of protein from each sample was subjected to SDS-PAGE and then transferred to Hybond-C extra nitrocellulose filters (Millipore). Immunoblots were performed at 4°C for 16 h using a 1:1,000 dilution of monoclonal anti-mouse p53 (no. 2524; Cell Signaling Technologies), a 1:4,000 dilution of monoclonal anti-mouse FLAG (no. F1804; Sigma), or a 1:1,000 dilution of monoclonal anti-mouse p21 (SC-6246: F-5; Santa Cruz Biotechnology).
Quantitative real-time RT-qPCR.
Extraction of skeletal muscle RNA was performed using TRIzol solution (Invitrogen) and purified with Turbo DNA free kit (Ambion), as described previously (18). Quantitative real-time RT-PCR (qPCR) was performed as described previously (18) using a High Capacity cDNA reverse transcription kit (Applied Biosystems). qPCR studies were performed with a 7500 Fast Real-time PCR System (Applied Biosystems) using p53, ATF4, and p21 Taqman Gene Expression Assays (Applied Biosystems). All qPCR samples were run in triplicate and the cycle threshold (CT) values were averaged. For data analysis the ΔΔCT method was utilized, with 36B4 mRNA serving as the invariant control.
mRNA expression arrays.
Skeletal muscle RNA was extracted using TRIzol solution (Invitrogen) and then purified using the RNeasy kit and RNase Free DNase Set (Qiagen). RNA hybridization to Mouse Ref-8 version 2.0 BeadChip arrays (Illumina) was performed by the Southern California Genotyping Consortium (University of California, Los Angeles, CA). Briefly, purified RNA was quantified using a Ribogreen fluorescent assay and normalized to 10 ng/ul prior to amplification. RNA was then amplified and labeled (Ambion TotalPrep Kit), and cDNA was synthesized using robotic-assisted magnetic capture. Using the cDNA template, biotinylated cRNA was produced via an in vitro transcription reaction. Amplified and labeled cRNA was quantified (Ribogreen assay) and hybridized to Mouse Ref-8 version 2.0 BeadChip Arrays (Illumina) overnight at 58°C. Following hybridization, arrays were washed, blocked, stained, and dried (Little Dipper Processor). Arrays were scanned with an iScan reader, and data were extracted and analyzed with BeadStudio Software (Illumina).
Statistical analysis.
For comparisons between two groups, paired t-tests were used for within-subject samples, and unpaired t-tests were used for independent samples. Comparisons involving multiple groups were analyzed by one-way ANOVA with Sidak's post hoc test.
RESULTS
Limb immobilization increases skeletal muscle p53 expression and induces skeletal muscle atrophy.
Because the molecular mechanisms of immobilization-induced muscle atrophy are highly complex, we focused on a relatively short period of limb immobilization (3 days) to identify early events that initiate the atrophy process. Previously, we found that 3 days of limb immobilization induces skeletal muscle atrophy partly through induction of ATF4 (17). To begin to investigate the potential role of p53, we tested the hypothesis that 3 days of limb immobilization might increase skeletal muscle p53 expression. To test this, we immobilized one hindlimb in mice, as illustrated in Fig. 1A. In each mouse, the contralateral hindlimb remained mobile and served as an intrasubject control. After 3 days of unilateral hindlimb immobilization, we examined bilateral tibialis anterior (TA) muscles. We found that immobilization increased the level of p53 (Fig. 1B) and decreased the size of TA muscle fibers, indicating muscle fiber atrophy (Fig. 1, C and D). Furthermore, a time course study showed that p53 expression increased significantly within 1 day of immobilization and preceded muscle atrophy (Fig. 1E). Because p53 activity can also be increased by phosphorylation of serine 15 (23, 54, 55), we examined whether immobilization increases serine 15 phosphorylation but found that it did not (data not shown). These results identified p53 expression as an early effect of skeletal muscle immobilization and suggested that p53 might contribute to immobilization-induced skeletal muscle atrophy.
Fig. 1.

Limb immobilization increases skeletal muscle p53 expression and causes skeletal muscle fiber atrophy. A: schematic illustrating the hindlimb immobilization model. B–D: C57BL/6 mice were subjected to unilateral hindlimb immobilization for 3 days before bilateral tibialis anterior (TA) muscles were harvested for further analysis. B: an equal amount of protein from each muscle (100 μg) was subjected to SDS-PAGE and immunoblot analysis with anti-p53 polyclonal IgG. Membranes were stained with Ponceau S to confirm equal loading. C: representative hematoxylin and esoin (H & E) stains of muscle fibers. D: quantification of muscle fiber size. Left: mean fiber diameter. Each data point represents the mean diameter of ≥250 fibers from 1 muscle. Horizontal bars denote means ± SE. P value was determined with a paired t-test. Right: fiber size distributions; each distribution represents ≥1,100 fibers from 4 muscles. E: C57BL/6 mice were subjected to unilateral hindlimb immobilization for the indicated times before bilateral TA muscles were harvested for analysis of muscle weight (top) and p53 protein level (bottom). In each mouse, values from the immobile muscle were normalized to values from the mobile muscle. Data are means ± SE from 5–6 mice/time point. Some error bars are too small to see. At each time point, paired t-tests were used to compare values from mobile and immobile TAs. *P ≤ 0.05.
Increased skeletal muscle p53 expression induces skeletal muscle atrophy.
To test the hypothesis that p53 promotes skeletal muscle atrophy, we used an electroporation-based method to transfect mouse TA muscle with a plasmid encoding p53. This method transfects terminally differentiated muscle fibers but not satellite cells or connective tissue cells (50). In each mouse, the contralateral TA was transfected with empty plasmid and served as a negative control. Both TA muscles remained mobile throughout the experiment. As expected, transfection of p53 plasmid increased p53 protein (Fig. 2A). The increase in p53 protein (5.7 ± 1.9-fold, P ≤ 0.05) was similar to the increase in p53 protein that occurs with 3 days of hindlimb immobilization (5.0 ± 0.9-fold; Fig. 1E). Importantly, increased p53 expression induced muscle fiber atrophy (Fig. 2, B and C). To determine whether p53-mediated muscle fiber atrophy might require p53-mediated gene transcription, we tested a full-length, transcriptionally inactive p53 construct [p53(R270H/P275S); (13)]. Although p53(R270H/P275S) was highly expressed (Fig. 2D), it did not induce muscle fiber atrophy (Fig. 2, E and F). Collectively, these data indicate that increased expression of transcriptionally active p53 in muscle fibers is sufficient to induce atrophy.
Fig. 2.

Increased p53 expression causes skeletal muscle fiber atrophy. A–C: in C57BL/6 mice, 1 TA muscle was transfected with 20 μg of p-wt-p53 plus 2 μg of p-eGFP, and the contralateral TA (“control”) was transfected with 20 μg of empty plasmid (pcDNA3) plus 2 μg of p-eGFP (enhanced green fluorescent protein). eGFP served as a transfection marker and did not alter muscle fiber size (18). Bilateral TAs were harvested 7 days posttransfection for further analysis. A: an equal amount of protein from each muscle (100 μg) was subjected to SDS-PAGE and immunoblot analysis with anti-p53 polyclonal IgG. Membranes were stained with Ponceau S to confirm equal loading. B and C: histological analysis of muscles. Representative images (B) and quantification of muscle fiber size (C). C, left: fiber size distributions; each distribution represents ≥1,600 fibers from 4 muscles. C, right: mean fiber diameters; each data point represents the mean diameter of ≥400 fibers from 1 muscle. Horizontal bars denote means ± SE. P value was determined with a paired t-test. D–F: in C57BL/6 mice, 1 TA muscle was transfected with 20 μg of p-mut-p53 plus 2 μg p-eGFP, and the the contralateral TA (control) was transfected with 20 μg of empty plasmid (pcDNA3) plus 2 μg p-eGFP. Bilateral TAs were harvested 7 days posttransfection for further analysis. D: an equal amount of protein from each muscle (50 μg) was subjected to SDS-PAGE and immunoblot analysis with anti-p53 polyclonal IgG. Membranes were stained with Ponceau S to confirm equal loading. E and F: histological analysis of muscles. Representative images (E) and quantification of muscle fiber size (F). F, left: fiber size distributions; each distribution represents ≥2,300 fibers from 6 muscles. F, right: mean fiber diameters; each data point represents the mean diameter of ≥450 fibers from 1 muscle. Horizontal bars denote means ± SE. P value was determined with a paired t-test.
p53 is partially required for skeletal muscle atrophy during limb immobilization.
To test the hypothesis that p53 is required for muscle atrophy during limb immobilization, we generated and studied mice lacking p53 expression in differentiated skeletal muscle fibers (p53-mKO mice). We generated p53-mKO mice by crossing mice homozygous for a floxed p53 allele (p53f/f mice) (41) to transgenic MCK-Cre mice, which express Cre recombinase in skeletal muscle fibers and heart but not satellite cells (8, 12). As expected, the MCK-Cre transgene excised the floxed p53 allele in skeletal muscle and heart (Fig. 3A) and eliminated skeletal muscle p53 expression (Fig. 3B).
Fig. 3.

p53 is partially required for immobilization-induced muscle atrophy. A–E: p53-muscle knockout (mKO) mice are homozygous for a floxed p53 allele (p53f/f) and possess the MCK-Cre transgene, which directs Cre recombinase expression to skeletal muscle fibers and heart. Control mice were littermates of p53-mKO mice that lacked the MCK-Cre transgene. A: PCR confirmation that MCK-Cre directs excision of the floxed p53 allele (p53f) in striated muscle of p53-mKO mice. Gastroc, gastrocnemius; Quad, quadriceps. B: control and p53-mKO mice were subjected to unilateral hindlimb immobilization for 3 days before bilateral TA muscles were harvested. An equal amount of protein from each muscle (100 μg) was subjected to SDS-PAGE and immunoblot analysis with anti-p53 polyclonal IgG. Membranes were stained with Ponceau S to confirm equal loading. C: baseline analysis of control and p53-mKO mice. Data are means ± SE from 8 mice/genotype. Muscle weights are combined weight of bilateral muscles. Fat pad weights are combined weights of bilateral epididymal, retroperitoneal, and scapular fat pads. P values were determined with unpaired t-tests. D and E: control and p53-mKO mice were subjected to unilateral hindlimb immobilization for 3 days before bilateral TA muscles were harvested for histological analysis. Representative H & E images (D) and quantification of TA muscle fiber size (E). Each data point represents the mean diameter of ≥250 fibers from 1 muscle. Horizontal bars denote means ± SE. Statistical analysis used the 1-way ANOVA with Sidak's post hoc test; different letters are statistically different (P ≤ 0.05).
p53-mKO mice were born at the expected Mendelian frequency and lacked any overt phenotype up to 15 mo of age, the longest period of observation. Careful comparisons of p53-mKO mice and littermate control mice revealed no baseline differences in total body weight, skeletal muscle weight, muscle histology, grip strength, heart weight, liver weight, kidney weight, or fat pad weight (Fig. 3, C and D). Thus, p53 expression in fully differentiated (post-mitotic) muscle fibers is not required for skeletal muscle development or the maintenance of postnatal skeletal muscle mass during early and middle adulthood. Furthermore, the absence of p53 expression in muscle fibers does not induce muscle hypertrophy.
To test the hypothesis that p53 is necessary for immobilization-induced muscle atrophy, we subjected p53-mKO mice and littermate control mice to 3 days of unilateral hindlimb immobilization. We found that immobilization reduced muscle fiber diameter significantly in both littermate control mice and p53-mKO mice (Fig. 3, D and E). However, p53-mKO muscle fibers underwent significantly less atrophy than control muscle fibers (Fig. 3, D and E). These results indicate that p53 is partially required for immobilization-induced skeletal muscle atrophy.
p53 and ATF4 induce muscle atrophy by independent mechanisms.
In skeletal muscle, p53 appeared to resemble ATF4 in three important ways. First, p53 expression was increased by muscle disuse (Fig. 1) similarly to ATF4 expression (49). Second, p53 was sufficient to induce skeletal muscle fiber atrophy (Fig. 2) similarly to ATF4 (18). Third, p53-mKO muscles appeared normal under basal conditions but were partially resistant to immobilization-muscle atrophy (Fig. 3), much like muscles that lack ATF4 (17). These similarities suggested that p53 and ATF4 might be key components of the same molecular pathway to muscle atrophy.
To test this possibility, we performed complementation studies. We first tested whether ATF4 might be an essential downstream mediator of p53. To test this, we overexpressed p53 in muscles of ATF4-mKO mice, which lack skeletal muscle ATF4 expression secondary to MCK-Cre-mediated excision of a homozygous floxed ATF4 allele (17). Importantly, under basal conditions, ATF4-mKO mice possess normal muscle weight, muscle histology, and strength (17). In ATF4-mKO muscle, transfection of p53 plasmid increased p53 protein (Fig. 4A) and caused muscle fiber atrophy (Fig. 4, B and C), indicating that ATF4 is not required for p53-mediated muscle atrophy.
Fig. 4.

p53 and activating transcription factor 4 (ATF4) induce muscle fiber atrophy by independent mechanisms. A–C: the experiments utilized ATF4-mKO mice, which lack ATF4 expression in skeletal muscle fibers (17). In each mouse, 1 TA muscle was transfected with 20 μg p-wt-p53 plus 2 μg p-eGFP, and the the contralateral TA (control) was transfected with 20 μg empty plasmid (pcDNA3) plus 2 μg p-eGFP. Bilateral TAs were harvested 10 days posttransfection for further analysis. A: an equal amount of protein from each muscle (100 μg) was subjected to SDS-PAGE and immunoblot analysis with anti-p53 polyclonal IgG. Membranes were stained with Ponceau S to confirm equal loading. B and C: representative images (C) and quantification of muscle fiber size (D). C, left: fiber size distributions; each distribution represents ≥800 fibers from 4 muscles. C, right, mean fiber diameters; each data point represents the mean diameter of ≥200 fibers from 1 muscle. Horizontal bars denote means ± SE. D–F: the experiments utilized p53-mKO mice. In each mouse, 1 TA muscle was transfected with 20 μg of p-ATF4-FLAG plus 2 μg of p-eGFP, and the the contralateral TA (control) was transfected with 20 μg of empty plasmid (pcDNA3) plus 2 μg of p-eGFP. Bilateral TAs were harvested 10 days posttransfection for further analysis. D: an equal amount of protein from each muscle (40 μg) was subjected to SDS-PAGE and immunoblot analysis with anti-FLAG monoclonal IgG. Membranes were stained with Ponceau S to confirm equal loading. Representative images (E) and quantification of muscle fiber size (F). F, left: fiber size distributions; each distribution represents ≥1,200 fibers from 5 muscles. F, right: mean fiber diameters; each data point represents the mean diameter of ≥200 fibers from 1 muscle. Horizontal bars denote means ± SE. In C and F, P values were determined with paired t-tests.
We next overexpressed ATF4 in p53-mKO muscles to determine whether p53 might be an essential downstream mediator of ATF4. The increase in ATF4 mRNA (1.3 ± 0.1-fold, P ≤ 0.05) was similar to the increase in ATF4 mRNA that occurred when wild-type mice were subjected to 3 days of hindlimb immobilization (1.4 ± 0.2-fold, P ≤ 0.05). Moreover, in p53-mKO muscle, transfection of ATF4 plasmid increased ATF4 protein (Fig. 4D) and caused muscle fiber atrophy (Fig. 4, E and F). These data indicate that p53 is not required for ATF4-mediated muscle atrophy. Thus, p53 and ATF4 induce muscle fiber atrophy by independent mechanisms.
p53 and ATF4 induce muscle atrophy by additive mechanisms.
The functional independence of p53 and ATF4 suggested that p53 and ATF4 might have additive effects on muscle fiber size. As a first test of this hypothesis, we compared the effects of p53 expression, ATF4 expression, and coexpression of p53 and ATF4. Individually, p53 and ATF4 reduced muscle fiber diameter by similar amounts (Fig. 5, A and B). However, the combination of p53 and ATF4 generated greater muscle fiber atrophy than either transcription factor alone, and the effect was additive (Fig. 5, A and B).
Fig. 5.
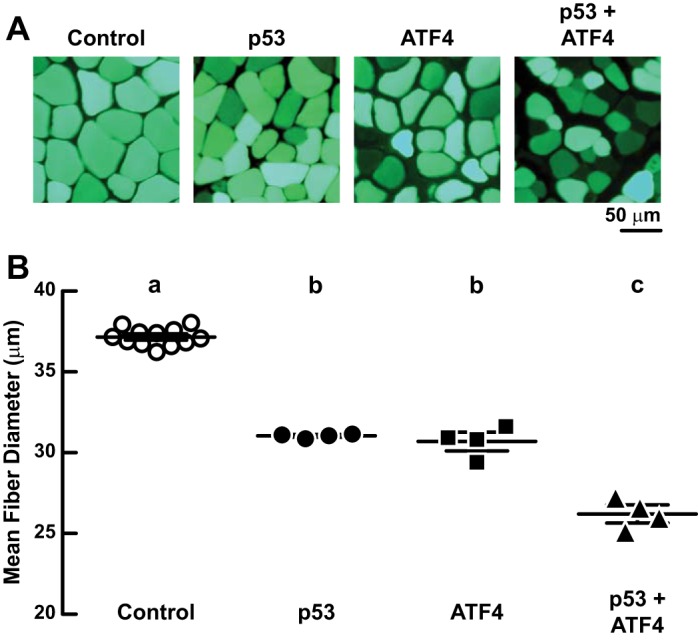
Coexpression of p53 and ATF4 induces more muscle fiber atrophy than either transcription factor alone. A and B: TA muscles of C57BL/6 mice were transfected with 2 μg of p-eGFP plus either 20 μg of pcDNA3 (control), 10 μg of p-wt-p53 + 10 μg of pcDNA3 (p53), 10 μg of p-ATF4-FLAG + 10 μg of pcDNA3 (ATF4), or 10 μg of p-wt-p53 + 10 μg p-ATF4-FLAG (p53 + ATF4). Muscles were harvested 7 days posttransfection. A: representative images. B: mean fiber diameters; each data point represents the mean diameter of ≥200 fibers from 1 muscle. Horizontal bars denote means ± SE. Statistical analysis used 1-way ANOVA with Sidak's post hoc test; different letters are statistically different (P ≤ 0.05).
As a second test of the hypothesis that p53 and ATF4 have additive effects on muscle fiber size, we compared p53-mKO mice and ATF4-mKO mice to double-knockout mice that lack both p53 and ATF4 in skeletal muscle (p53/ATF4-mKO mice). Relative to immobilized control muscles, immobilized p53-mKO muscles contained reduced p53 mRNA and a normal level of ATF4 mRNA, immobilized ATF4-mKO muscles contained reduced ATF4 mRNA and a normal level of p53 mRNA, and immobilized p53/ATF4-mKO muscles contained reduced levels of both ATF4 and p53 mRNAs (Fig. 6A). Residual p53 mRNA in p53-mKO and p53/ATF4-mKO muscles is likely from satellite cells and nonmuscle cells, which do not express MCK-Cre (12). Similar to the single-knockout mice (p53-mKO and ATF4-mKO), double-knockout mice (p53/ATF4-mKO) were born at the expected Mendelian frequency, appeared healthy, and were grossly indistinguishable from their wild-type littermates up to 15 mo of age, the longest period of observation. Furthermore, p53/ATF4-mKO mice lacked detectable baseline changes in body weight, muscle weight, muscle histology, grip strength, and heart, liver, and fat pad weight (Fig. 6, B and C).
Fig. 6.

Combined loss of p53 and ATF4 prevents immobilization-induced muscle fiber atrophy. p53/ATF4-mKO mice are homozygous for a floxed p53 allele (p53f/f) and a floxed ATF4 allele (ATF4f/f) and possess the MCK-Cre transgene. Control mice for p53/ATF4-mKO were littermates of p53/ATF4-mKO mice that lacked the MCK-Cre transgene. Control mice for p53-mKO were littermates of p53-mKO mice that lacked the MCK-Cre transgene. Control mice for ATF4-mKO were littermates of ATF4-mKO mice that lacked the MCK-Cre transgene. A: mice from the indicated genotypes were subjected to 3 days of hindlimb immobilization, and then immobilized TA muscles were subjected to quantitative PCR (qPCR) analysis of p53 and ATF4 mRNA levels. Data are means ± SE from ≥6 mice/genotype. P values were determined with unpaired t-tests. *P ≤ 0.05. NS, P ≥ 0.05 (not significant). B: baseline analysis of p53/ATF4-mKO and littermate control mice. Data are means ± SE from 8 mice/genotype. P values were determined with unpaired t-tests. C: representative H & E images from TA muscles of p53/ATF4-mKO and littermate control mice under basal conditions. D and E: bilateral TA muscles were collected from the indicated genotypes before and after 3 days of unilateral hindlimb immobilization. In each mouse, values from the immobile muscle were normalized to values from the mobile muscle. D: muscle fiber size. Data are means ± SE from ≥4 mice/time point (≥250 fibers/muscle measured). Some error bars are too small to see. E: muscle weights. Data are means ± SE from ≥10 mice/time point. Some error bars are too small to see. D and E: at each time point, P values were determined by comparing values from knockout mice to values from their corresponding littermate control mice with an unpaired t-test (*P ≤ 0.05).
To determine whether p53 and ATF4 have additive effects on muscle fiber size during immobilization, we subjected the single- and double-knockout mice to 3 days of unilateral hindlimb immobilization. Consistent with previous results, p53-mKO muscles and ATF4-mKO muscles were partially resistant to immobilization-induced muscle fiber atrophy (Fig. 6D) and immobilization-induced muscle loss (Fig. 6E). Moreover, in the double-knockout mice (p53/ATF4-mKO) mice, there was an additive reduction in immobilization-induced muscle fiber atrophy (Fig. 6D) and immobilization-induced muscle loss (Fig. 6E). Further examination of the muscle fibers revealed that immobilization induced atrophy in type II fibers but not type I fibers (Fig. 7, A–C). In addition, loss of either p53 or ATF4 partially protected type II fibers from immobilization-induced atrophy, and the combined loss of p53 and ATF4 provided complete protection of type II fibers from immobilization-induced atrophy (Fig. 7, A–C). Taken together, these results indicate that the combined actions of p53 and ATF4 are required for type II muscle fiber atrophy during immobilization.
Fig. 7.

Immobilization induces atrophy of type II muscle fibers via the combined actions of p53 and ATF4. A–C: mice from the indicated genotypes were subjected to 3 days of unilateral hindlimb immobilization, and then bilateral TA muscles were sectioned and stained for myosin ATPase activity to distinguish type I and type II muscle fibers. Data are means ± SE from ≥4 mice/genotype (≥250 fibers/muscle analyzed). P values were determined with an unpaired t-test.
Identification of p21 as a skeletal muscle mRNA that is highly induced by immobilization via the combined actions of p53 and ATF4.
Since p53 and ATF4 are transcription factors, we reasoned that they promote muscle atrophy by altering skeletal muscle gene expression. In previous studies, we used genome-wide mRNA expression arrays to determine the effects of ATF4 on muscle mRNA expression (17, 18). To determine the effects of p53 on muscle mRNA expression, we used mRNA expression arrays that quantitated levels of 17,192 mRNAs. We began by searching for TA muscle mRNAs that were strongly upregulated (≥2-fold) by 3 days of hindlimb immobilization in C57BL/6 mice. We identified 33 mRNAs (represented by 37 probes) that met these criteria (Fig. 8). We then performed additional mRNA expression arrays to determine which of these 33 mRNAs were also 1) decreased in immobilized p53-mKO TA muscle relative to immobilized control TA muscle and 2) increased by p53 overexpression in mobile C57BL/6 TA muscle relative to mobile C57BL/6 TA muscle that was transfected with a control plasmid.
Fig. 8.

Skeletal muscle mRNA transcripts that are ≥2-fold induced by immobilization and the effects of p53 overexpression and p53 gene deletion on those transcripts. C57BL/6 mice were subjected to 3 days of unilateral hindlimb immobilization, and then mRNA levels in bilateral TA muscles were analyzed with Mouse Ref-8 version 2.0 BeadChip arrays. In each mouse, mRNA levels in the immobilized TA were normalized to mRNA levels in the contralateral (mobile) TA, and P values were determined with paired t-tests (n = 4 arrays/condition). Statistical significance was arbitrarily defined as P ≤ 0.05. All mRNAs that were increased ≥2-fold by hindlimb immobilization (33 mRNAs represented by 37 probes) are shown. To determine the effects of p53 gene deletion on these mRNAs, p53-mKO mice and littermate control mice were subjected to 3 days of hindlimb immobilization, and then immobilized TA muscles were harvested and analyzed with Mouse Ref-8 version 2.0 BeadChip arrays. mRNA levels in immobilized p53-mKO muscles were normalized to mRNA levels in immobilized control muscles, and P values were determined with unpaired t-tests (n = 3 arrays/condition). To determine the effects of p53 overexpression on these mRNAs, 1 TA muscle in C57BL/6 mice was transfected with 20 μg of p-wt-p53, and the contralateral TA was transfected with 20 μg of empty plasmid (pcDNA3). Three days later, bilateral TAs were harvested and analyzed with Mouse Ref-8 version 2.0 BeadChip arrays. mRNA levels in muscles transfected with p53 plasmid were normalized to mRNA levels in muscles transfected with control plasmid, and P values were determined with paired t-tests (n = 4 arrays/condition). Shading indicates mRNAs that were ≥2-fold increased by immobilization, reduced by loss of p53, and increased by p53 overexpression.
As expected, immobilization strongly induced mRNAs encoding several known mediators of muscle atrophy, including growth arrest and DNA damage-inducible 45α (Gadd45a), histone deacetylase 4, muscle RING finger 1, and muscle atrophy F-box/atrogin-1 (Fig. 8). However, none of these mRNAs were decreased by loss of p53, and none were increased by p53 overexpression (Fig. 8). In contrast, two skeletal muscle mRNAs were highly induced by hindlimb immobilization and also decreased by loss of p53 in immobilized muscle and increased by p53 overexpression. These two mRNAs encode p21 [also known as Waf1, Cip1, and cyclin-dependent kinase inhibitor 1a (Cdkn1a)] and the α1-subunit of the nicotinic acetylcholine receptor (Fig. 8). Interestingly, p21 is a well-established p53 target gene (14, 21), and p21 mRNA is highly induced during muscle atrophy (3, 5, 18, 19, 24, 29, 35, 37, 59, 63, 64). In addition, p21 mRNA is regulated by ATF4, which is sufficient to increase p21 mRNA and p21 protein in mouse TA muscle (18). Based on these considerations, we chose to investigate p21 as a potential downstream mediator of p53 and ATF4 in immobilized muscle.
Using qPCR, we confirmed that hindlimb immobilization increased p21 mRNA (Fig. 9A). As expected, this increase in p21 mRNA was accompanied by an increase in p21 protein (Fig. 9B). Likewise, p53 overexpression in nonimmobilized muscle increased p21 mRNA (Fig. 9C) and p21 protein (Fig. 9D), similar to the effects of ATF4 overexpression in nonimmobilized muscle (17). qPCR analysis of p53-mKO muscle also confirmed that p53 was partially required for the induction of p21 mRNA during immobilization (Fig. 9E).
Fig. 9.

Immobilization increases skeletal muscle p21 mRNA in a manner that is dependent on both p53 and ATF4. A and B: C57BL/6 were subjected to 3 days of unilateral hindlimb immobilization, and then bilateral TA muscles were harvested for further analysis. Data are means ± SE from 4 mice. P values were determined with paired t-tests. A: qPCR analysis of p21 mRNA levels. B: an equal amount of protein (100 μg) from each muscle was subjected to immunoblot analysis with anti-p21 monoclonal IgG. Membranes were stained with Ponceau S to confirm equal loading. B, left: representative immunoblots. B, right: quantification. C and D: in C57BL/6 mice, 1 TA muscle was transfected with 20 μg of p-wt-p53, and the the contralateral TA (control) was transfected with 20 μg of empty plasmid (pcDNA3). Three days later, bilateral TAs were harvested for further analysis. Data are means ± SE from 4 mice. P values were determined with paired t-tests. C: qPCR analysis of p21 mRNA levels. D: an equal amount of protein (100 μg) from each muscle was subjected to immunoblot analysis with anti-p21 monoclonal IgG. Membranes were stained with Ponceau S to confirm equal loading. D, left: representative immunoblots. D, right: quantification. E: mice with the indicated genotypes were subjected to 3 days of unilateral hindlimb immobilization, and then qPCR was used to quantitate p21 mRNA levels in bilateral TA muscles. Data are means ± SE from ≥10 mice/genotype. For each knockout line and its corresponding littermate control line, p21 mRNA levels were normalized to the level in the control line, and P values were determined with unpaired t-tests. *P ≤ 0.05.
Importantly, qPCR analysis of ATF4-mKO muscle showed that ATF4, like p53, was partially required for the induction of p21 mRNA during immobilization (Fig. 9E). Furthermore, the combined loss of p53 and ATF4 in p53/ATF4-mKO muscle decreased p21 mRNA more than loss of either transcription factor alone, and the effect was nearly additive (Fig. 9E). Collectively, these results indicate that immobilization increases p21 mRNA through the combined actions of p53 and ATF4. This suggested the hypothesis that p53 and ATF4 might promote muscle atrophy by increasing p21 expression.
Increased skeletal muscle p21 expression induces skeletal muscle atrophy.
To test the hypothesis that p21 promotes muscle atrophy, we transfected TA muscles of C57BL/6 mice with a plasmid encoding p21. The contralateral TA in each mouse was transfected with empty plasmid, and both TA muscles remained mobile throughout the experiment. We found that transfection of p21 plasmid increased p21 protein (Fig. 10A) and induced muscle fiber atrophy (Fig. 10, B and C). Furthermore, and consistent with the finding that p21 lies downstream of p53 and ATF4, p21 induced muscle fiber atrophy in p53/ATF4-mKO muscles (Fig. 10, D and E). Thus, p21 induces muscle fiber atrophy in a manner that does not require immobilization, p53, or ATF4.
Fig. 10.

p21 induces muscle fiber atrophy in a manner that does not require immobilization, p53, or ATF4. A and C: in C57BL/6 mice, 1 TA muscle was transfected with 15 μg p-p21-FLAG plus 2 μg of p-eGFP, and the the contralateral TA (control) was transfected with 15 μg of empty plasmid (pcDNA3) plus 2 μg of p-eGFP. Bilateral TAs were harvested 7 days later for further analysis. A: an equal amount of protein from each muscle (40 μg) was subjected to immunoblot analysis with anti-FLAG monoclonal IgG. Membranes were stained with Ponceau S to confirm equal loading. B and C: histological analysis. Representative images (B) and quantification of muscle fiber size (C). C, left: fiber size distributions; each distribution represents ≥2,500 fibers from 5 muscles. C, right: mean fiber diameters; each data point represents the mean diameter of ≥400 fibers from 1 muscle. Horizontal bars denote means ± SE. D and E: TA muscles of p53/ATF4-mKO mice were transfected and harvested as in A–C. D: representative images. E: quantification of muscle fiber size. E, left: fiber size distributions; each distribution represents ≥1,200 fibers from 4 muscles. E, right: mean fiber diameters; each data point represents the mean diameter of ≥250 fibers from 1 muscle. Horizontal bars denote means ± SE. C and E: P values were determined with a paired t-test.
p21 is required muscle fiber atrophy induced by immobilization, p53, and ATF4.
To determine whether increased p21 expression is required for immobilization-induced muscle atrophy, we generated two artificial microRNA constructs (miR-p21 #1 and miR-p21 #2) that target distinct regions of the p21 mRNA and specifically reduce p21 protein (Fig. 11A). We then transfected the TA muscles of C57BL/6 mice with plasmids encoding either miR-p21 #1, miR-p21 #2, or a nontargeting control miRNA (miR-Control). Following transfection, we immobilized one TA in each mouse for 3 days before comparing muscle fibers from bilateral TAs. Neither miR-p21 construct altered fiber size in mobile muscles (Fig. 11, B and C), consistent with the finding that p21 mRNA is low under basal conditions. However, both miR-p21 constructs reduced muscle fiber atrophy in immobilized muscles (Fig. 11, B and C), indicating that p21 is required for immobilization-induced muscle atrophy.
Fig. 11.

p21 is required for immobilization-induced muscle fiber atrophy. A: TA muscles in C57BL/6 mice were transfected with 10 μg of p-p21-FLAG plus either 20 μg of p-miR-Control, 20 μg of p-MiR-p21 #1, or 20 μg of p-MiR-p21 #2 and then harvested 3 days later for immunoblot analysis with anti-FLAG monoclonal IgG (40 μg protein loaded/sample). Membranes were stained with Ponceau S to confirm equal loading. B and C: On day 0, bilateral TA muscles in C57BL/6 mice were transfected with 20 μg of p-miR-Control, 20 μg of p-MiR-p21 #1, or 20 μg of p-MiR-p21 #2. On day 3, mice were subjected to unilateral hindlimb immobilization. On day 6, bilateral TA muscles were harvested for histological analysis. Representative images (B) and quantification of muscle fiber size (C). Each data point represents the mean diameter of ≥250 fibers from 1 muscle. Horizontal bars denote means ± SE. Statistical analysis used the 1-way ANOVA with Sidak's post hoc test; different letters are statistically different (P ≤ 0.05).
To test the hypothesis that p21 is a critical downstream mediator of p53 and ATF4, we cotransfected mouse TA muscle with plasmids encoding p53 or ATF4 plus plasmids encoding miR-Control, miR-p21 #1, or miR-p21 #2. Both miR-p21 constructs significantly decreased muscle fiber atrophy caused by p53 (Fig. 12, A–D) and ATF4 (Fig. 12, E–H), indicating that p21 is an essential downstream mediator of both p53 and ATF4.
Fig. 12.

p21 is required for p53- and ATF4-mediated muscle fiber atrophy. A–D: In C57BL/6 mice, 1 TA muscle was transfected with 10 μg of p-wt-p53 plus either 20 μg of p-MiR-p21 #1 or 20 μg of p-MiR-p21 #2, as indicated; the contralateral TA (control) was transfected with 10 μg of p-wt-p53 plus 20 μg of p-miR-Control. Bilateral TAs were harvested 7 days later for histological analysis. A and C: representative images. B and D: quantification of muscle fiber size. D, left: fiber size distributions; each distribution represents ≥1,500 fibers from 6 muscles. D, right: mean fiber diameters; each data point represents the mean diameter of ≥250 fibers from 1 muscle. Horizontal bars denote means ± SE. E–H: in C57BL/6 mice, 1 TA muscle was transfected with 10 μg of p-ATF4-FLAG plus either 20 μg of p-MiR-p21 #1 or 20 μg of p-MiR-p21 #2, as indicated; the contralateral TA (control) was transfected with 10 μg of p-ATF4-FLAG plus 20 μg of p-miR-Control. Bilateral TAs were harvested 7 days later for histological analysis. E and G: representative images. F and H: quantification of muscle fiber size. F, left: fiber size distributions; each distribution represents ≥1,600 fibers from 6 muscles. F, right: mean fiber diameters; each data point represents the mean diameter of ≥250 fibers from 1 muscle. Horizontal bars denote means ± SE. B, D, F, and H: P values were determined with a paired t-test.
DISCUSSION
Immobilization-induced skeletal muscle atrophy is a common and serious condition, but its molecular mechanisms are not well understood. Previous work demonstrated that ATF4 contributes to immobilization-induced muscle atrophy (17, 18). However, it was also clear that ATF4 is not the only factor involved, inasmuch as ATF4-deficient muscles are only partly resistant to immobilization-induced atrophy (Ref. 17 and Fig. 6, D and E). Thus, in the current study, we sought to identify an ATF4-independent factor that promotes skeletal muscle atrophy during immobilization.
Our results identify p53 as a key ATF4-independent mediator of immobilization-induced muscle atrophy. This conclusion is supported by our findings that 1) immobilization increases p53 expression; 2) p53 induces muscle fiber atrophy, even in the absence of ATF4; 3) combined expression of p53 and ATF4 induces more atrophy than either transcription factor alone; 4) loss of p53 expression in muscle fibers provides partial protection against immobilization-induced muscle atrophy; and 5) when coupled with loss of ATF4, loss of p53 provides nearly complete protection against immobilization-induced muscle atrophy. These results, in conjunction with previous work, indicate that immobilization increases expression of both p53 and ATF4, which mediate independent and additive pathways to skeletal muscle atrophy.
The independent and additive nature of the p53 and ATF4 pathways allows for combinatorial control of at least one downstream effector, p21. Using an unbiased approach, we found that immobilization strongly induces p21 mRNA in a manner that is dependent upon both p53 and ATF4. In addition, we found that p53, like ATF4 (18), is sufficient to increase p21 mRNA and p21 protein in skeletal muscle. Furthermore, our data demonstrate that p21 is required for muscle fiber atrophy induced by immobilization, p53, and ATF4, and p21 is sufficient to induce muscle fiber atrophy in the absence of immobilization, p53, and ATF4. Thus, p53 and ATF4 jointly induce p21 expression during immobilization, leading to muscle atrophy.
Interestingly, loss of p53 and/or ATF4 expression in muscle fibers appears to have little if any effect on muscle development or the maintenance of muscle mass during early to middle adulthood. Similarly, RNAi-mediated knockdown of p21 expression does not alter muscle fiber size under basal conditions. These findings are consistent with the observation that p53, ATF4, and p21 are expressed at low levels under basal conditions, and their induction requires cellular stress. Thus, in the absence of a stress such as muscle immobilization, no phenotype is evident.
The way in which immobilization increases p53 remains to be determined. Our results suggest that immobilization increases p53 synthesis and/or decreases p53 turnover in muscle fibers. In other cell types, p53 synthesis can be augmented by several mechanisms that activate the p53 gene (28, 36, 48), stabilize p53 mRNA (40, 62, 68), and/or enhance translation of p53 mRNA (42, 60, 65, 67). In addition, p53 turnover can be reduced by several mechanisms that decrease expression or activity of Mdm2 and related E3 ubiquitin ligases (33, 44, 53). We speculate that muscle immobilization stimulates one or more of these mechanisms in muscle fibers, leading to increased p53 expression.
The mechanisms by which p53 and ATF4 increase p21 mRNA also require further investigation. It seems likely that p53 directly activates the p21 gene, given that p53 binds and activates the p21 promoter in other cell types (21, 22, 26, 38). However, ATF4 is not known to directly regulate the p21 gene. Thus, it remains unknown whether ATF4 increases p21 expression by a direct or indirect mechanism. It is also important to note that the combined loss of p53 or ATF4 did not completely eliminate p21 mRNA in immobilized muscle. This may reflect the existence of other factors that contribute to p21 expression in immobilized skeletal muscle fibers. Alternatively, the residual p21 mRNA in immobilized p53/ATF4-mKO muscles may have arisen from satellite cells and nonmuscle cells, which do not express MCK-Cre and thus maintain p53 and ATF4 expression. Additional studies are needed to resolve this issue.
Understanding how p21 causes muscle atrophy is another important area for future study. Although p21 is a well-known cell cycle inhibitor (1), it seems unlikely that p21 promotes muscle fiber atrophy by inhibiting the cell cycle. During muscle atrophy, p21 specifically increases in the nuclei of skeletal muscle fibers (which are post-mitotic) but not in satellite cells (which have mitotic potential) (30). Furthermore, the interventions we used in this study specifically targeted skeletal muscle fibers. Thus, it seems probable that p21 promotes muscle atrophy via cell cycle-independent mechanisms in skeletal muscle fibers. We speculate that these mechanisms may lead to cellular changes that are known to promote muscle atrophy, including reduced anabolic signaling, increased proteolysis, decreased protein synthesis, and impaired mitochondrial function. We also speculate that p21 may play an essential role in other types of skeletal muscle atrophy, since p21 mRNA is one of the most highly induced skeletal muscle mRNAs during aging (19, 29, 63, 64), muscle denervation (5, 35), fasting (18), hindlimb unloading (59), amyotrophic lateral sclerosis (24), and critical illness (3, 37).
Although p21 is a key downstream mediator of p53 and ATF4, it is also clear that p53 and ATF4 regulate many genes and promote muscle atrophy by additional mechanisms. For example, ATF4 also promotes muscle atrophy by activating the Gadd45a gene, and Gadd45a is sufficient to induce muscle fiber atrophy and partially required for muscle fiber atrophy during limb immobilization (17). In the current study, we found that Gadd45a mRNA was the most highly induced mRNA in immobilized skeletal muscle, presumably because of the actions of ATF4. However, we also found that p53 is neither sufficient to increase Gadd45a mRNA nor required for immobilization-induced Gadd45a expression, a somewhat surprising result since p53 directly activates the Gadd45a gene in many other cell types (11, 31, 66). In the setting of Huntington's disease, p53 increases skeletal muscle expression of caspase-6, which is thought to contribute to muscle atrophy (20). Furthermore, in other cell types, p53 induces genes that could potentially play a role in skeletal muscle atrophy, such as the genes encoding sestrin 1 and sestrin 2 (9). Thus, in addition to p21, other genes contribute to the pro-atrophy effects of p53 and ATF4.
In the current study, we focused on a relatively short period of immobilization (3 days) to identify key triggers of the atrophy process. However, it will also be important to investigate the relative contributions of p53, ATF4, and p21 to muscle atrophy during longer periods of muscle immobilization. In a previous study, we found that ATF4-mKO mice undergo a normal amount of muscle atrophy with a longer period of immobilization (7 days) (17), presumably because of compensatory mechanisms that are not yet known. The roles of p53 and p21 during longer periods of immobilization are also not yet known, although a previous study in quail muscle showed that p53 expression is induced after 7 days of immobilization and returns to baseline levels after 14 days of immobilization (57).
Because the current study focused entirely on the TA muscle as a model system, it will also be interesting to explore the relative contributions of p53 and ATF4 to immobilization-induced atrophy in other muscle types. There may be differences, as suggested by our finding that p53 and ATF4 promote atrophy of type II but not type I fibers and the previous finding that immobilization does not increase p53 and ATF4 in soleus muscle, which is composed primarily of type I fibers (32).
In summary, the current study helps explain how immobilization-induced muscle atrophy occurs, and it opens several new avenues of investigation. In addition, the current study has potential implications for patients with immobilization-induced muscle atrophy due to injury or illness; optimal prevention and treatment of this condition may require interventions that effectively inhibit the p53 and ATF4 pathways.
GRANTS
This work was made possible by grants from the National Institutes of Health (Grants AR-059115-04, F30-AG-04330401, F30-AG-04496401, F31-AG-04603801, and HL-07638-27), the Department of Veterans Affairs Biomedical Laboratory Research & Development Service (Grant no. IBX000976A), and the Fraternal Order of Eagles Diabetes Research Center at the University of Iowa.
DISCLOSURES
The University of Iowa Research Foundation has filed a patent application related to this research. Inventors on that application include C. M. Adams and S. M. Ebert. C. M. Adams and S. M. Ebert hold equity in Emmyon, C. M. Adams is a founder and officer of Emmyon, and S. M. Ebert is an employee of Emmyon.
AUTHOR CONTRIBUTIONS
D.K.F., S.M.E., and C.M.A. conception and design of research; D.K.F., S.M.E., K.S.B., M.C.D., S.A.B., J.M.D., and S.D.K. performed experiments; D.K.F., S.M.E., K.S.B., M.C.D., S.A.B., J.M.D., S.D.K., and C.M.A. analyzed data; D.K.F., S.M.E., K.S.B., M.C.D., S.A.B., J.M.D., S.D.K., and C.M.A. interpreted results of experiments; D.K.F., S.M.E., and C.M.A. prepared figures; D.K.F., S.M.E., and C.M.A. drafted manuscript; D.K.F., S.M.E., and C.M.A. edited and revised manuscript; D.K.F., S.M.E., K.S.B., M.C.D., S.A.B., J.M.D., S.D.K., and C.M.A. approved final version of manuscript.
ACKNOWLEDGMENTS
We thank MacKenzie Swan and Blake Smith for technical assistance and Drs. Peter Snyder and Christopher Benson for critical review of the manuscript.
REFERENCES
- 1.Abbas T, Dutta A. p21 in cancer: intricate networks and multiple activities. Nat Rev Cancer 9: 400–414, 2009 [DOI] [PMC free article] [PubMed] [Google Scholar]
- 2.Appell HJ. Skeletal muscle atrophy during immobilization. Int J Sports Med 7: 1–5, 1986 [DOI] [PubMed] [Google Scholar]
- 3.Banduseela VC, Ochala J, Chen YW, Goransson H, Norman H, Radell P, Eriksson LI, Hoffman EP, Larsson L. Gene expression and muscle fiber function in a porcine ICU model. Physiol Genomics 39: 141–159, 2009 [DOI] [PubMed] [Google Scholar]
- 4.Bodine SC. Disuse-induced muscle wasting. Int J Biochem Cell Biol 45: 2200–2208, 2013 [DOI] [PMC free article] [PubMed] [Google Scholar]
- 5.Bodine SC, Latres E, Baumhueter S, Lai VK, Nunez L, Clarke BA, Poueymirou WT, Panaro FJ, Na E, Dharmarajan K, Pan ZQ, Valenzuela DM, DeChiara TM, Stitt TN, Yancopoulos GD, Glass DJ. Identification of ubiquitin ligases required for skeletal muscle atrophy. Science 294: 1704–1708, 2001 [DOI] [PubMed] [Google Scholar]
- 6.Bongers KS, Fox DK, Ebert SM, Kunkel SD, Dyle MC, Bullard SA, Dierdorff JM, Adams CM. Skeletal muscle denervation causes skeletal muscle atrophy through a pathway that involves both Gadd45a and HDAC4. Am J Physiol Endocrinol Metab 305: E907–E915, 2013 [DOI] [PMC free article] [PubMed] [Google Scholar]
- 7.Brooke MH, Kaiser KK. Three “myosin adenosine triphosphatase” systems: the nature of their pH lability and sulfhydryl dependence. J Histochem Cytochem 18: 670–672, 1970 [DOI] [PubMed] [Google Scholar]
- 8.Bruning JC, Michael MD, Winnay JN, Hayashi T, Horsch D, Accili D, Goodyear LJ, Kahn CR. A muscle-specific insulin receptor knockout exhibits features of the metabolic syndrome of NIDDM without altering glucose tolerance. Mol Cell 2: 559–569, 1998 [DOI] [PubMed] [Google Scholar]
- 9.Budanov AV, Karin M. p53 target genes sestrin1 and sestrin2 connect genotoxic stress and mTOR signaling. Cell 134: 451–460, 2008 [DOI] [PMC free article] [PubMed] [Google Scholar]
- 10.Caron AZ, Drouin G, Desrosiers J, Trensz F, Grenier G. A novel hindlimb immobilization procedure for studying skeletal muscle atrophy and recovery in mouse. J Appl Physiol 106: 2049–2059, 2009 [DOI] [PubMed] [Google Scholar]
- 11.Carrier F, Smith ML, Bae I, Kilpatrick KE, Lansing TJ, Chen CY, Engelstein M, Friend SH, Henner WD, Gilmer TM, Kastan MB, Fornace AJ., Jr Characterization of human Gadd45, a p53-regulated protein. J Biol Chem 269: 32672–32677, 1994 [PubMed] [Google Scholar]
- 12.Cohn RD, Henry MD, Michele DE, Barresi R, Saito F, Moore SA, Flanagan JD, Skwarchuk MW, Robbins ME, Mendell JR, Williamson RA, Campbell KP. Disruption of DAG1 in differentiated skeletal muscle reveals a role for dystroglycan in muscle regeneration. Cell 110: 639–648, 2002 [DOI] [PubMed] [Google Scholar]
- 13.de Vries A, Flores ER, Miranda B, Hsieh HM, van Oostrom CT, Sage J, Jacks T. Targeted point mutations of p53 lead to dominant-negative inhibition of wild-type p53 function. Proc Natl Acad Sci USA 99: 2948–2953, 2002 [DOI] [PMC free article] [PubMed] [Google Scholar]
- 14.Deng C, Zhang P, Harper JW, Elledge SJ, Leder P. Mice lacking p21CIP1/WAF1 undergo normal development, but are defective in G1 checkpoint control. Cell 82: 675–684, 1995 [DOI] [PubMed] [Google Scholar]
- 15.Dreyer HC, Strycker LA, Senesac HA, Hocker AD, Smolkowski K, Shah SN, Jewett BA. Essential amino acid supplementation in patients following total knee arthroplasty. J Clin Invest 123: 4654–4666, 2013 [DOI] [PMC free article] [PubMed] [Google Scholar]
- 16.Dubowitz V, Sewry CA. Muscle Biopsy: A Practical Approach. Philadelphia, PA: Saunders/Elsevier, 2007, p. xiii, 611 [Google Scholar]
- 17.Ebert SM, Dyle MC, Kunkel SD, Bullard SA, Bongers KS, Fox DK, Dierdorff JM, Foster ED, Adams CM. Stress-induced skeletal muscle Gadd45a expression reprograms myonuclei and causes muscle atrophy. J Biol Chem 287: 27290–27301, 2012 [DOI] [PMC free article] [PubMed] [Google Scholar]
- 18.Ebert SM, Monteys AM, Fox DK, Bongers KS, Shields BE, Malmberg SE, Davidson BL, Suneja M, Adams CM. The transcription factor ATF4 promotes skeletal myofiber atrophy during fasting. Mol Endocrinol 24: 790–799, 2010 [DOI] [PMC free article] [PubMed] [Google Scholar]
- 19.Edwards MG, Anderson RM, Yuan M, Kendziorski CM, Weindruch R, Prolla TA. Gene expression profiling of aging reveals activation of a p53-mediated transcriptional program. BMC Genomics 8: 80, 2007 [DOI] [PMC free article] [PubMed] [Google Scholar]
- 20.Ehrnhoefer DE, Skotte NH, Ladha S, Nguyen YT, Qiu X, Deng Y, Huynh KT, Engemann S, Nielsen SM, Becanovic K, Leavitt BR, Hasholt L, Hayden MR. p53 increases caspase-6 expression and activation in muscle tissue expressing mutant huntingtin. Hum Mol Genet 23: 717–729, 2014 [DOI] [PubMed] [Google Scholar]
- 21.el-Deiry WS, Tokino T, Velculescu VE, Levy DB, Parsons R, Trent JM, Lin D, Mercer WE, Kinzler KW, Vogelstein B. WAF1, a potential mediator of p53 tumor suppression. Cell 75: 817–825, 1993 [DOI] [PubMed] [Google Scholar]
- 22.el-Deiry WS, Tokino T, Waldman T, Oliner JD, Velculescu VE, Burrell M, Hill DE, Healy E, Rees JL, Hamilton SR, Kinzler KW, Vogelstein B. Topological control of p21WAF1/CIP1 expression in normal and neoplastic tissues. Cancer Res 55: 2910–2919, 1995 [PubMed] [Google Scholar]
- 23.Fiscella M, Ullrich SJ, Zambrano N, Shields MT, Lin D, Lees-Miller SP, Anderson CW, Mercer WE, Appella E. Mutation of the serine 15 phosphorylation site of human p53 reduces the ability of p53 to inhibit cell cycle progression. Oncogene 8: 1519–1528, 1993 [PubMed] [Google Scholar]
- 24.Gonzalez de Aguilar JL, Niederhauser-Wiederkehr C, Halter B, De Tapia M, Di Scala F, Demougin P, Dupuis L, Primig M, Meininger V, Loeffler JP. Gene profiling of skeletal muscle in an amyotrophic lateral sclerosis mouse model. Physiol Genomics 32: 207–218, 2008 [DOI] [PubMed] [Google Scholar]
- 25.Harding HP, Zhang Y, Zeng H, Novoa I, Lu PD, Calfon M, Sadri N, Yun C, Popko B, Paules R, Stojdl DF, Bell JC, Hettmann T, Leiden JM, Ron D. An integrated stress response regulates amino acid metabolism and resistance to oxidative stress. Mol Cell 11: 619–633, 2003 [DOI] [PubMed] [Google Scholar]
- 26.Hill R, Bodzak E, Blough MD, Lee PW. p53 Binding to the p21 promoter is dependent on the nature of DNA damage. Cell Cycle 7: 2535–2543, 2008 [DOI] [PubMed] [Google Scholar]
- 27.Horn HF, Vousden KH. Coping with stress: multiple ways to activate p53. Oncogene 26: 1306–1316, 2007 [DOI] [PubMed] [Google Scholar]
- 28.Huang Q, Raya A, DeJesus P, Chao SH, Quon KC, Caldwell JS, Chanda SK, Izpisua-Belmonte JC, Schultz PG. Identification of p53 regulators by genome-wide functional analysis. Proc Natl Acad Sci USA 101: 3456–3461, 2004 [DOI] [PMC free article] [PubMed] [Google Scholar]
- 29.Ibebunjo C, Chick JM, Kendall T, Eash JK, Li C, Zhang Y, Vickers C, Wu Z, Clarke BA, Shi J, Cruz J, Fournier B, Brachat S, Gutzwiller S, Ma Q, Markovits J, Broome M, Steinkrauss M, Skuba E, Galarneau JR, Gygi SP, Glass DJ. Genomic and proteomic profiling reveals reduced mitochondrial function and disruption of the neuromuscular junction driving rat sarcopenia. Mol Cell Biol 33: 194–212, 2013 [DOI] [PMC free article] [PubMed] [Google Scholar]
- 30.Ishido M, Kami K, Masuhara M. In vivo expression patterns of MyoD, p21, and Rb proteins in myonuclei and satellite cells of denervated rat skeletal muscle. Am J Physiol Cell Physiol 287: C484–C493, 2004 [DOI] [PubMed] [Google Scholar]
- 31.Kastan MB, Zhan Q, el-Deiry WS, Carrier F, Jacks T, Walsh WV, Plunkett BS, Vogelstein B, Fornace AJ., Jr A mammalian cell cycle checkpoint pathway utilizing p53 and GADD45 is defective in ataxia-telangiectasia. Cell 71: 587–597, 1992 [DOI] [PubMed] [Google Scholar]
- 32.Kelleher AR, Kimball SR, Dennis MD, Schilder RJ, Jefferson LS. The mTORC1 signaling repressors REDD1/2 are rapidly induced and activation of p70S6K1 by leucine is defective in skeletal muscle of an immobilized rat hindlimb. Am J Physiol Endocrinol Metab 304: E229–E236, 2013 [DOI] [PMC free article] [PubMed] [Google Scholar]
- 33.Kruse JP, Gu W. Modes of p53 regulation. Cell 137: 609–622, 2009 [DOI] [PMC free article] [PubMed] [Google Scholar]
- 34.Kunkel SD, Suneja M, Ebert SM, Bongers KS, Fox DK, Malmberg SE, Alipour F, Shields RK, Adams CM. mRNA expression signatures of human skeletal muscle atrophy identify a natural compound that increases muscle mass. Cell Metab 13: 627–638, 2011 [DOI] [PMC free article] [PubMed] [Google Scholar]
- 35.Laure L, Suel L, Roudaut C, Bourg N, Ouali A, Bartoli M, Richard I, Danièle N. Cardiac ankyrin repeat protein is a marker of skeletal muscle pathological remodelling. FEBS J 276: 669–684, 2009 [DOI] [PubMed] [Google Scholar]
- 36.Liu DX, Lobie PE. Transcriptional activation of p53 by Pitx1. Cell Death Differ 14: 1893–1907, 2007 [DOI] [PubMed] [Google Scholar]
- 37.Llano-Diez M, Gustafson AM, Olsson C, Goransson H, Larsson L. Muscle wasting and the temporal gene expression pattern in a novel rat intensive care unit model. BMC Genomics 12: 602, 2011 [DOI] [PMC free article] [PubMed] [Google Scholar]
- 38.Macleod KF, Sherry N, Hannon G, Beach D, Tokino T, Kinzler K, Vogelstein B, Jacks T. p53-dependent and independent expression of p21 during cell growth, differentiation, and DNA damage. Genes Dev 9: 935–944, 1995 [DOI] [PubMed] [Google Scholar]
- 39.Maddocks OD, Vousden KH. Metabolic regulation by p53. J Mol Med 89: 237–245, 2011 [DOI] [PMC free article] [PubMed] [Google Scholar]
- 40.Mahmoudi S, Henriksson S, Corcoran M, Mendez-Vidal C, Wiman KG, Farnebo M. Wrap53, a natural p53 antisense transcript required for p53 induction upon DNA damage. Mol Cell 33: 462–471, 2009 [DOI] [PubMed] [Google Scholar]
- 41.Marino S, Vooijs M, van Der Gulden H, Jonkers J, Berns A. Induction of medulloblastomas in p53-null mutant mice by somatic inactivation of Rb in the external granular layer cells of the cerebellum. Genes Dev 14: 994–1004, 2000 [PMC free article] [PubMed] [Google Scholar]
- 42.Mazan-Mamczarz K, Galban S, Lopez de Silanes I, Martindale JL, Atasoy U, Keene JD, Gorospe M. RNA-binding protein HuR enhances p53 translation in response to ultraviolet light irradiation. Proc Natl Acad Sci USA 100: 8354–8359, 2003 [DOI] [PMC free article] [PubMed] [Google Scholar]
- 43.Meier W, Mizner RL, Marcus RL, Dibble LE, Peters C, Lastayo PC. Total knee arthroplasty: muscle impairments, functional limitations, and recommended rehabilitation approaches. J Orthop Sports Phys Ther 38: 246–256, 2008 [DOI] [PubMed] [Google Scholar]
- 44.Oren M. Regulation of the p53 tumor suppressor protein. J Biol Chem 274: 36031–36034, 1999 [DOI] [PubMed] [Google Scholar]
- 45.Petterson SC, Mizner RL, Stevens JE, Raisis L, Bodenstab A, Newcomb W, Snyder-Mackler L. Improved function from progressive strengthening interventions after total knee arthroplasty: a randomized clinical trial with an imbedded prospective cohort. Arthritis Rheum 61: 174–183, 2009 [DOI] [PubMed] [Google Scholar]
- 46.Proud CG. eIF2 and the control of cell physiology. Semin Cell Dev Biol 16: 3–12, 2005 [DOI] [PubMed] [Google Scholar]
- 47.Puzio-Kuter AM. The Role of p53 in Metabolic Regulation. Genes Cancer 2: 385–391, 2011 [DOI] [PMC free article] [PubMed] [Google Scholar]
- 48.Raman V, Martensen SA, Reisman D, Evron E, Odenwald WF, Jaffee E, Marks J, Sukumar S. Compromised HOXA5 function can limit p53 expression in human breast tumours. Nature 405: 974–978, 2000 [DOI] [PubMed] [Google Scholar]
- 49.Sacheck JM, Hyatt JP, Raffaello A, Jagoe RT, Roy RR, Edgerton VR, Lecker SH, Goldberg AL. Rapid disuse and denervation atrophy involve transcriptional changes similar to those of muscle wasting during systemic diseases. FASEB J 21: 140–155, 2007 [DOI] [PubMed] [Google Scholar]
- 50.Sartori R, Milan G, Patron M, Mammucari C, Blaauw B, Abraham R, Sandri M. Smad2 and 3 transcription factors control muscle mass in adulthood. Am J Physiol Cell Physiol 296: C1248–C1257, 2009 [DOI] [PubMed] [Google Scholar]
- 51.Schwarzkopf M, Coletti D, Marazzi G, Sassoon D. Chronic p53 activity leads to skeletal muscle atrophy and muscle stem cell perturbation. Basic Appl Myol 18: 131–138, 2009 [Google Scholar]
- 52.Schwarzkopf M, Coletti D, Sassoon D, Marazzi G. Muscle cachexia is regulated by a p53-PW1/Peg3-dependent pathway. Genes Dev 20: 3440–3452, 2006 [DOI] [PMC free article] [PubMed] [Google Scholar]
- 53.Shadfan M, Lopez-Pajares V, Yuan ZM. MDM2 and MDMX: Alone and together in regulation of p53. Transl Cancer Res 1: 88–89, 2012 [PMC free article] [PubMed] [Google Scholar]
- 54.Shieh SY, Ikeda M, Taya Y, Prives C. DNA damage-induced phosphorylation of p53 alleviates inhibition by MDM2. Cell 91: 325–334, 1997 [DOI] [PubMed] [Google Scholar]
- 55.Siliciano JD, Canman CE, Taya Y, Sakaguchi K, Appella E, Kastan MB. DNA damage induces phosphorylation of the amino terminus of p53. Genes Dev 11: 3471–3481, 1997 [DOI] [PMC free article] [PubMed] [Google Scholar]
- 56.Siu F, Bain PJ, LeBlanc-Chaffin R, Chen H, Kilberg MS. ATF4 is a mediator of the nutrient-sensing response pathway that activates the human asparagine synthetase gene. J Biol Chem 277: 24120–24127, 2002 [DOI] [PubMed] [Google Scholar]
- 57.Siu PM, Alway SE. Id2 and p53 participate in apoptosis during unloading-induced muscle atrophy. Am J Physiol Cell Physiol 288: C1058–C1073, 2005 [DOI] [PubMed] [Google Scholar]
- 58.Siu PM, Alway SE. Mitochondria-associated apoptotic signalling in denervated rat skeletal muscle. J Physiol 565: 309–323, 2005 [DOI] [PMC free article] [PubMed] [Google Scholar]
- 59.Stevenson EJ, Giresi PG, Koncarevic A, Kandarian SC. Global analysis of gene expression patterns during disuse atrophy in rat skeletal muscle. J Physiol 551: 33–48, 2003 [DOI] [PMC free article] [PubMed] [Google Scholar]
- 60.Takagi M, Absalon MJ, McLure KG, Kastan MB. Regulation of p53 translation and induction after DNA damage by ribosomal protein L26 and nucleolin. Cell 123: 49–63, 2005 [DOI] [PubMed] [Google Scholar]
- 61.Vandenborne K, Elliott MA, Walter GA, Abdus S, Okereke E, Shaffer M, Tahernia D, Esterhai JL. Longitudinal study of skeletal muscle adaptations during immobilization and rehabilitation. Muscle Nerve 21: 1006–1012, 1998 [DOI] [PubMed] [Google Scholar]
- 62.Vilborg A, Glahder JA, Wilhelm MT, Bersani C, Corcoran M, Mahmoudi S, Rosenstierne M, Grander D, Farnebo M, Norrild B, Wiman KG. The p53 target Wig-1 regulates p53 mRNA stability through an AU-rich element. Proc Natl Acad Sci USA 106: 15756–15761, 2009 [DOI] [PMC free article] [PubMed] [Google Scholar]
- 63.Welle S, Brooks AI, Delehanty JM, Needler N, Bhatt K, Shah B, Thornton CA. Skeletal muscle gene expression profiles in 20–29 year old and 65–71 year old women. Exp Gerontol 39: 369–377, 2004 [DOI] [PubMed] [Google Scholar]
- 64.Welle S, Brooks AI, Delehanty JM, Needler N, Thornton CA. Gene expression profile of aging in human muscle. Physiol Genomics 14: 149–159, 2003 [DOI] [PubMed] [Google Scholar]
- 65.Yu Y, Zhang D, Huang H, Li J, Zhang M, Wan Y, Gao J, Huang C. NF-kappa B1 p50 promotes p53 protein translation through miR-190 downregulation of PHLPP1. Oncogene 33: 996–1005, 2014 [DOI] [PMC free article] [PubMed] [Google Scholar]
- 66.Zhan Q. Gadd45a, a p53- and BRCA1-regulated stress protein, in cellular response to DNA damage. Mutat Res 569: 133–143, 2005 [DOI] [PubMed] [Google Scholar]
- 67.Zhang M, Zhang J, Chen X, Cho SJ, Chen X. Glycogen synthase kinase 3 promotes p53 mRNA translation via phosphorylation of RNPC1. Genes Dev 27: 2246–2258, 2013 [DOI] [PMC free article] [PubMed] [Google Scholar]
- 68.Zou T, Mazan-Mamczarz K, Rao JN, Liu L, Marasa BS, Zhang AH, Xiao L, Pullmann R, Gorospe M, Wang JY. Polyamine depletion increases cytoplasmic levels of RNA-binding protein HuR leading to stabilization of nucleophosmin and p53 mRNAs. J Biol Chem 281: 19387–19394, 2006 [DOI] [PubMed] [Google Scholar]