Abstract
Zinc deficiency is a consistent phenomenon observed in patients with alcoholic liver disease, but the mechanisms have not been well defined. The objective of this study was to determine if alcohol alters hepatic zinc transporters in association with reduction of hepatic zinc levels and if oxidative stress mediates the alterations of zinc transporters. C57BL/6 mice were pair-fed with the Lieber-DeCarli control or ethanol diets for 2, 4, or 8 wk. Chronic alcohol exposure reduced hepatic zinc levels, but increased plasma and urine zinc levels, at all time points. Hepatic zinc finger proteins, peroxisome proliferator-activated receptor-α (PPAR-α) and hepatocyte nuclear factor 4α (HNF-4α), were downregulated in ethanol-fed mice. Four hepatic zinc transporter proteins showed significant alterations in ethanol-fed mice compared with the controls. ZIP5 and ZIP14 proteins were downregulated, while ZIP7 and ZnT7 proteins were upregulated, by ethanol exposure at all time points. Immunohistochemical staining demonstrated that chronic ethanol exposure upregulated cytochrome P-450 2E1 and caused 4-hydroxynonenal accumulation in the liver. For the in vitro study, murine FL-83B hepatocytes were treated with 5 μM 4-hydroxynonenal or 100 μM hydrogen peroxide for 72 h. The results from in vitro studies demonstrated that 4-hydroxynonenal treatment altered ZIP5 and ZIP7 protein abundance, and hydrogen peroxide treatment changed ZIP7, ZIP14, and ZnT7 protein abundance. These results suggest that chronic ethanol exposure alters hepatic zinc transporters via oxidative stress, which might account for ethanol-induced hepatic zinc deficiency.
Keywords: alcoholic liver disease, oxidative stress, zinc, zinc transporters
alcoholic liver disease (ALD) is a major cause of morbidity and mortality among alcoholic populations (34). Zinc deficiency as a major nutritional defect has been well documented in ALD (29). Clinical studies showed that patients with advanced ALD had lower zinc levels in serum and liver but higher zinc level in urine (2, 16, 20, 33). Hepatic zinc levels in patients with hepatitis and cirrhosis were reduced to 49–54% of the healthy subjects (2). Chronic ethanol exposure significantly decreased hepatic zinc levels and induced production of reactive oxygen species (ROS) in mice (38). Dietary zinc supplementation to ethanol-fed mice improved hepatic zinc status, and attenuated oxidative stress and liver injury in association with increased antioxidant capacity (17, 38).
Zinc is an essential trace element that plays an important role in maintaining normal cellular functions (22). Zinc serves as a catalytic cofactor for hundreds of enzymes (4, 7). Zinc is also required for stabilizing the structure of thousands of proteins (4, 7, 21). Zinc deficiency is linked with impaired immune function, growth retardation, and dermatologic lesion (4, 35). On the other hand, a high level of free zinc is cytotoxic (7). Therefore, tight regulation of intracellular zinc concentrations is required, which is achieved mainly by two families of zinc transporters, Zn2+-regulated metal transporter (Zrt) and iron-regulated metal transporter (Irt)-like protein (ZIP), and zinc transporter (ZnT) (25).
The ZIP family has 14 members from ZIP1 to ZIP14, and they function in transporting zinc from extracellular space or intracellular organelles into cytosol. The ZnT family contains 10 members from ZnT1 to ZnT10, and they are responsible for exporting zinc from cytosol to extracellular space or intracellular organelles. The cytosolic zinc concentration is regulated positively by ZIPs and negatively by ZnTs, while the organelle zinc levels are regulated positively by ZnTs and negatively by ZIPs. Dysregulation of zinc transporters has been implicated in the pathogenesis of human diseases (6, 13, 26). Given the evidence that hepatic zinc deficiency is consistently observed in alcoholic patients and chronic ethanol-fed animals, and given the fact that ZIP and ZnT are two major zinc transporters in controlling extracellular and intracellular zinc trafficking, we postulated that dysregulation of zinc transporters would be responsible for alcohol-induced hepatic zinc deficiency. The present study was undertaken to determine whether or not chronic ethanol feeding alters hepatic expression of zinc transporters in mice. Because oxidative stress is a feature of ALD, the mechanistic link between oxidative stress and dysregulation of zinc transporters was also evaluated.
METHODS AND MATERIALS
Animal and alcohol feeding experiments.
Male C57BL/6 mice were obtained from Jackson Laboratory (Bar Harbor, ME). All mice were treated according to the experimental procedures approved by the Institutional Animal Care and Use Committee. The mice were pair-fed a modified Lieber-DeCarli ethanol or control liquid diet for 2, 4, or 8 wk, respectively. The ethanol provided 28% of total calories in the diet. Urine samples were collected at 9:00 am 1 day before the animals were euthanized. The mice were anesthetized with isoflurane, and blood and liver tissues were harvested for assays.
Blood parameter assay.
Blood glucose was determined by OneTouch Ultra2 blood glucose meter (Life Scan, Milpitas, CA). Plasma β-hydroxybutyrate was measured by Cayman Chemical Assay Kit (Ann Arbor, MI). Activity of alanine aminotransferase (ALT) was measured by Infinity ALT reagent (Thermo Scientific, Waltham, MA).
Determination of zinc concentrations in the liver, plasma, and urine.
Zinc concentrations in the liver, plasma, and urine were determined by atomic absorption spectrophotometry (AAS). The frozen livers were air-dried in the hood overnight, and then each sample was digested with 1 ml concentrated nitrite acid for ∼12 h. Each test tube with digested sample was then incubated in water bath at 100°C for 1 h. After cooling, each sample was diluted with deionized water and measured with AAS. One hundred and twenty microliters of plasma or urine was directly measured with AAS. The urinary creatinine concentrations were measured with a urinary creatinine assay kit (Cayman Chemical, Anne Arbor, MI) to normalize urine zinc levels. The zinc concentrations in the liver, plasma, and urine were calculated as micrograms per gram dry liver weight, micrograms per deciliter, and micrograms per milligram creatinine, respectively.
Immunohistochemical detection of hepatic CYP2E1, 4-hydroxynonenal, ZIP5, ZIP7, and ZnT7.
Hepatic CYP2E1, 4-hydroxynonenal (4-HNE), ZIP5, Zip7, and ZnT7 levels were detected by immunohistochemical staining. Briefly, liver tissue paraffin sections were incubated with 3% hydrogen peroxide for 10 min to inactivate endogenous peroxidases. The endogenous mouse IgG was blocked by incubation with a mouse-to-mouse blocking reagent (ScyTek Laboratories, Logan, UT). Tissue sections were then incubated with a polyclonal rabbit anti-CYP2E1 antibody (Abcam, Cambridge, MA), or a monoclonal mouse anti-4-HNE antibody (Northwest Life Science Specialties, Vancouver, WA), or a polyclonal rabbit anti-ZIP5 antibody (Novus Biological, Littleton, CO), or polyclonal goat anti-ZIP7 antibody (Santa Cruz Biotechnologies, Santa Cruz, CA) or a polyclonal rabbit anti-ZnT7 antibody (Proteintech, Chicago, IL) at 4°C overnight, followed by incubation with EnVision+ Labeled Polymer-horseradish peroxidase (HRP)-conjugated anti-rabbit IgG or anti-mouse IgG (DAKO, Carpinteria, CA) or HRP-conjugated goat anti-rabbit IgG (Thermo Scientific, Waltham, MA) at room temperature for 30 min. Diaminobenzidine (DAB) was used as HRP substrate for visualization.
qPCR.
The total RNA was isolated and reverse transcribed with TaqMan reverse transcription reagents (Life Technologies, Carlsbad, CA). The forward and reverse primers of all 24 zinc transporters and β-actin were purchased from Integrated DNA Technologies (Coralville, IA). Primer sequences for the qPCRs are provided in Table 1. qPCR analysis with SYBR green PCR Master Mix (Qiagen, Valencia, CA) was performed on the Applied Biosystems 7500 Real Time PCR System (Applied Biosystems). The data were normalized to β-actin and expressed as relative fold changes, with the value of control of ZIP1 or ZnT1 set as 1, respectively.
Table 1.
Primer sequence used for qPCR analysis
| Origin | Name | Forward Primer (5′→3′) | Reverse Primer (5′→3′) |
|---|---|---|---|
| Mouse NM_013901 | ZIP1 | AGGTCAGGTGCTAACCATGAA | CTGTTCCTTGTAAGCCAGCGT |
| Mouse NM_001039676 | ZIP2 | CATATGACTGCTGAAGCTCTGG | CGAGAAGAATTTCCCTTACTTCC |
| Mouse NM_134135 | ZIP3 | GGTGGCGTATTCCTGGCTAC | CTGCTCCACGAACACAGTGA |
| Mouse NM_028064 | ZIP4 | ATGCTCCCAAAGTCGGTCAC | CAGCGTATTTAACAGGCCGTC |
| Mouse NM_028092 | ZIP5 | ATCATCTGCTGACTGGCCTAT | CAGTGTCCCGTTCTCTCCATA |
| Mouse NM_139143 | ZIP6 | GTCACACGGTTGCTGGTAAAA | GGGCGAGATCCTTTCCCTAGA |
| Mouse NM_008202 | ZIP7 | TGAAAGCATCTGGCATGGG | TGGAGGCTATCGTGGGAGTG |
| Mouse NM_026228 | ZIP8 | GCCAAGCTCATGTACCTGTCT | AAGATGCCCCAATCGCCAA |
| Mouse NM_026244 | ZIP9 | TGTTGGTGGGATGTTACGTGG | GATGACCGCCAGTGCAGTT |
| Mouse NM_172653 | ZIP10 | TCATCGCCATCGTTTGCATCA | CTCTGGTGAAGGGCTGTGAC |
| Mouse NM_027216 | ZIP11 | GTTAGCGGCTTCCTACTGGTC | TCCCCAACAGTGGTGTTTTCG |
| Mouse NM_001012305 | ZIP12 | CCTGCTCCATCTCATACCTC | TCCCAACAGCTTCCAAATAGG |
| Mouse NM_026721 | ZIP13 | TGCCTGTCGCCTGGATAATAA | ACTGAGCCCAACCATGAGAGA |
| Mouse NM_144108 | ZIP14 | GTGTCTCACTGATTAACCTGGC | AGAGCAGCGTTCCAATGGAC |
| Mouse NM_009579 | ZnT1 | GGAAGCGGAAGACAACAGGG | CAAGGCATTCACGACCACG |
| Mouse NM_001039677 | ZnT2 | CACCTGCTCACGGATTTTG | AGATGGAAAGCACGGACAAC |
| Mouse NM_011773 | ZnT3 | GACCTCTCTCTCTCTCCATCTT | AGGCACAGGCACACATAAA |
| Mouse NM_011774 | ZnT4 | AAGCGCCTCAAATCCCTGC | CCACCACGACTCGAAGTTTATT |
| Mouse NM_022885 | ZnT5 | TGGACCACTAAGGACCTTGCT | CAGCCCCTCTTGTCTTTGC |
| Mouse NM_144798 | ZnT6 | ATGGGGACGATTCATCTCTTTCG | CACAGCACGTTGATTGCACC |
| Mouse NM_023214 | ZnT7 | GGATGATGAATACAAACCACCCA | AAAGCGAAAGAGAGGTTCAGG |
| Mouse NM_172816 | ZnT8 | TGAGCGCCTTTTGTATCCTG | GTTGTAGCCAAAGTTCCGTTG |
| Mouse NM_178651 | ZnT9 | ACCAATGGAATCCCTGCTATG | ATTGCCTGTTATGGAGGTAAGG |
| Mouse NM_001033286 | ZnT10 | TCTGAAGCACTCAATATCAGAGG | AGAATATGATAGCCGTGATGACC |
| Mouse NM_007393 | β-actin | TGAGCGCAAGTACTCTGTGTGGAT | GTTTGCTCCAACCAACTGCTGTC |
Immunoblotting analysis.
Liver tissue proteins were extracted by T-PER tissue extraction reagent (Thermo Scientific) containing protease inhibitors (Sigma-Aldrich, St. Louis, MO). Aliquots containing 80 μg proteins were loaded onto an 8%-15% sodium dodecyl sulfate-polyacrylamide gel (SDS-PAGE). After electrophoresis, proteins were transferred to a polyvinylidene fluoride (PVDF) membrane. The membrane was probed with polyclonal antibodies against hepatocyte nuclear factor 4 (HNF-4α), superoxide dismutase 1 (SOD1), ZIP7, ZnT5, ZnT6, ZnT10 (Santa Cruz Biotechnologies), peroxisome proliferator-activated receptor alpha (PPAR-α), ZIP1, ZIP4, ZIP5, ZIP14, ZnT4 (Novus biological), ZIP8 or ZnT7 (Proteintech), respectively. The membrane was then incubated with HRP-conjugated goat anti-rabbit IgG, or goat anti-mouse IgG, or rabbit anti-goat IgG antibody. The protein bands were visualized by an Enhanced Chemiluminescence detection system (GE Healthcare, Piscataway, NJ) and quantified by densitometry analysis.
SOD1 activity assay.
The liver tissues were homogenized with 200 mM HEPES buffer (pH 7.2, containing 1 mM EDTA, 210 mM mannitol, and 70 mM sucrose). Cytosolic fraction was isolated by centrifuging tissue homogenates at 1,500 g for 5 min at 4°C, and then the supernatant was centrifuged at 10,000 g for 15 min at 4°C. The supernatant was the crust cytosol of mice liver tissues. Superoxide dismutase assay kit (Cayman Chemical Company, Anna Arbor, MI) was used to assess the activity of SOD1 by measuring the amount of superoxide radicals, which were generated from xanthine oxidase and hypoxanthine quenched by SOD1.
Cell culture and treatment.
Murine FL-83B cells obtained from the American Type Culture Collection (Manassas, VA) were grown in Dulbecco's modified Eagle medium (DMEM; Invitrogen, Carlsbad, CA) supplemented with 10% fetal bovine serum and penicillin (100 U/ml) streptomycin sulfate (100 μg/ml) (Invitrogen, Carlsbad, CA). To evaluate the role of ROS on alterations of zinc transporters, 1 × 10⁶ cells were seeded to 10-cm dish to reached 70–80% confluence. The cells were treated with 5 μM 4-HNE or 100 μM hydrogen peroxide (H2O2) for 72 h. Cells were then washed with ice cold PBS and harvested with M-PER mammalian protein extraction (Thermo Scientific). Cell lysates were then stored at −80°C until immunoblotting analysis.
Statistical analysis.
Results are expressed as means ± SD. Differences among multiple groups were analyzed by analysis of variance (ANOVA) followed by Tukey's test. Differences between two groups were analyzed by two-tailed Student's t-test. The significance between groups was defined as P < 0.05.
RESULTS
Effects of ethanol exposure on body weight, liver weight, and plasma parameters.
As shown in Table 2, the body weight did not show significant difference between ethanol-fed mice and the controls at all three time points. The liver weight showed a remarkable increase at 4 wk and 8 wk in ethanol-fed mice compared with the controls. The ratio of liver weight to body weight was also significantly higher in ethanol-fed mice at all time points. The activity of plasma ALT and the level of plasma β-hydroxybutyrate were elevated, whereas the plasma glucose levels were reduced in ethanol-fed mice compared with the controls at 8 wk.
Table 2.
Effects of 2, 4, and 8 wk of alcohol exposure on body weight, liver weight, and blood parameters
| 2 wk |
4 wk |
8 wk |
||||
|---|---|---|---|---|---|---|
| Ctrl | EtOH | Ctrl | EtOH | Ctrl | EtOH | |
| Body weight, g | 27.14 ± 2.04 | 24.72 ± 3.16 | 28.97 ± 2.11 | 29.34 ± 1.94 | 31.15 ± 2.02 | 29.63 ± 3.39 |
| Liver weight, g | 1.09 ± 0.1 | 1.18 ± 0.1 | 1.10 ± 0.1 | 1.4 ± 0.2* | 1.18 ± 0.1 | 1.42 ± 0.2* |
| Liver/body weight ratio | 4.01 ± 0.2 | 4.80 ± 0.5* | 3.79 ± 0.12 | 4.47 ± 0.38* | 3.80 ± 0.14 | 4.78 ± 0.36* |
| Blood parameters | ||||||
| ALT activity, U/l | 26.19 ± 8.03 | 25.06 ± 7.3 | 17.53 ± 4.08 | 30.06 ± 13.73 | 17.37 ± 7.72 | 48.02 ± 18.21* |
| β-Hydroxybutyrate, mg/dl | 6.6 ± 2.4 | 9.7 ± 3.0 | 4.8 ± 1.2 | 6.9 ± 0.69 | 4.5 ± 1.2 | 10.6 ± 3.6* |
| Glucose, mg/dl | 247 ± 60.7 | 202.5 ± 71.6 | 273.7 ± 53.2 | 269.5 ± 43.6 | 306.2 ± 25.3 | 246.4 ± 33.9* |
Data are means ± SD (n = 6–8). Mice were pair-fed control or ethanol liquid diets for 2, 4, or 8 wk. ALT, alanine aminotransferase. Significant differences (
P < 0.05) between control- and ethanol-fed mice determined by Student's t-test. Ctrl, control; EtOH, ethanol.
Ethanol exposure impaired zinc homeostasis.
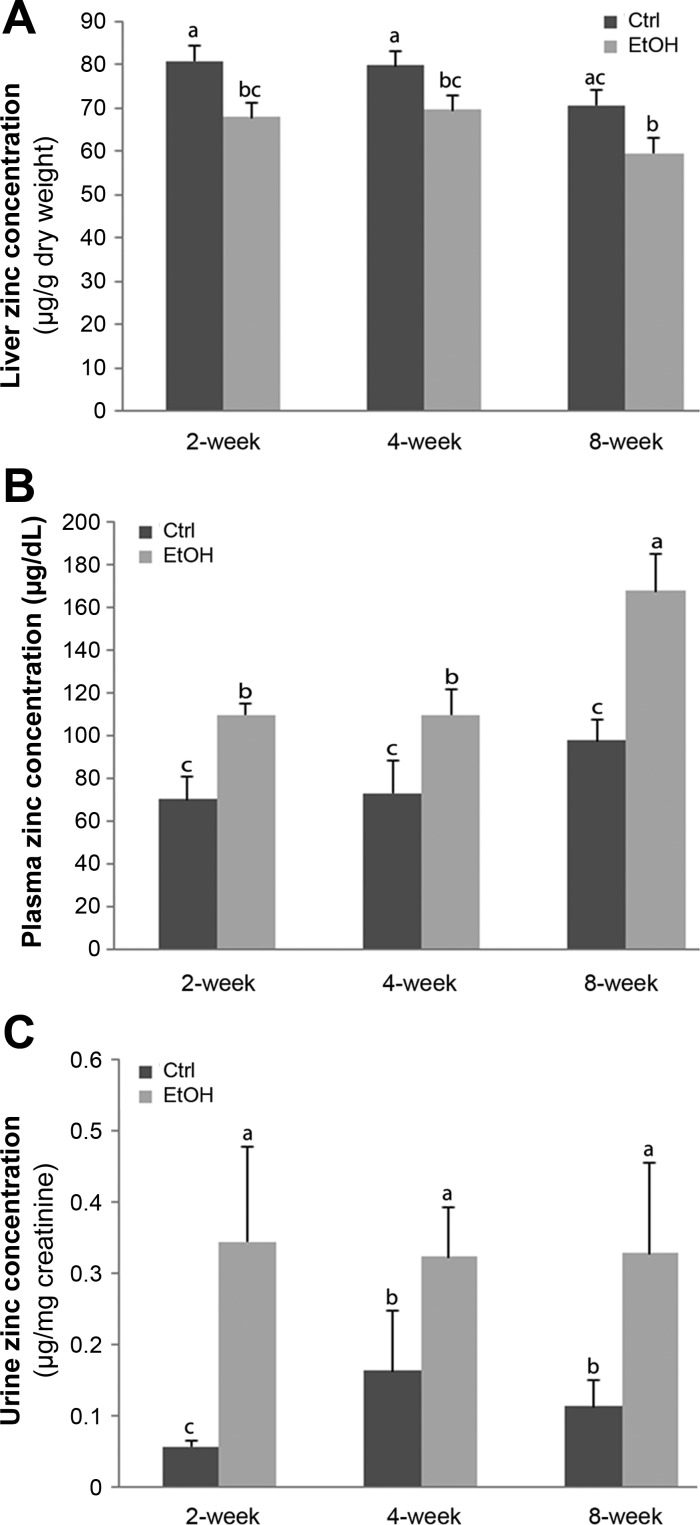
In order to investigate zinc status in mice after alcohol exposure, zinc levels in the liver, plasma, and urine were measured. As illustrated in Fig. 1, hepatic zinc levels were significantly lower at all three time points in ethanol-fed mice compared with the controls. However, zinc levels in plasma and urine were remarkably increased in ethanol-fed mice compared with the controls at all three time points.
Fig. 1.
Zinc levels in liver, plasma, and urine samples in mice chronically fed ethanol or control diet for 2, 4, or 8 wk. Zinc levels in the liver (A), plasma (B), and urine (C) were measured by atomic absorption spectrophotometry (AAS). Urine zinc was normalized by urine creatinine levels. Results are expressed as means ± SD (n = 6–8). Results for bars that do not share a letter differed significantly among groups (P < 0.05). Significant differences among groups are determined by ANOVA followed by Tukey's test. Ctrl, control; EtOH, ethanol.
Ethanol exposure suppressed hepatic zinc proteins.
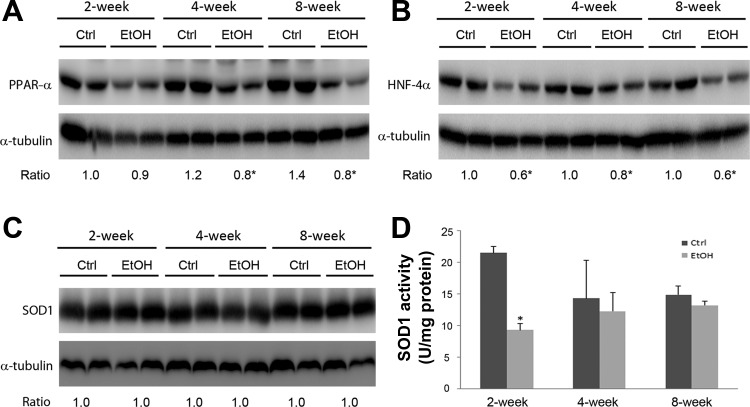
The major function of zinc is achieved through coordination to zinc proteins. To determine if decreased hepatic zinc levels were associated with inactivation of zinc binding proteins, the protein levels of HNF-4α, PPAR-α, and SOD1 were measured. As shown in Fig. 2, ethanol exposure significantly reduced the protein level of PPAR-α at 4 and 8 wk, and HNF-4α at all three time points. Although the protein level of cytosolic SOD1 was not affected by ethanol exposure, the activity of SOD1 was decreased at 2 wk in ethanol-fed mice compared with the controls.
Fig. 2.
Protein levels of zinc-binding proteins in mouse livers. Mice were chronically fed an ethanol or control diet for 2, 4, or 8 wk. The immunoblot bands of peroxisome proliferator-activated receptor-α (PPAR-α; A), hepatocyte nuclear factor 4α (HNF-4α; B), and superoxide dismutase 1 (SOD1; C) were quantified by densitometry. The ratio to α-tubulin was calculated by setting the value of 2 wk of control as 1. The activity of SOD1 (D) was determined by SOD1 assay kit. Results are expressed as means ± SD (n = 4). Significant differences (*P < 0.05) between groups are determined by Student's t-test.
Ethanol exposure altered hepatic zinc transporters.
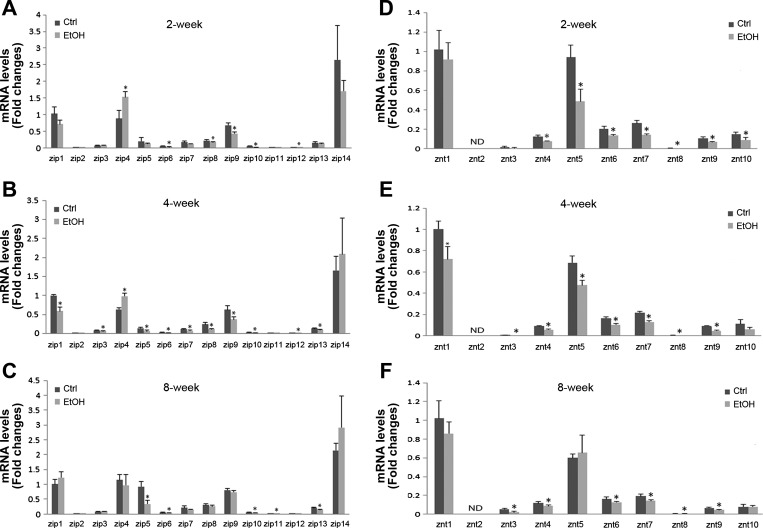
To determine how ethanol exposure affects hepatic zinc transporters, the gene expression levels of the full panel of 14 ZIPs and 10 ZnTs were measured, and results are shown in Fig. 3. In the control mice, the expressions of ZIP1, ZIP4, ZIP5, ZIP7, ZIP8, ZIP9, ZIP13, ZIP14, ZnT1, ZnT4, ZnT5, ZnT6, ZnT7, and ZnT10 were relatively abundant at all three time points. The major effect of ethanol exposure on zinc transporter genes was downregulation. ZIP8, ZIP9, ZnT4, ZnT5, ZnT6, ZnT7, and ZnT10 genes were downregulated by ethanol exposure at 2 wk. ZIP1, ZIP5, ZIP7, ZIP8, ZIP9, ZIP13, ZnT1, ZnT4, ZnT5, ZnT6, and ZnT7 genes were downregulated by ethanol at 4 wk. Ethanol-downregulated genes at 8 wk include ZIP5, ZIP13, ZnT3, ZnT4, ZnT6, and ZnT7. However, ZIP14 gene was upregulated by ethanol exposure at 2 and 4 wk.
Fig. 3.
The gene expression levels of zinc transporters in mouse livers. Mice were fed a liquid control diet or ethanol-containing diet for 2, 4, or 8 wk. The gene expression of zinc transporters was measured by qPCR. The expression levels of hepatic ZIP at 2 wk (A), 4 wk (B), and 8 wk (C). Hepatic ZnT mRNA levels at 2 wk (D), 4 wk (E), and 8 wk (F). Significant differences (*P < 0.05) between control- and ethanol-fed mice are determined by Student's t-test.
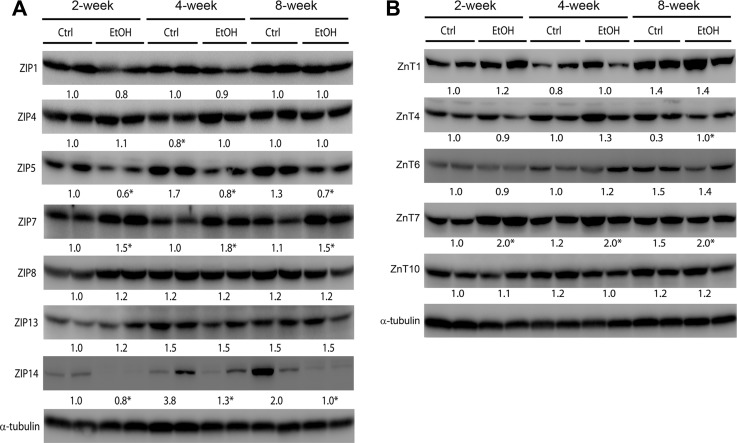
The protein abundance of zinc transporters with higher mRNA levels was then measured by immunoblotting, including ZIP1, ZIP4, ZIP5, ZIP7, ZIP8, ZIP13, ZIP14, ZnT1, ZnT4, ZnT5, ZnT6, ZnT7, and ZnT10. The protein levels of 7 ZIPs and 6 ZnTs are shown in Fig. 4, A and B, respectively. Ethanol exposure significantly reduced the protein levels of ZIP5 and ZIP14 at all three time points but significantly increased ZIP4 protein abundance at 4 wk and ZIP7 protein abundance at all three time points (Fig. 4A). Among the 6 ZnT proteins (Fig. 4B), ethanol exposure significantly reduced ZnT4 protein abundance at 8 wk, but significantly increased ZnT7 protein abundance at all three time points.
Fig. 4.
Protein levels of zinc proteins in mouse livers. Mice were chronically fed ethanol or control diet for 2, 4, or 8 wk. The immunoblot bands of ZIP (A) and ZnT (B) were quantified by densitometry analysis. The ratio to α-tubulin was calculated by setting the value of 2 wk of control as 1. Significant differences (*P < 0.05) between groups are determined by Student's t-test.
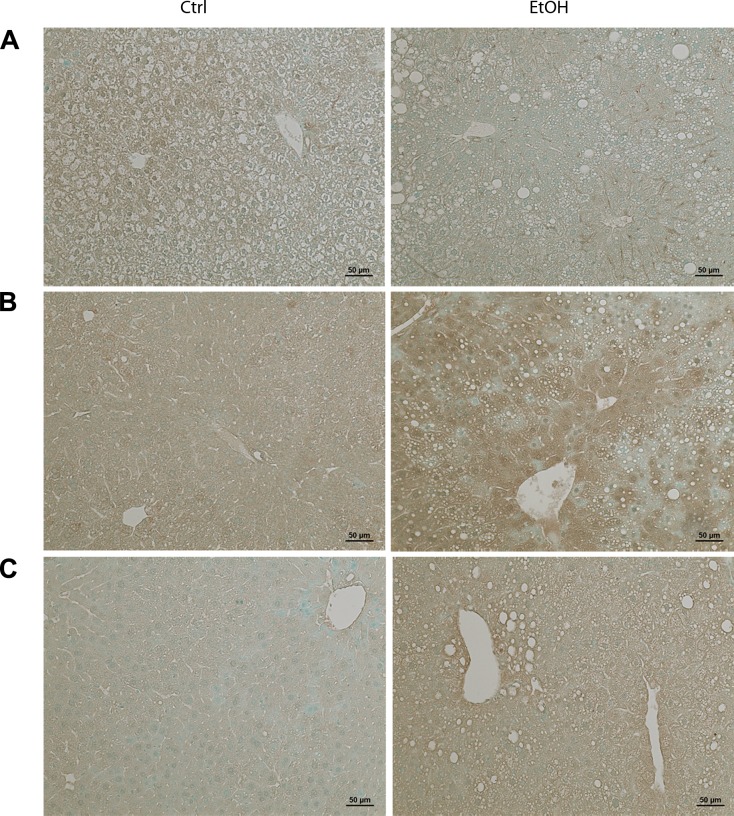
Distribution of ZIP5, ZIP7, and ZnT7 in the liver of mice fed ethanol for 8 wk was detected by immunohistochemistry. As shown in Fig. 5A, chronic ethanol exposure reduced the staining intensity of ZIP5 in the liver. On the contrary, the staining intensity of hepatic ZIP7 (Fig. 5B) and ZnT7 (Fig. 5C) was increased in chronic alcohol-fed, particularly in the area around the portal vein and central vein, compared with the controls.
Fig. 5.
Immunohistochemical staining of ZIP5, ZIP7, and ZnT7 in mouse liver. Mice were chronically fed with ethanol or control diet for 8 wk. A: representative images of ZIP5 immunostaining. B: representative images of ZIP7 immunostaining. C: representative images of ZnT7 immunostaining. Scale bar = 50 μm.
Ethanol exposure induced hepatic CYP2E1 expression and caused lipid peroxidation.
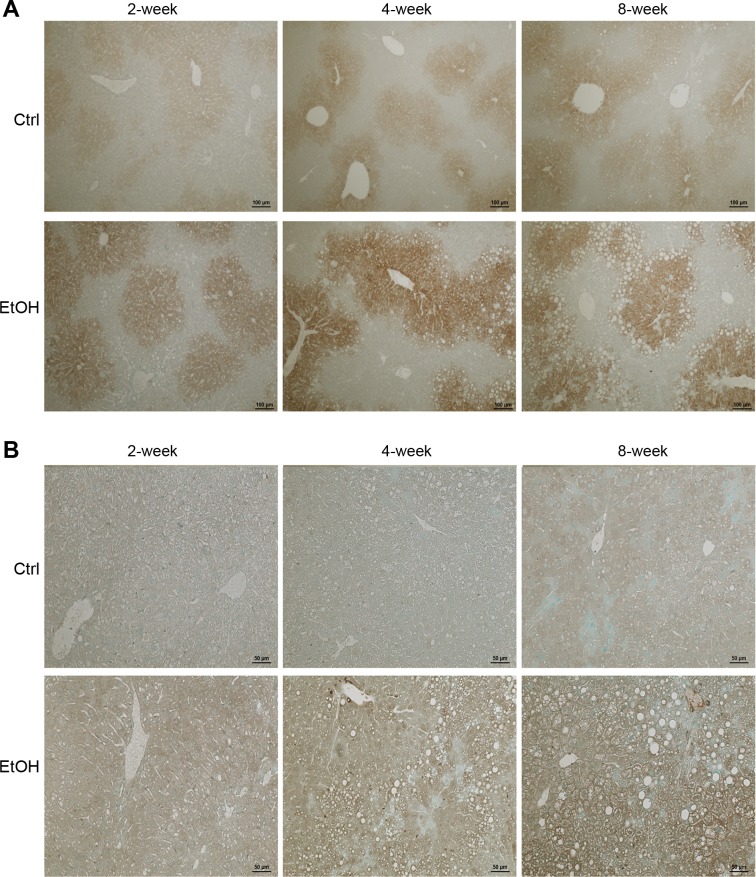
Hepatic CYP2E1 protein and lipid peroxidation product, 4-HNE, were detected by immunohistochemistry. As shown in Fig. 6A, the CYP2E1 staining was mostly found around central vein area, and the staining was weak in the liver of controls, although a slight increase was found at 4 and 8 wk compared with 2 wk. Ethanol exposure increased hepatic CYP2E1 as early as 2 wk and further increased at 4 and 8 wk. The immunohistochemical staining of 4-HNE is shown in Fig. 6B. While only weak staining was found in the control mice at 8 wk, ethanol exposure increased 4-HNE staining at all three time points, particularly at 4 and 8 wk, compared with the controls.
Fig. 6.
Immunohistochemical staining of cytochrome P-450 2E1 (CYP2E1) and hepatic 4-hydroxynonenal (4-HNE) in mouse liver. Mice were chronically fed with ethanol or control diet for 2, 4, or 8 wk. A: representative images of CYP2E1 immunostaining. Scale bar = 100 µm. B: representative images of 4-HNE immunostaining. Scale bar = 50 μm.
Treatment with 4-HNE or H2O2 altered expression of zinc transporters in murine FL-83B cells.
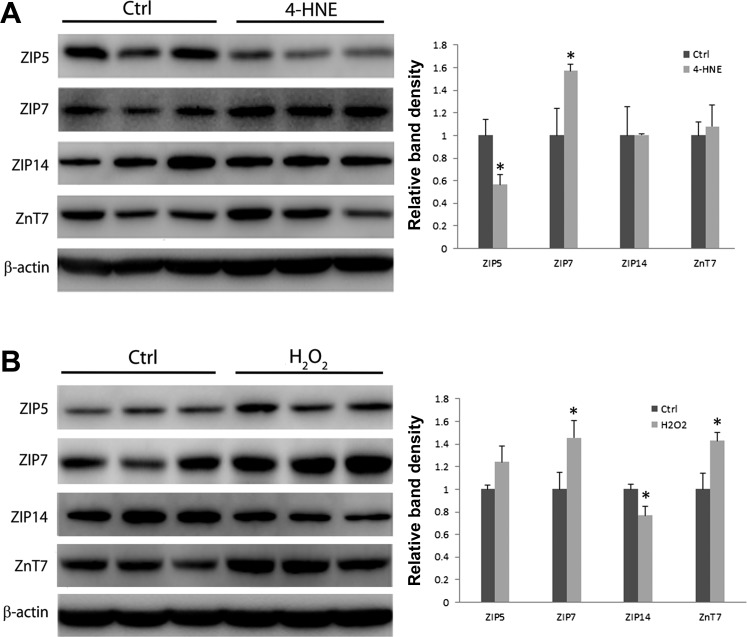
Oxidant molecules, 4-HNE and H2O2, are generated in association with ethanol metabolism. In order to determine if these cytotoxic molecules mediate ethanol-induced alterations of zinc transporters, murine FL-83B hepatocytes were treated with these molecules for 72 h. As shown in Fig. 7A, the treatment with 5 μM 4-HNE significantly decreased the protein levels of ZIP5, whereas increased ZIP7 protein level compared with the controls. The treatment with 100 μM H2O2 significantly increased the protein levels of ZIP7 and ZnT7 but remarkably decreased ZIP14 protein level compared with the control (Fig. 7B).
Fig. 7.
Effects of 4-HNE and hydrogen peroxide (H2O2) on the expression of ZIP5, ZIP7, ZIP14, and ZnT7 in murine FL-83B cells. FL-83B cells were treated with 5 μM 4-HNE or 100 μM H2O2 for 72 h. Four zinc transporters were analyzed by immunoblotting. The bands were quantified by densitometry analysis. A: immunoblotting of 4 zinc transporters by 4-HNE treatment. B: immunoblotting of 4 zinc transporters by H2O2 treatment. Results are expressed as means ± SD (n = 3). Significant differences (*P < 0.05) between control and treatment are determined by Student's t-test. Ctrl, control.
DISCUSSION
The present study demonstrated that chronic alcohol exposure disturbed zinc homeostasis as indicated by decreased hepatic zinc levels and increased plasma and urinary zinc levels. The alcohol-induced alteration in hepatic and urinary zinc levels from this study is consistent with previous reports (31, 38). However, controversial data on the effect of alcohol exposure on serum zinc levels have been reported from human studies. Decreased serum zinc levels have been shown in patients with alcoholic hepatitis and cirrhosis (31, 34, 37). Long-term alcohol exposure (16 wk) also reduces the plasma zinc levels in a mouse model of ALD. On the other hand, Hartoma et al. (10) reported that the serum zinc levels were elevated in alcoholic subjects with normal liver or fatty liver, while reduced serum zinc levels were found in patients with alcoholic hepatitis or cirrhosis. These clinical studies suggest that serum zinc levels could be elevated at an early stage of ALD, but decreased at advanced stage. In the mouse model of ALD showing reduced plasma zinc levels (17), the duration of alcohol exposure and dietary alcohol concentration were different from the present study. In that report, mice were exposed to ethanol for 16 wk, and the dietary ethanol content was increased to make up 30% of total calories. In the present study, the longest ethanol exposure time was 8 wk, and ethanol contributed to 28% of total calories, which generated a very early stage of alcoholic liver injury. These animal data also support the idea that plasma zinc levels may be increased at the early stage of alcoholic liver injury. Overall, all the observations suggest that zinc dyshomeostasis consistently exists in ALD, but the stage of ALD determines the redistribution pattern of zinc in body. In addition, plasma zinc level has been used as an indicator for dietary zinc deficiency (22). Our mouse model of ALD used a liquid diet containing adequate zinc, but this zinc-adequate liquid diet differentially affected plasma and liver zinc levels. These results suggest that plasma zinc level is not always a good indicator for assessing dietary zinc status and organ zinc status at different pathophysiological conditions.
Zinc participates in diverse physiological activities via binding to proteins; therefore decreased availability of zinc leads to inactivation of zinc proteins. The present study demonstrated that zinc proteins including PPAR-α, HNF-4α, and SOD1 were inactivated, and previous reports have shown that the suppression of the three proteins correlates to the pathogenesis of ALD (3, 5, 11, 18, 19, 32). This study also shows that alcohol exposure differentially affects PPAR-α, HNF-4α, and SOD1. While alcohol exposure reduced PPAR-α and HNF-4α protein levels, it did not affect the protein level of SOD1. However, the activity of SOD1 was significantly decreased by alcohol exposure for 2 wk. It is known that zinc does not coordinate to proteins with equal affinity (28, 30). Therefore, zinc proteins with lower zinc affinity will be affected by alcohol exposure at earlier time points. The data suggest that alcohol exposure-induced alteration of hepatic zinc levels may associate with zinc binding protein inactivation, which is manifested as decreased protein expressions or impaired protein activities.
Zinc transporters are major players in regulation of hepatic zinc homeostasis, but a whole picture of hepatic expression of zinc transporters is lacking. The present study first analyzed the expression of zinc transporter genes (14 ZIPs and 10 ZnTs) and found that 8 ZIP and 6 ZnT genes are relatively abundant in the liver. Then the protein levels of these abundant zinc transporters were further analyzed. Among the 14 zinc transporter proteins measured by immunoblotting, we detected 7 ZIP proteins and 5 ZnT proteins in the liver. However, ZIP9 and ZnT5 proteins were not detected, probably due to the limit of either antibody reactivity or the protein expression levels. Moreover, the results of mRNA and protein indicate that different zinc transporters might undergo various regulations. According to the results, we conclude that ZIP5 and ZnT1 might be regulated at the transcriptional level, but ZIP7, ZIP8, ZIP13, ZIP14, ZnT4, ZnT6, and ZnT7 might undergo a posttranscriptional regulation, among which, ZIP7, ZIP8, ZIP13, ZnT4, ZnT6 and ZnT7 might have a stabilized protein life, and ZIP14 might undergo degradation process.
The altered expression of hepatic zinc transporters by ethanol exposure may lead to zinc dyshomeostasis in liver. Beker Aydemir et al. (1) showed that ZIP14 was located on the plasma membrane of hepatocytes, and increased level of ZIP14 could sequester zinc from plasma into liver under infection. The ZIP5 protein is predicted to be located on plasma membrane of hepatocyte as well. Therefore, decreased ZIP5 and ZIP14 protein abundance by ethanol exposure may be the cause of decreased zinc levels in the liver. The ZIP7 and ZnT7 were reported located on organelles, such as ER and Golgi apparatus (23, 36). It is well known that ER stress is accompanied with alcohol abuse (14, 15). Previous studies indicate that zinc deficiency (8) or dysregulation of zinc transporters in ER (9) would induce ER stress in Saccharomyces cerevisiae and Drosophila. Therefore, altered expression of these zinc transporters might not only cause organelle zinc dyshomeostasis but also lead to organelle dysfunction. Collectively, ethanol may alter the expression of zinc transporters through distinctive, translational or posttranslational, regulatory mechanisms. Furthermore, dysregulated zinc transporters might lead to organelle zinc dyshomeostasis and dysfunction of the organelles.
Oxidative stress is a feature of ALD. The present study demonstrates the induction of CYP2E1 and the generation of lipid peroxidation product, 4-HNE, in the liver occurred as early as the second week of alcohol exposure. Immunohistochemical staining of ZIP5, ZIP7, and ZnT7 suggested that altered expression of the zinc transporters is spatially correlated with the expression of CYP2E1 and 4-HNE. In order to demonstrate the causal relationship between oxidative stress and zinc transporters, H2O2, one of the ROS generated by CYP2E1 (27), and 4-HNE were selected for in vitro study. We observed that 5 μM 4-HNE significantly decreased protein abundance of ZIP5 and increased the protein abundance of ZIP7. We also found that 100 μM H2O2 remarkably reduced production of ZIP14 protein and elevated the production of ZIP7 and ZnT7 proteins. These results indicate that the effects of alcohol on zinc transporters may be mediated by the oxidative molecules, which are generated in association with alcohol metabolism. The results also indicate that different oxidative molecules may not affect zinc transporters in the same way. The ZIP7 protein was affected by both H2O2 and 4-HNE treatment, suggesting that ZIP7 was susceptible to oxidative stress. We assume that oxidative stress induced by ethanol metabolism might directly affect the zinc transporters at transcriptional levels or/and enhance its stabilization or degradation at protein levels, but we do not exclude that oxidative stress may indirectly cause alteration of the zinc transporters. Maret et al. (28) suggested that oxidants might induce zinc dissociation from zinc proteins and concurrently alter the availability of zinc ion. Consequently, altered labile zinc would affect the expression of zinc transporters by upregulation or downregulation of zinc sensing transcription factors, such as metal response element-binding transcription factor (MTF-1) (12, 24). However, the precise molecular mechanisms have not been defined. The current study provides solid evidence that oxidative stress could affect the expression of zinc transporters. Therefore, a combined dietary intervention with antioxidant and zinc might produce a better improvement in alcohol-induced zinc deficiency and liver injury.
In summary, ethanol-induced hepatic zinc reduction occurred as early as the second week of ethanol exposure in mice. Accompanying that, zinc proteins were affected either by decreased expression at protein levels (PPAR-α and HNF-4α) or impaired activity (SOD1). Zinc transporter screening detected 23 (except ZnT2) of 24 zinc transporters at mRNA levels in the mouse liver. Among the zinc transporters with relative abundant gene expression, 12 zinc transporters were detected at protein levels, for the first time, in the mouse liver. Alcohol exposure consistently affected the protein levels of 4 zinc transporters (ZIP5, ZIP7, ZIP14 and ZnT7) of 12 zinc transporters tested. The results from in vitro study demonstrated that the protein levels of ZIP5, ZIP7, ZIP14, and ZnT7 were affected by 4-HNE and H2O2. These results demonstrated that hepatic zinc transporters are remarkably altered by alcohol abuse via an oxidative stress-dependent mechanism, which might account for alcohol-induced hepatic zinc deficiency.
GRANTS
This research was supported by National Institutes of Health Grants R01AA1020212 and R01AA1018844.
DISCLOSURES
No conflicts of interest, financial or otherwise, are declared by the author(s).
AUTHOR CONTRIBUTIONS
Author contributions: Q.S. and Z.Z. conception and design of research; Q.S., Q.L., W.Z., J.Z., Xiuhua Sun, X.T., X.Y., Xinguo Sun, and X.Z. performed experiments; Q.S. analyzed data; Q.S. and Z.Z. interpreted results of experiments; Q.S. prepared figures; Q.S. drafted manuscript; Q.S., Q.L., W.Z., Xiuhua Sun, X.T., and Z.Z. edited and revised manuscript; Q.S., Q.L., W.Z., J.Z., Xiuhua Sun, X.T., X.Y., Xinguo Sun, X.Z., and Z.Z. approved final version of manuscript.
REFERENCES
- 1.Beker Aydemir T, Chang SM, Guthrie GJ, Maki AB, Ryu MS, Karabiyik A, Cousins RJ. Zinc transporter ZIP14 functions in hepatic zinc, iron and glucose homeostasis during the innate immune response (endotoxemia). PLoS One 7: e48679, 2012 [DOI] [PMC free article] [PubMed] [Google Scholar]
- 2.Bode JC, Hanisch P, Henning H, Koenig W, Richter FW, Bode C. Hepatic zinc content in patients with various stages of alcoholic liver disease and in patients with chronic active and chronic persistent hepatitis. Hepatology 8: 1605–1609, 1988 [DOI] [PubMed] [Google Scholar]
- 3.Crabb DW, Galli A, Fischer M, You M. Molecular mechanisms of alcoholic fatty liver: role of peroxisome proliferator-activated receptor alpha. Alcohol 34: 35–38, 2004 [DOI] [PubMed] [Google Scholar]
- 4.Cummings JE, Kovacic JP. The ubiquitous role of zinc in health and disease. J Vet Emerg Crit Care (San Antonio) 19: 215–240, 2009 [DOI] [PubMed] [Google Scholar]
- 5.Curry-McCoy TV, Osna NA, Nanji AA, Donohue TM., Jr Chronic ethanol consumption results in atypical liver injury in copper/zinc superoxide dismutase deficient mice. Alcohol Clin Exp Res 34: 251–261, 2010 [DOI] [PubMed] [Google Scholar]
- 6.Desouki MM, Geradts J, Milon B, Franklin RB, Costello LC. hZip2 and hZip3 zinc transporters are down regulated in human prostate adenocarcinomatous glands. Mol Cancer 6: 37, 2007 [DOI] [PMC free article] [PubMed] [Google Scholar]
- 7.Devirgiliis C, Zalewski PD, Perozzi G, Murgia C. Zinc fluxes and zinc transporter genes in chronic diseases. Mutat Res 622: 84–93, 2007 [DOI] [PubMed] [Google Scholar]
- 8.Ellis CD, Wang F, MacDiarmid CW, Clark S, Lyons T, Eide DJ. Zinc and the Msc2 zinc transporter protein are required for endoplasmic reticulum function. J Cell Biol 166: 325–335, 2004 [DOI] [PMC free article] [PubMed] [Google Scholar]
- 9.Groth C, Sasamura T, Khanna MR, Whitley M, Fortini ME. Protein trafficking abnormalities in Drosophila tissues with impaired activity of the ZIP7 zinc transporter Catsup. Development 140: 3018–3027, 2013 [DOI] [PMC free article] [PubMed] [Google Scholar]
- 10.Hartoma TR, Sotaniemi EA, Pelkonen O, Ahlqvist J. Serum zinc and serum copper and indices of drug metabolism in alcoholics. Eur J Clin Pharmacol 12: 147–151, 1977 [DOI] [PubMed] [Google Scholar]
- 11.Hayhurst GP, Lee YH, Lambert G, Ward JM, Gonzalez FJ. Hepatocyte nuclear factor 4alpha (nuclear receptor 2A1) is essential for maintenance of hepatic gene expression and lipid homeostasis. Mol Cell Biol 21: 1393–1403, 2001 [DOI] [PMC free article] [PubMed] [Google Scholar]
- 12.Hogstrand C, Zheng D, Feeney G, Cunningham P, Kille P. Zinc-controlled gene expression by metal-regulatory transcription factor 1 (MTF1) in a model vertebrate, the zebrafish. Biochem Soc Trans 36: 1252–1257, 2008 [DOI] [PubMed] [Google Scholar]
- 13.Jayaraman AK, Jayaraman S. Increased level of exogenous zinc induces cytotoxicity and up-regulates the expression of the ZnT-1 zinc transporter gene in pancreatic cancer cells. J Nutr Biochem 22: 79–88, 2011 [DOI] [PubMed] [Google Scholar]
- 14.Ji C, Kaplowitz N. Betaine decreases hyperhomocysteinemia, endoplasmic reticulum stress, and liver injury in alcohol-fed mice. Gastroenterology 124: 1488–1499, 2003 [DOI] [PubMed] [Google Scholar]
- 15.Ji C, Kaplowitz N. Hyperhomocysteinemia, endoplasmic reticulum stress, and alcoholic liver injury. World J Gastroenterol 10: 1699–1708, 2004 [DOI] [PMC free article] [PubMed] [Google Scholar]
- 16.Kahn AM, Helwig HL, Redeker AG, Reynolds TB. Urine and serum zinc abnormalities in disease of the liver. Am J Clin Pathol 44: 426–435, 1965 [DOI] [PubMed] [Google Scholar]
- 17.Kang X, Zhong W, Liu J, Song Z, McClain CJ, Kang YJ, Zhou Z. Zinc supplementation reverses alcohol-induced steatosis in mice through reactivating hepatocyte nuclear factor-4alpha and peroxisome proliferator-activated receptor-alpha. Hepatology 50: 1241–1250, 2009 [DOI] [PMC free article] [PubMed] [Google Scholar]
- 18.Kersten S, Seydoux J, Peters JM, Gonzalez FJ, Desvergne B, Wahli W. Peroxisome proliferator-activated receptor alpha mediates the adaptive response to fasting. J Clin Invest 103: 1489–1498, 1999 [DOI] [PMC free article] [PubMed] [Google Scholar]
- 19.Kessova IG, Ho YS, Thung S, Cederbaum AI. Alcohol-induced liver injury in mice lacking Cu, Zn-superoxide dismutase. Hepatology 38: 1136–1145, 2003 [DOI] [PubMed] [Google Scholar]
- 20.Kiilerich S, Dietrichson O, Loud FB, Naestoft J, Christoffersen P, Juhl E, Kjems G, Christiansen C. Zinc depletion in alcoholic liver diseases. Scand J Gastroenterol 15: 363–367, 1980 [DOI] [PubMed] [Google Scholar]
- 21.King JC. Zinc: an essential but elusive nutrient. Am J Clin Nutr 94: 679S–684S, 2011 [DOI] [PMC free article] [PubMed] [Google Scholar]
- 22.King JC, Shames DM, Woodhouse LR. Zinc homeostasis in humans. J Nutr 130: 1360S–1366S, 2000 [DOI] [PubMed] [Google Scholar]
- 23.Kirschke CP, Huang L. ZnT7, a novel mammalian zinc transporter, accumulates zinc in the Golgi apparatus. J Biol Chem 278: 4096–4102, 2003 [DOI] [PubMed] [Google Scholar]
- 24.Langmade SJ, Ravindra R, Daniels PJ, Andrews GK. The transcription factor MTF-1 mediates metal regulation of the mouse ZnT1 gene. J Biol Chem 275: 34803–34809, 2000 [DOI] [PubMed] [Google Scholar]
- 25.Lichten LA, Cousins RJ. Mammalian zinc transporters: nutritional and physiologic regulation. Annu Rev Nutr 29: 153–176, 2009 [DOI] [PubMed] [Google Scholar]
- 26.Lopez V, Kelleher SL. Zip6-attenuation promotes epithelial-to-mesenchymal transition in ductal breast tumor (T47D) cells. Exp Cell Res 316: 366–375, 2010 [DOI] [PubMed] [Google Scholar]
- 27.Lu Y, Cederbaum AI. CYP2E1 and oxidative liver injury by alcohol. Free Radic Biol Med 44: 723–738, 2008 [DOI] [PMC free article] [PubMed] [Google Scholar]
- 28.Maret W, Li Y. Coordination dynamics of zinc in proteins. Chem Rev 109: 4682–4707, 2009 [DOI] [PubMed] [Google Scholar]
- 29.McClain CJ, Antonow DR, Cohen DA, Shedlofsky SI. Zinc metabolism in alcoholic liver disease. Alcohol Clin Exp Res 10: 582–589, 1986 [DOI] [PubMed] [Google Scholar]
- 30.Mocchegiani E, Muzzioli M, Cipriano C, Giacconi R. Zinc, T-cell pathways, aging: role of metallothioneins. Mech Ageing Dev 106: 183–204, 1998 [DOI] [PubMed] [Google Scholar]
- 31.Mohammad MK, Zhou Z, Cave M, Barve A, McClain CJ. Zinc and liver disease. Nutr Clin Pract 27: 8–20, 2012 [DOI] [PMC free article] [PubMed] [Google Scholar]
- 32.Nagy LE. Molecular aspects of alcohol metabolism: transcription factors involved in early ethanol-induced liver injury. Annu Rev Nutr 24: 55–78, 2004 [DOI] [PubMed] [Google Scholar]
- 33.Rodriguez-Moreno F, Gonzalez-Reimers E, Santolaria-Fernandez F, Galindo-Martin L, Hernandez-Torres O, Batista-Lopez N, Molina-Perez M. Zinc, copper, manganese, and iron in chronic alcoholic liver disease. Alcohol 14: 39–44, 1997 [DOI] [PubMed] [Google Scholar]
- 34.Schwartz JM, Reinus JF. Prevalence and natural history of alcoholic liver disease. Clin Liver Dis 16: 659–666, 2012 [DOI] [PubMed] [Google Scholar]
- 35.Solomons NW. Update on zinc biology. Ann Nutr Metab 62, Suppl 1: 8–17, 2013 [DOI] [PubMed] [Google Scholar]
- 36.Taylor KM, Morgan HE, Johnson A, Nicholson RI. Structure-function analysis of HKE4, a member of the new LIV-1 subfamily of zinc transporters. Biochem J 377: 131–139, 2004 [DOI] [PMC free article] [PubMed] [Google Scholar]
- 37.Wu CT, Lee JN, Shen WW, Lee SL. Serum zinc, copper, and ceruloplasmin levels in male alcoholics. Biol Psychiatry 19: 1333–1338, 1984 [PubMed] [Google Scholar]
- 38.Zhou Z, Wang L, Song Z, Saari JT, McClain CJ, Kang YJ. Zinc supplementation prevents alcoholic liver injury in mice through attenuation of oxidative stress. Am J Pathol 166: 1681–1690, 2005 [DOI] [PMC free article] [PubMed] [Google Scholar]


