Abstract
It is well-known that respiratory activity influences electrocardiographic (ECG) morphology. In this article we present a new algorithm for the extraction of respiratory rate from either intracardiac or body surface electrograms. The algorithm optimizes selection of ECG leads for respiratory analysis, as validated in a swine model. The algorithm estimates the respiratory rate from any two ECG leads by finding the power spectral peak of the derived ratio of the estimated root-mean-squared amplitude of the QRS complexes on a beat-by-beat basis across a 32-beat window and automatically selects the lead combination with the highest power spectral signal-to-noise ratio. In 12 mechanically ventilated swine, we collected intracardiac electrograms from catheters in the right ventricle, coronary sinus, left ventricle, and epicardial surface, as well as body surface electrograms, while the ventilation rate was varied between 7 and 13 breaths/min at tidal volumes of 500 and 750 ml. We found excellent agreement between the estimated and true respiratory rate for right ventricular (R2 = 0.97), coronary sinus (R2 = 0.96), left ventricular (R2 = 0.96), and epicardial (R2 = 0.97) intracardiac leads referenced to surface lead ECGII. When applied to intracardiac right ventricular-coronary sinus bipolar leads, the algorithm exhibited an accuracy of 99.1% (R2 = 0.97). When applied to 12-lead body surface ECGs collected in 4 swine, the algorithm exhibited an accuracy of 100% (R2 = 0.93). In conclusion, the proposed algorithm provides an accurate estimation of the respiratory rate using either intracardiac or body surface signals without the need for additional hardware.
Keywords: respiratory rate, estimation, intracardiac, body surface, electrograms, minute ventilation
measurement of respiratory rate (RR) is an integral component of patient monitoring and disease management in a number of clinical settings including ambulatory care (8, 23), emergency rooms (10), postoperative care (1, 9), and intensive care units (5).
For patients in a hospital setting, measurement of RR can be accomplished either directly or indirectly, using a number of different methods. Nasal thermocouples (12, 15) and spirometers (4) directly measure air flow into and out of the lungs. Pulse oximetry (14, 28), transthoracic inductance (30), impedance plethysmographs (2, 13), pneumatic respiration transducers (19), and whole body plethysmographs (6, 23, 24, 28, 29) indirectly monitor RR by measuring body volume changes.
Common to all of these methods is the use of specialized hardware that is dedicated to RR monitoring, a feature that is not often practical and convenient in an emergency setting or for the free-moving, ambulatory patient. Assessment of the RR is important in the ambulatory monitoring of many diseases, including chronic obstructive pulmonary disease (7), sudden infant death syndrome (26), and Cheyne-Stokes respiration (CSR) in heart failure (25). In particular, CSR is a form of sleep-disordered breathing in which crescendo-decrescendo alterations in tidal volume are separated by periods of apnea and hypopnea (25). CSR has been identified in up to 40% of patients with chronic heart failure and has been associated with cardiac dysrhythmias including atrioventricular block (11) and ventricular ectopy (18). Additionally, CSR is a marker of worse prognosis and increased mortality in patients with heart failure and improvements in CSR might serve as a positive marker of response to heart failure medical therapy (25). These clinical observations exemplify the complex interplay among the respiratory, cardiovascular, and autonomic systems and highlight the need for tools to monitor respiratory and cardiovascular parameters in ambulatory patients with heart failure.
Previous studies have estimated the RR by extracting parameters of the respiratory signal from ECG signals (3, 19, 21, 22). These studies utilized signal processing techniques to assess the impact of changes in air flow or body volume on the ECG signal and estimate the RR. Such an approach could be highly desirable in situations when the respiratory activity is impractical to monitor but the ECG is recorded, e.g., during a 24-h Holter ambulatory recording. However, these studies reported a 6% error in the estimated vs. measured RR, using spirometery as a gold standard (3) or an average correlation of 80% between the estimated respiration signal and a chest-belt respiration sensor (22). An additional limitation of these methods is that they require a priori selection of the ECG leads to be used for estimation of RR and these selections cannot change once the estimation has started. This issue becomes especially problematic in the case of an implantable device (i.e., pacemaker or defibrillator) where the intracardiac electrograms (EGMs) could be used to estimate RR but it is often unclear which EGM configurations will provide the most accurate estimation of the RR.
Therefore, we present a novel ECG-derived algorithm that automatically selects the optimal lead configuration to optimize the RR estimation. We use a porcine model to test the hypothesis that this novel algorithm can be used to reliably estimate RR from both intracardiac EGMs and body surface ECGs. The findings of this study have important implications for monitoring respiratory parameters in patients with implantable cardiac devices and ambulatory patients during routine cardiac monitoring.
METHODS
Animal preparation.
Twelve male Yorkshire swine (40–45 kg) were anesthetized and acutely instrumented in the Animal Electrophysiology Laboratory of the Massachusetts General Hospital. This investigation conformed with the Guide for the Care and Use of Laboratory Animals published by the US National Institutes of Health (NIH Publication No. 85–23, revised 1996) and used protocols approved by the Massachusetts General Hospital Animal Care and Use Committee.
Anesthesia was induced with telazol (4.4 mg/kg im) and xylazine (2.2 mg/kg im). Each animal was intubated and placed on a mechanical ventilator, and anesthesia was maintained with isoflurane (1.5–5%).
Percutaneous access was achieved by inserting standard angiographic sheaths into the femoral arteries and veins using Seldinger technique (27, 32). Decapolar catheters were placed under fluoroscopic guidance in the right ventricle (RV; the distal lead being in the RV apex), coronary sinus (CS; the distal lead being in the distal CS), left ventricle (LV; the proximal lead being in the LV apex), and the ventricular epicardial space (EPI). Epicardial access was achieved utilizing a standard subxyphoid percutaneous approach (as it is typically clinically performed in humans) (31). Briefly, a sheath was placed into the pericardial space using a Tuohy needle. Then, the catheter was maneuvered into the space through this sheath. Finally, an inferior vena cava catheter was inserted as a reference electrode for unipolar signals and the actual locations of the catheters were verified by 2D X-ray views of the heart. Standard electrocardiographic (ECG) electrodes were placed on the animal's limbs and chest.
Data recording equipment.
Body surface ECG and intracardiac EGM signals were recorded through a Prucka Cardiolab (Generic Electric) electrophysiology system that provided 16 high-fidelity analog output signals and front-end signal conditioning. Body surface signals were band-pass filtered 0.05–100 Hz, with a 60-Hz notch filter and gain 2,500 V/V, and intracardiac signals were band-pass filtered 0.05–500 Hz, with 60-Hz notch filter and gain 250 V/V.
We have recently developed a state-of-the-art signal acquisition, display, and processing system that supports the acquisition, display, and real-time analysis of all 16 Prucka output signals, sampled at 1,000 Hz by a multichannel 16-bit data acquisition card (National Instruments M-Series PCI6255, Austin, TX). This system consists of custom software written in LabView 8.5 (National Instruments) and MATLAB 7.6 (MathWorks, Natick, MA). This system was modified to estimate and display the RR in real-time using either body surface ECG and/or intracardiac EGM signals.
A respiratory monitor (Surgivet V9004) was used as the gold standard to measure the RR throughout each respiratory intervention. This monitor has an accuracy of ±1 breath/min and functions as follows: each respiration event is detected at the leading edge (upswing) of the CO2 waveform; next, each set of four consecutive breaths is averaged using box-car averaging; finally, the RR is rounded down and displayed by the unit.
Data collection.
For each mechanically ventilated animal, body surface, and intracardiac EGMs were recorded while the ventilation rate was stepped from 13 to 7 breaths/min at tidal volumes of 500 and 750 ml. Each ventilation rate was maintained for a minimum of 90 s.
In the intracardiac recording configuration, EGM signals were recorded from two body surface leads (lead II and V4) and 12 intracardiac unipolar leads, including three leads from the RV catheter (RV1, RV2, and RV7, where “1” is the most distal electrode), three leads from the CS catheter (CS1, CS2, and CS7), three leads from the LV catheter (LV1, LV2, and LV9), and three leads from the EPI catheter (EPI1, EPI2, and EPI9). All unipolar leads were referenced to the same lead in the inferior vena cava catheter. Bipolar intracardiac leads were reconstructed by subtracting pairs of unipolar leads, including four far-field bipolar leads (RV71, CS71, LV91, and EPI91), four near-field bipolar leads (RV21, CS21, LV21, and EPI21), and two intercatheter bipolar leads (RV1CS1 and RV1CS7). A set of intracardiac recordings was collected in 8 animals, and a set of 12-lead body surface ECG recordings was collected in 4 animals.
Development of an ECG-derived respiration surrogate.
The mean cardiac axis represents the net direction and magnitude of electromechanical contraction force produced by the depolarization and repolarization of cardiac tissue. The apex of the heart is stretched towards the abdomen during inspiration and compressed towards the breast during expiration. These movements during the respiratory cycle together with the movement of the chest and the changes in thorax impedance due to filling and empting of the lungs contribute to a rotation of the cardiac electrical axis, which affects heartbeat morphology. We proposed to estimate the mean cardiac axis on a beat-by-beat basis and derive the RR from this signal as the mean cardiac axis changes throughout the respiratory cycle (19).
To obtain the angle of the mean cardiac axis with respect to one of the lead axes, the arctangent of the ratio of QRS amplitudes from two orthogonal ECG leads should be calculated. However, it is impractical to select orthogonal intracardiac leads, both because the identification of orthogonal leads is very difficult, even under fluoroscopy, and because lead motion may cause the angle between two leads to change as a function of respiration or posture. In addition, not only the mean cardiac axis but also the thoracic impedance changes as a function of respiration, such that the angle of the mean cardiac axis is not perfectly described by the arctangent of the ratios of orthogonal leads. Therefore, we attempted to develop a method that could accurately and reliably estimate the respiration rate from an optimal lead combination without first verifying the orthogonality of the lead combination and without calculating the arctangent of the QRS ratios.
ECG-derived RR.
We obtained preliminary R-wave annotations by applying a software-based QRS detection algorithm to surface EGM lead V4. Then, preliminary QRS detections were refined and abnormal beats, e.g., premature ventricular complexes and aberrantly conducted beats, were identified using a template-matching QRS alignment algorithm (30).
Briefly, for each ECG beat, an 80-ms window centered at the peak of the QRS complex was formed from the preliminary R-wave detection. An isoelectric PR segment was subtracted as a zero amplitude reference point (by estimating the mean voltage in a 10-ms window preceding the start of each QRS complex). Then, a median QRS template was generated from the previous 7 “normal” QRS complexes, and the current beat was time aligned to the QRS template using cross-correlation. Cross-correlation was repeated twice for each new QRS complex to ensure the refined R-wave is found at the peak of the QRS complex. A beat was considered “abnormal” if its correlation coefficient was less than a threshold value of 0.95 or if the preceding R-to-R interval changed (either shortened or prolonged) >10% of the mean R-to-R interval of the previous seven beats (31).
Next, we calculated the root-mean-squared (RMS) amplitude of each normal (determined by cross-correlation and the R-to-R interval criteria) beat for all leads on a beat-by-beat basis using an 80-ms window centered at the QRS complex. The RMS amplitudes for all abnormal beats were generated from neighboring RMS amplitudes using cubic-spline interpolation. By replacing aberrant beats with interpolated points, rather than the RMS values of the average good beats, we minimized discontinuities in the RMS ratio sequence before spectral analysis. Next, we selected a lead pair combination and calculated the respirophasic signal as the RMS signal ratio on a beat-by-beat basis. Each lead pair combination consisted of a test lead (the numerator) and a reference lead (the denominator).
Thereafter, we estimated the power spectrum in a window (with a predefined number of beats ranging from 16 to 512 beats) of RMS ratio data using a 512-length Fourier transform to improve the frequency-domain resolution. The resulting frequency axis, in respiration cycles/beat (range: 0–0.5 cycles/beat), was converted to respirations per minute by scaling the axis by the average heart rate across the predefined beat-number window. The dominant power spectral peak between 5 and 35 breaths/min was detected, corresponding to the detected RR.
Optimized RR estimation.
When determining the optimal lead combination for RR detection, we identified the lead combination with the largest spectral signal-to-noise ratio (SNR), which we defined as the spectral peak power divided by the median of the power spectrum from 0 to 0.5 cycles/beat, expressed in decibels:
This method provides one sample of the ECG-derived respiration per cardiac cycle. Given that the heart rate is almost always greater than twice the RR, the RR can be measured well from this limited set of samples.
RESULTS
Results are reported as means ± SD, unless it is noted otherwise.
Determination of the optimal beat window length.
We first sought to determine the optimal number of beats on which to perform Fourier transform analysis (the beat window) that would maximize the accuracy and minimize the latency required to estimate the RR.
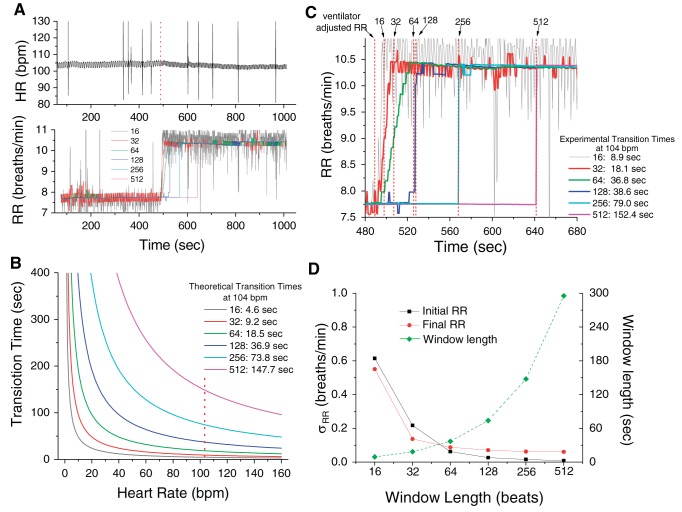
In Fig. 1A, we show the heart rate and respiration rate of a recording in which the ventilator's rate was changed from 7 to 10 breaths/min, 489 s after the beginning of the recording (the dotted line indicates the timing of the change in the ventilator rate). We estimated the RR using a 16-, 32-, 64-, 128-, 256-, and 512-beat window. In Fig. 1B, we present the theoretical estimation of the transition time required for each of the 16-, 32-, 64-, 128-, 256- and 512-beat windows to reach a new rate (window length in beats × 60/heart rate in beats/min/2). Given that at 489 s the instantaneous heart rate was 104 beats/min, the theoretical transition times were 4.6, 9.2, 18.5, 36.9, 73.8, and 147.7 s, respectively (the dotted vertical line indicates 104 beats/min). In Fig. 1C, we present the estimated RR plotted as a function of time; the data are fitted with the Boltzmann equation (y = A2 + (A1 − A2)/{1 + exp[(x − xo)/dx]}), where A1 and A2 represent the minimum and maximum RR, respectively; xo represents the time to half maximum RR; and dx represents the slope of the exponential function) to obtain the experimental transition times (at xo+ 4dx) of 8.9, 18.1, 36.6, 38.8, 79.0, and 152.4 s, respectively. We observe that the theoretical transition times predicted in Fig. 1B are in excellent agreement with the estimated values of Fig. 1C. In Fig. 1D, we show the standard deviation of the RR estimates using a 16-, 32-, 64-, 128-, 256-, and 512-beat window (left axis); we also show the window length (in time). We observe that for RR estimation error of <1 breath/min, the 32-beat window provides an uncertainty that is <0.5 beats/min; Thus, although the RR estimation error is smaller with a larger size window, the benefit of the increased accuracy is not substantial enough to justify the more than doubling of the number of beats required to correctly estimate the RR. Therefore, in the remainder of this study we use a 32-beat window.
Fig. 1.
Selection of the optimal beat window. A: respiratory rate (RR) and heart rate (HR) are plotted as a function time (note a change of the ventilator rate at 489 s); the RR is estimated using a 16 (gray line)-, 32 (red line)-, 64 (green line)-, 128 (dark blue line)-, 256 (light blue line)-, and 512 (pink line)-beat window. Dotted line indicates the timing of the change in the ventilator rate. B: theoretical estimation of the transition time required for each of the 16-, 32-, 64-, 128-, 256-, and 512-beat window to reach a new rate (window length in beats × 60/HR in beats/min/2). Given that at 489 s the instantaneous HR was 104 beats/min, the theoretical transition times were 4.6, 9.2, 18.5, 36.9, 73.8, and 147.7 s, respectively. Dotted line indicates the 104 beats/min. C: average (across leads) RR plotted as a function of time; the data were fitted with the Boltzmann equation (y = A2 + (A1 − A2)/{1 + exp[(x − xo)/dx]}) to obtain the experimental transition times presented in the same panel and indicated by the dotted lines. D: SD of initial (black square) and final (red circle) RR estimates of A, using a 16-, 32-, 64-, 128-, 256-, and 512-beat window (left axis). The window length in beats (green diamond) is also plotted (right axis); bpm, beats/min.
Algorithm demonstration.
To examine the ability of our algorithm (without the optimization step) to accurately estimate the RR, we performed a series of experiments in which the ventilator rate was adjusted in either a step-down or step-up fashion from 7 to 13 breaths/min. The respiratory monitor output (as displayed on the monitor screen) was recorded throughout each experiment to serve as the gold standard to evaluate our algorithm's accuracy during time intervals at which the RR was held constant.
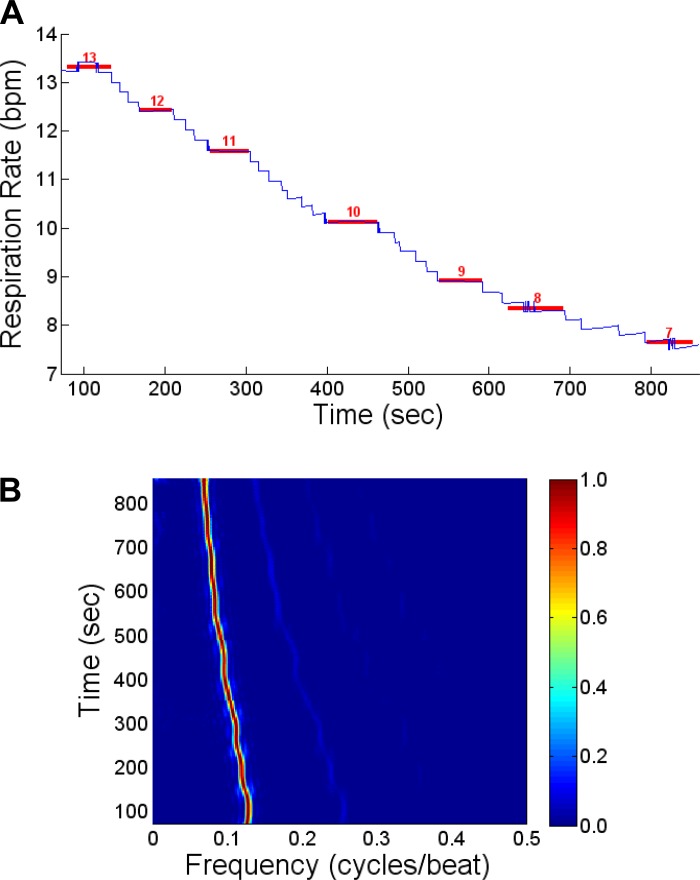
In Fig. 2A, we show a representative example of this process, in which the ventilator was stepped down from 13 to 7 breaths/min. The blue line indicates the estimated RR (here using the most distal CS lead, CS1, referenced to ECG lead II) throughout the time course of the recording, while the red lines show the RR reported by the respiratory monitor during the time intervals at which the RR is held steady and the algorithm reports a constant RR. This process was repeated for all leads in each study.
Fig. 2.
A: an example of the RR detection, using the root-mean-squared (RMS) signal ratio of coronary sinus lead 1 and electrocardiographic lead II (CS1/ECG II). The blue curve represents the estimated RR using our algorithm through the time course of this study. The red lines represent the RR reported by the respiratory monitor during each interval (indicated by the length of the red line) employed for the estimation of the RR. B: normalized power spectrum (in cycles/beat) as a function of time during the step down transition of the ventilation rate, from 13 to 7 breaths/min, for the data from A. There is a clear peak in the spectrum at a rate that decreases as a function of time as the ventilation rate decreases from 13 to 7 breaths/min.
In Fig. 2B, we show the normalized power spectrum (in cycles/beat) as a function of time during the step down transition of the ventilator's rate from 13 to 7 breaths/min. We see that there is a clear peak at 0.128 cycles/beat (at a heart rate of 104 beats/min) in the spectrum corresponding to 13 breaths/min, which progressively moves with every new ventilator RR setting to a final peak of 0.067 cycles/beat at 860 s, corresponding to an RR of 7 breaths/min.
Estimation of RR using intracardiac leads.
We next examined the ability of the algorithm (without the optimization step) to estimate the RR using unipolar, far-field bipolar, near-field bipolar, and RV-CS intracardiac leads. For this analysis, each intracardiac lead (numerator) was referenced to body surface ECG lead II (denominator) to maximize the potential for ratiometric lead orthogonality. The absolute error and percentage of missed detections using each intracardiac lead configuration were calculated for each animal across all ventilation rates, from 13 to 7 breaths/min, at tidal volumes of 500 and 750 ml.
The absolute error was calculated as the average absolute difference between the estimated and true RR. A missed detection was defined as an RR detection in which the estimated RR differed from the true RR by >1 breath/min (the accuracy of the respiration monitor), that is,  estimated RR − true RR
 > 1. Because the respiratory monitor rounds each RR down to the nearest integer, each estimated RR was also rounded down to the nearest integer before absolute error and missed detection calculation. The nonparametric Friedman's test was used to compare the differences between the tidal volumes of 500 and 750 ml across leads (P < 0.05 indicated statistical significance).
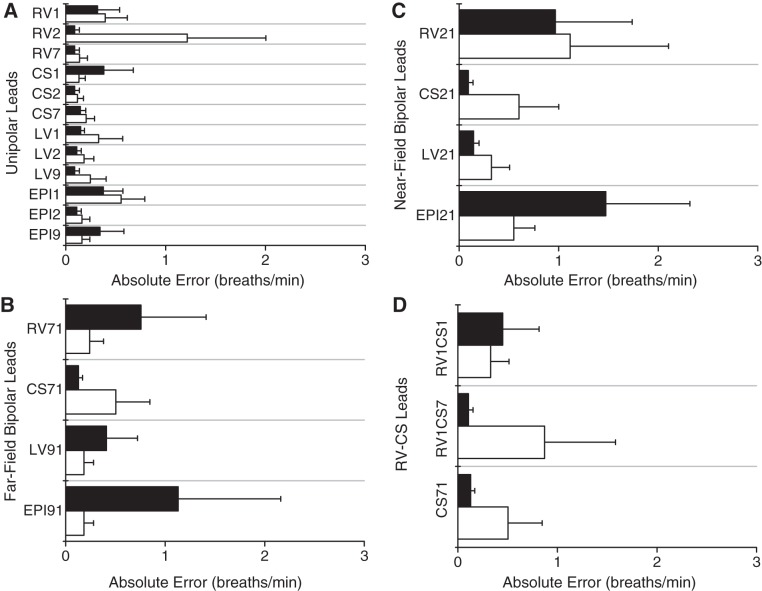
In Fig. 3, we show the absolute error for each lead at tidal volumes of 500 and 750 ml, averaged across all animals, for unipolar leads (Fig. 3A), far-field bipolar leads (Fig. 3B), near-field bipolar leads (Fig. 3C), and RV-CS intercatheter leads (Fig. 3D). No statistically significant difference of the error was found between tidal volumes of 500 and 750 ml for any intracardiac lead, and no statistically significant difference was found between any two far-field bipolar, any two near-field bipolar, or any two RV-CS leads, respectively.
Fig. 3.
Absolute error (means ± SD) for each intracardiac lead at tidal volumes of 500 (in white) and 750 ml (in black), averaged across all animals, for unipolar leads (A), far-field bipolar leads (B), near-field bipolar leads (C), and for right ventricle and coronary sinus (RV-CS) intracatheter leads (D). No statistically significant difference was found between tidal volumes of 500 and 750 ml for any intracardiac lead, and no statistically significant difference was found between any 2 far-field bipolar, any 2 near-field bipolar, or any 2 RV-CS leads, respectively. A: unipolar absolute error ranges from 0.09 to 1.22 breaths/min, with mean of 0.26 breaths/min. B: far-field bipolar absolute error ranges from 0.13 to 1.13 breaths/min, with mean of 0.44 breaths/min. C: near-field bipolar absolute error ranges from 0.09 to 1.47 breaths/min, with mean of 0.66 breaths/min. D: RV-CS bipolar absolute error ranges from 0.11 to 0.87 breaths/min, with mean of 0.40 breaths/min. As shown by the small absolute errors in all intracardiac lead configurations, the algorithm closely tracks the true RR across a wide range of intracardiac leads when referenced to body surface ECG lead II. LV, left ventricle; EPI, epicardial space.
In Fig. 3A, we observe that the absolute error for unipolar leads has a range of 0.09–1.22 breaths/min, with a mean of 0.26 breaths/min. In Fig. 3B, we observe that the absolute error for far-field bipolar leads has a range of 0.13–1.13 breaths/min, with a mean of 0.44 breaths/min. Figure 3C demonstrates that the absolute error for near-field bipolar leads has a range of 0.09–1.47 breaths/min, with a mean of 0.66 breaths/min, and Fig. 3D demonstrates an absolute error of 0.11–0.87 breaths/min, with a mean of 0.40 breaths/min for RV-CS bipolar leads. As shown by the small absolute errors in all intracardiac lead configurations, the algorithm closely tracks the true RR across a wide range of intracardiac leads.
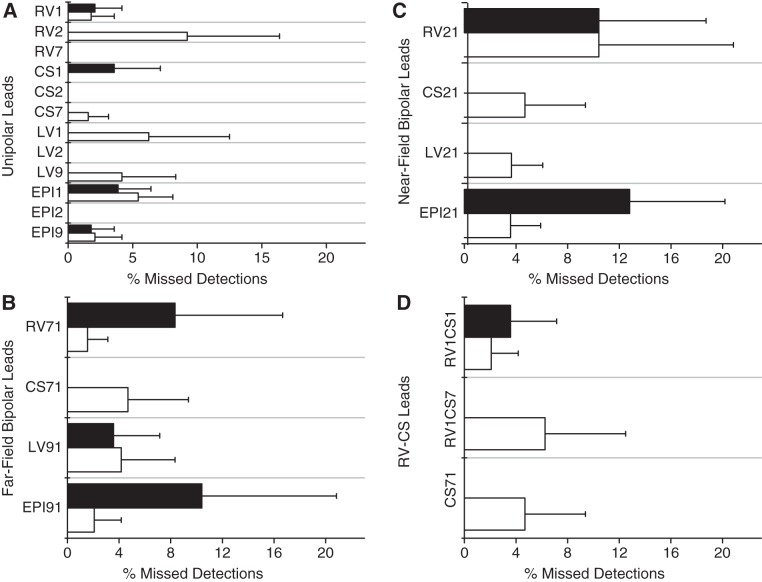
In Fig. 4, we show the percentage of missed detections for each lead at tidal volumes of 500 and 750 ml, averaged across all animals, for unipolar leads (Fig. 4A), far-field bipolar leads (Fig. 4B), near-field bipolar leads (Fig. 4C), and RV-CS leads (Fig. 4D). No statistically significant difference was found for the percentage of missed detections between tidal volumes of 500 and 750 ml for any intracardiac lead, and no statistically significant difference was found between any two unipolar, any two far-field bipolar, any two near-field bipolar, or any two RV-CS leads, respectively.
Fig. 4.
Percentage of missed detections (means ± SD) for each intracardiac lead at tidal volumes of 500 ml (in white) and 750 ml (in black), averaged across all animals, for unipolar leads (A), far-field bipolar leads (B), near-field bipolar leads (C), and RV-CS leads (D). No statistically significant difference was found between tidal volume 500 and 750 ml for any intracardiac lead, and no statistically significant difference was found between any 2 unipolar, any 2 far-field bipolar, any 2 near-field bipolar, or any 2 RV-CS leads, respectively. A: unipolar missed detection percent ranges from 0.0 to 9.2% with mean of 1.7%. B: far-field bipolar missed detection percent also ranges from 0.0 to 9.2% with mean of 1.7%. C: near-field bipolar missed detection percent ranges from 0.0 to 12.9% with mean of 5.7%. D: RV-CS bipolar missed detection percent ranges from 0.0 to 6.3% with a mean of 2.8%. As shown, the average percentage of missed detections in all intracardiac lead configurations is low.
In Fig. 4A, we observe that the percentage of missed detections for unipolar leads has a range of 0.0–9.2%, with a mean of 1.7%. In Fig. 4B, the percentage of missed detections for far-field bipolar leads also has a range of 0.0–9.2%, with a mean of 1.7%. Figure 4C demonstrates that the percentage of missed detections for near-field bipolar leads has a range of 0.0–12.9%, with a mean of 5.7%, and finally, Fig. 4D demonstrates that the percentage of missed detections for RV-CS bipolar leads has a range of 0.0–6.3%, with a mean of 2.8%. While the average percentage of missed detections in all intracardiac lead configurations is low, the maximum percentage of missed detections on select leads is higher than desired for a robust RR detection algorithm.
Lead optimization.
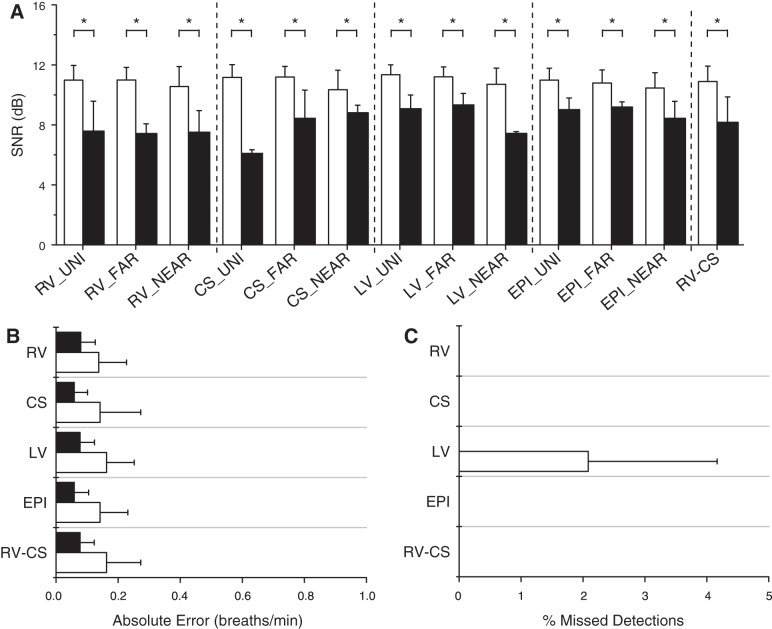
To examine the conditions leading to the failure of the proposed algorithm to accurately estimate RR, we compared the spectral SNR of all accurate vs. missed RR detections for all unipolar, far-field bipolar, near-field bipolar, and RV-CS intracardiac leads, referenced to surface ECG lead II.
The spectral SNR using each intracardiac lead configuration was compiled across all animals, tidal volumes, and ventilation rates. The SNR of all accurate vs. missed RR detections was then compared across all intracardiac leads using a two-factor Friedman's test.
In Fig. 5A, we plot the means ± SD of the spectral SNR for every intracardiac lead combination for all accurate and missed detections. We found that the accurate detection SNR is significantly larger than the missed detection SNR (P < 0.001). Across all lead types, the average accurate detection SNR is 11.0 dB, and the average missed detection SNR is 8.2 dB.
Fig. 5.
Intracardiac lead optimization. A: signal-to-noise ratio (SNR) estimates for every intracardiac lead type, compiled across all animals, at tidal volumes, and ventilation rates, for all accurate (white) and missed (black) detections. The accurate detection SNR is significantly larger than the missed detection SNR for every lead type (*P < 0.001). Across all lead types, the average accurate detection SNR is 11.0 dB, and the average missed detection SNR is 8.2 dB. B: absolute error (means ± SD) for RV, CS, LV, EPI, and RV-CS lead groupings using our optimized algorithm, at tidal volumes of 500 and 750 ml, averaged across all animals. All intracardiac leads are grouped by catheter type, and for each group, the lead combination with the highest SNR at each ventilation rate was used to estimate the RR. The absolute error ranges from 0.09 to 0.16 breaths/min with mean 0.13 breaths/min. C: percentage of missed detections (means ± SD) for each lead group, at tidal volumes of 500 and 750 ml, averaged across all animals. The percentage of missed detections ranges from 0.0 to 2.1%, with mean 0.2%. There were no missed detections using the RV, CS, EPI, and RV-CS leads, while the only missed detection came from a single RR measurement in a single animal at tidal volume of 750 ml in which the maximum SNR was <7 dB for the LV lead grouping.
We next grouped all intracardiac leads by catheter type (RV, CS, LV, EPI, or RV-CS, grouping all unipolar, far-field bipolar, and near-field bipolar leads from the same catheter) and reanalyzed the data using our optimized algorithm. For each catheter, the lead combination with the highest SNR at each ventilation rate was used to estimate the RR. In Fig. 5B, we plot the absolute error for each catheter at tidal volumes of 500 and 750 ml, averaged across all animals. The absolute error using our optimized algorithm has a range of 0.09–0.16 breaths/min, with a mean of 0.13 breaths/min. In Fig. 5C, we plot the percentage of missed detections for each catheter at tidal volumes of 500 and 750 ml, averaged across all animals. The percentage of missed detections using our optimized algorithm has a range of 0.0–2.1%, with a mean of 0.2%. There were no missed detections using the RV, CS, EPI, and RV-CS leads. Notably, the only missed detection came from a single RR measurement in a single animal at a tidal volume of 750 ml in which the maximum SNR was <7 dB for the LV lead grouping.
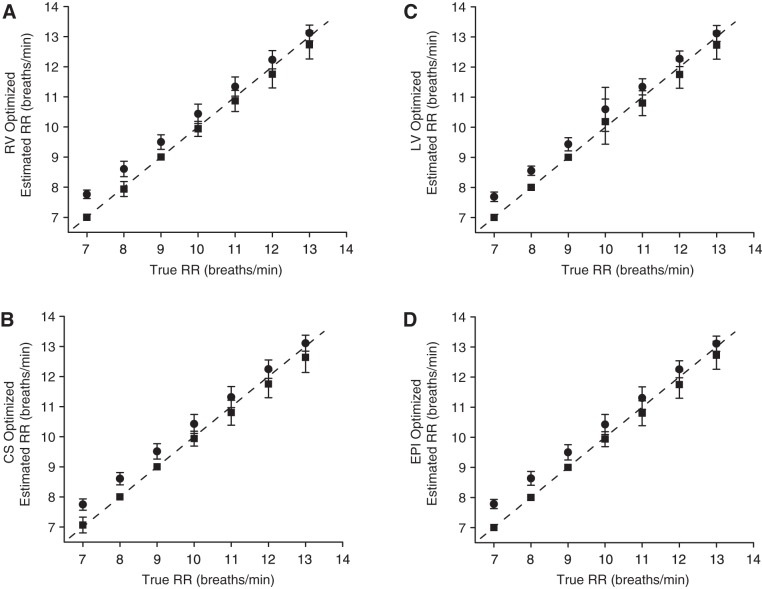
We further characterized the performance of our optimized algorithm by calculating the goodness-of-fit between the estimated and true RR across all ventilation rates. In Fig. 6, we plot the estimated vs. the true RR for RV (Fig. 6A), CS (Fig. 6B), LV (Fig. 6C), and EPI lead (Fig. 6D) groupings for both nonrounded and downrounded RR estimates, compiled across all animals and tidal volumes. The rounded RR estimates closely track the true RR, with goodness-of-fit R2 statistic of 0.97, 0.96, 0.96, 0.97, and 0.96 for RV, CS, LV, EPI, and RV-CS estimates, respectively (RV-CS data not shown).
Fig. 6.
Estimated vs. true respiration rate using the optimized algorithm, compiled across all animals and tidal volumes, for RV (A), CS (B), LV (C), and EPI (D) lead groupings. Nonrounded estimates (●) and downrounded rounded estimates (■) are displayed as means ± SD. A dashed line marks equality (y = x). The downrounded respiration estimates closely track the true RR, with goodness-of-fit R2 statistic of 0.97, 0.96, 0.96, 0.97, and 0.96 for RV, CS, LV, EPI, and RV-CS estimates, respectively (RV-CS data not shown).
Optimized intracardiac RR estimation using RV-CS bipolar leads.
To develop an RR estimation method that could be deployed in an intracardiac device and that does not rely on the use of any surface ECG lead, we evaluated the performance of our optimized algorithm using ratiometric combinations of bipolar leads RV1CS1, RV1CS7, and CS1CS7.
In Fig. 7A, we show the absolute error and percentage of missed detections at tidal volumes of 500 and 750 ml, averaged across all animals. This method is highly accurate when applied to intracardiac-only RV-CS bipolar leads, with an average absolute error of 0.09 and 0.39 breaths/min, respectively, at tidal volumes of 500 and 750 ml, and a missed detection percentage of 0 and 1.78%, respectively, at tidal volumes of 500 and 750 ml. Only one RR intervention was improperly detected. In Fig. 7B, we plot the estimated vs. true RR across all ventilation rates for both nonrounded and downrounded RR estimates, compiled across all animals and tidal volumes. The rounded RR estimates closely track the true RR, with goodness-of-fit R2 statistic of 0.97. In Fig. 7C, we plot the average SNR of the six RV-CS lead combinations. While no statistically significant difference was found between any pair of lead combinations (using a nonparametric Friedman's test), the CS71/RV1CS1 lead combinations trended higher than the RV1CS1/CS71 lead combinations, which trended higher than the CS71/RV1CS7 lead combinations.
Fig. 7.
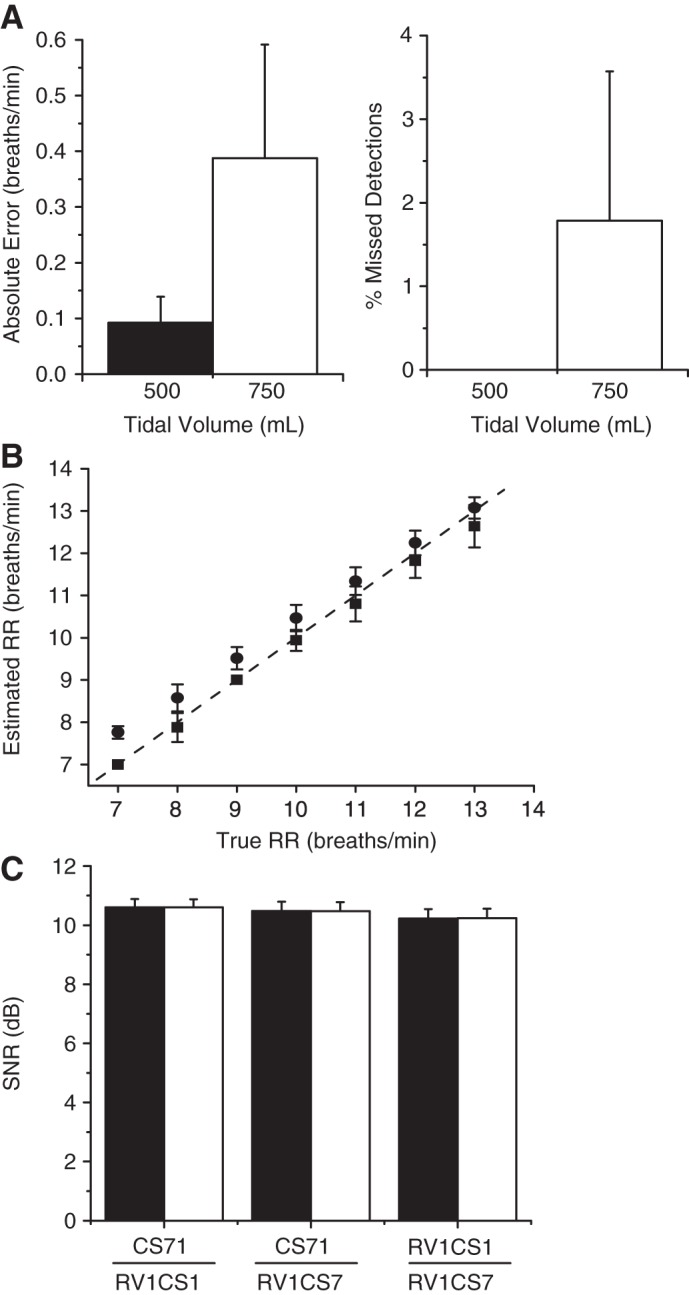
Intracardiac-only RR estimation, using RV1CS1, RV1CS7, and CS1CS7 bipolar leads. A: absolute error and percentage of missed detections (means ± SD) at tidal volumes of 500 and 750 ml, averaged across all animals. Only 1 RR intervention was improperly detected, resulting in an overall accuracy of 99.1%. B: estimated vs. true RR employing either nonrounded (●) or rounded (■) RR estimates (means ± SD), compiled across all animals and tidal volumes. The rounded respiration estimates closely track the true RR, with goodness-of-fit R2 statistic of 0.97. C: average SNR of the 6 RV-CS lead combinations. The CS71/RV1CS1 lead combinations trended higher than the RV1CS1/CS71 lead combinations, which trended higher than the CS71/RV1CS7 lead combinations. Indeed, 42.86% of the optimized lead configurations use a combination of the CS71 and RV1CS1 leads, 32.38% of the optimized lead configurations use a combination of the RV1CS1 and CS71 leads, and 24.76% of the optimized lead configurations use a combination of the CS71 and RV1CS7 leads.
Indeed, 42.86% of the optimized lead configurations use a combination of the CS71 and RV1CS1 leads, 32.38% of the optimized lead configurations use a combination of the RV1CS1 and CS71 leads, and 24.76% of the optimized lead configurations use a combination of the CS71 and RV1CS7 leads. With only one missed detection, the overall accuracy of this intracardiac algorithm is 99.1%.
Estimation of the RR from body surface signals.
To further evaluate this method in estimating the RR, we applied this method on 12-lead ECG recordings in 4 animals. We estimated the RR by obtaining for each 32-beat sequence the ratio of any two body surface leads that provided the highest SNR. We found that this method provided 100% accurate estimation of the RR, with no missed detections.
In Fig. 8A, we show the absolute error at tidal volumes of 500 and 750 ml, averaged across all animals. This method exhibits an average absolute error of 0.25 and 0.25 breaths/min, respectively, at tidal volumes of 500 and 750 ml. In Fig. 8B, we plot the estimated vs. true RR across all ventilation rates for both nonrounded and downrounded RR estimates, compiled across all animals and tidal volumes. The rounded RR estimates closely track the true RR, with goodness-of-fit R2 statistic of 0.93. In Fig. 8C, we identify the seven most-used lead configurations by the optimized algorithm. Ratiometric configurations V1/V2 and V5/ECGIII were each used 16.1% of the time, followed by ECGIII/V4 (10.7%), V5/V3 (8.9%), aVL/V5 (5.4%), ECGIII/V5 (5.4%), and V5/V2 (3.6%). Of note, the pairing of ECGIII and V5 was the most commonly selected pairing, accounting for 19.6% of all optimized pairings.
Fig. 8.
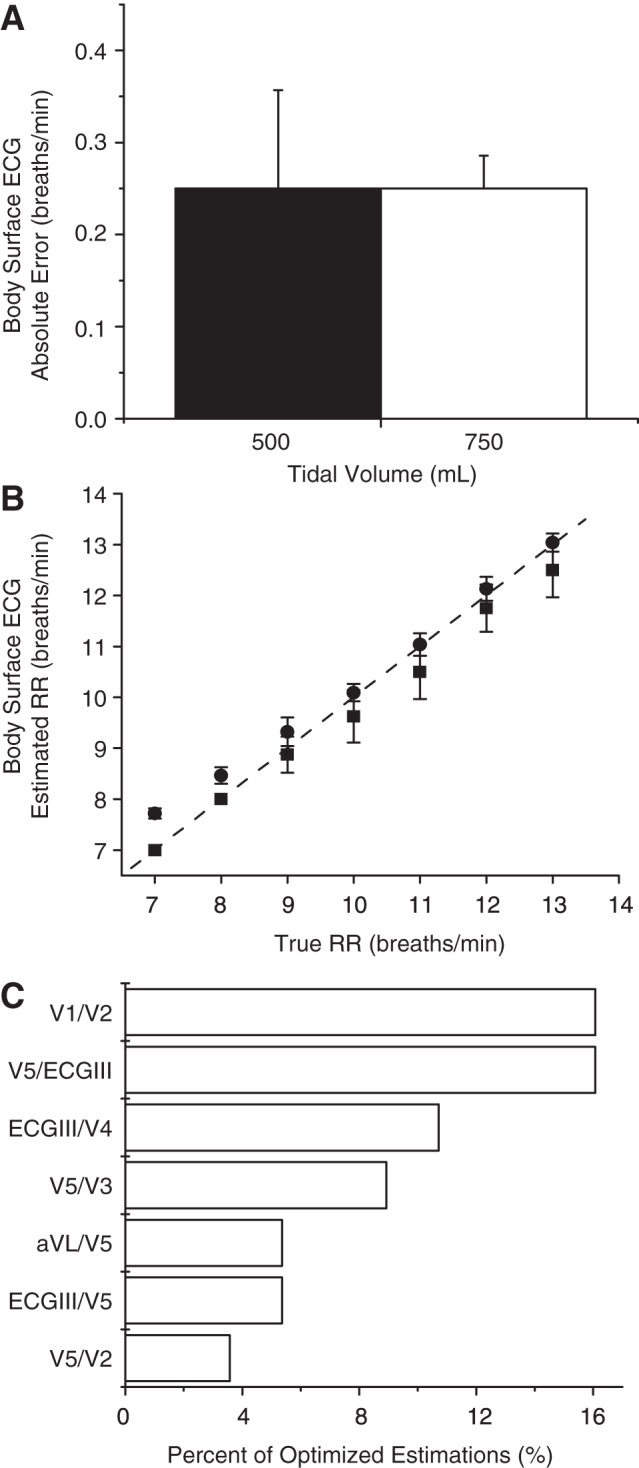
12-lead ECG RR estimation. A: absolute error (means ± SD) at tidal volumes of 500 and 750 ml, averaged across all animals. The accuracy was 100%, with no missed detections. B: estimated vs. true RR employing either nonrounded (●) or rounded (■) RR estimates (means ± SD), compiled across all animals and tidal volumes. The rounded respiration estimates closely track the true RR, with a goodness-of-fit R2 statistic of 0.93. C: most-used lead configurations, by percent. The pairing of ECGIII and V5 was the most commonly selected pairing, accounting for 19.6% of all optimized lead pairings.
DISCUSSION
The ability to accurately monitor RR in ambulatory patients holds significant promise for improving the management of a number of different disease processes. For instance, abnormal respiratory patterns are prevalent in patients with heart failure and preliminary data suggest that treatment of sleep-disordered breathing improves LV function (17). Since many heart failure patients already have implantable cardiac devices and others can be monitored with ambulatory telemetry monitors, the identification and treatment of periodic sleep-disordered breathing in patients with heart failure hold significant promise for improving outcomes (7, 26).
However, currently available tools for diagnosing sleep-disordered breathing require nocturnal polysomnography, usually mandating an overnight stay in a clinical facility, thus generating substantial cost for the healthcare system and creating significant inconvenience for the patient. In light of the rapidly growing number of patients with class III and IV heart failure who have implantable devices in place for rhythm monitoring or cardiac resynchronization, the opportunity to capitalize on these devices for the added benefit of respiratory monitoring would represent a significant advance in the diagnosis and treatment of sleep-disordered breathing.
In this study we propose a novel algorithm to accurately and efficiently estimate the RR from either intracardiac or body surface leads. Overall, we have shown that the presented method first, does not require specialized hardware to measure the RR but rather uses only standard ECG signals; second, estimates RR with high accuracy utilizing either intracardiac or body surface ECG signals; and third, automatically optimizes the lead choice for real-time RR estimation without requiring any a priori knowledge of lead orthogonality.
For intracardiac RR estimation we present a method that uses ratiometric combinations of bipolar leads RV1CS1, RV1CS7, and CS1CS7. RV and CS catheters are commonly implanted with cardiac-resynchronization therapy devices in heart failure patients, and these bipolar lead configurations form a triangle, ensuring a range of angles between ratiometric lead pairs to optimize RR estimation. We found the overall accuracy of this intracardiac method to be 99.1%.
Previous studies have reported 6% error of the RR (3, 19, 21, 22) and a high correlation (R2 = 0.8) with the respiration signal acquired with a chest-belt respiration sensor (3, 20–22). Our method demonstrated 100% accuracy for RR estimation using 12-lead ECGs (R2 = 0.93), which shows a significant improvement over previously reported results. The most commonly selected leads for ratiometric RR estimation include frontal ECG lead III and precordial lead V5, at least one of which was automatically selected by our algorithm in six of the seven most-used ratiometric lead combinations and together were used 19.6% of the time. This finding supports the possibility that only a subset of ECG leads is required for high-fidelity ambulatory ECG-based RR estimation, including only leads III and V5. Finally, the use of 32-beat window makes this algorithm suitable to respond to faster RR changes, as may be found with CSR. The trade-off for reducing the beat window length for insignificantly reduced accuracy is not expected to affect the performance of this method (Fig. 1).
Finally, it should be noted that for the short-duration ECG data obtained from a 32-beat window, the heart rate is likely to remain relatively constant such that one can assume that the ECG-derived respiratory signal is consisted of evenly sampled data; thus the conventional Fourier transform may be reliably applied to such short-duration data sequences (also confirmed by the small error rates of <0.16 breaths/min). For longer ECG sequences where the changes in heart rate may be substantial, the spectral estimation may be accomplished using Lomb's method for unequally spaced data (16).
In conclusion, the proposed highly accurate and efficient algorithm takes advantage of simple hardware that is readily available as part of ECG patient monitoring to provide the RR as an additional physiological parameter that in conjunction with estimation of the tidal volume [see companion article (25a)] may help improve diagnosis, treatment, and outcomes across a variety of clinical settings. Since the proposed method to estimate RR is based on morphological analysis of ECG data, the algorithm is also expected to work on human ECG data. However, due to the anatomical differences between the swine and human chest as well as differences in the thoracic impedance during breathing, further evaluation of the proposed method should be performed in human model.
GRANTS
The work was supported by a Scientist Development Grant (No. 0635127N), a Predoctoral Fellowship (No. 0815767D), a Founders Affiliate Postdoctoral Fellowship (No. 12POST9310001) from the American Heart Association, and grants from the Center for Integration of Medicine and Innovative Technology (CIMIT), the Deane Institute for Integrative Research in Atrial Fibrillation and Stroke, and the Cardiovascular Research Society. This work was conducted with support from Harvard Catalyst and The Harvard Clinical and Translational Science Center (National Center for Research Resources and the National Center for Advancing Translational Sciences, National Institutes of Health Award 8UL1TR000170-05, and financial contributions from Harvard University and its affiliated academic health care centers).
DISCLOSURES
No conflicts of interest, financial or otherwise, are declared by the author(s).
DISCLAIMER
The content is solely the responsibility of the authors and does not necessarily represent the official views of Harvard Catalyst, Harvard University and its affiliated academic health care centers, or the National Institutes of Health.
AUTHOR CONTRIBUTIONS
Author contributions: E.H.W., O.S., F.M.M., N.S., L.F., S.L., and A.A.A. performed experiments; E.H.W., O.S., P.R., and A.A.A. analyzed data; E.H.W., O.S., and A.A.A. interpreted results of experiments; E.H.W., O.S., and P.R. prepared figures; E.H.W., O.S., and A.A.A. drafted manuscript; E.H.W., O.S., P.R., F.M.M., N.S., and A.A.A. edited and revised manuscript; A.A.A. conception and design of research; A.A.A. approved final version of manuscript.
REFERENCES
- 1.Anderson DE, Coyle K, Haythornthwaite JA. Ambulatory monitoring of respiration: inhibitory breathing in the natural environment. Psychophysiology 29: 551–557, 1992 [DOI] [PubMed] [Google Scholar]
- 2.Augousti AT, Maletras FX, Mason J. Evaluation of cardiac monitoring using fiber optic plethysmography. Ann Biomed Eng 34: 416–425, 2006 [DOI] [PubMed] [Google Scholar]
- 3.Bailon R, Sornmo L, Laguna P. A robust method for ECG-based estimation of the respiratory frequency during stress testing. IEEE Trans Biomed Eng 53: 1273–1285, 2006 [DOI] [PubMed] [Google Scholar]
- 4.Bonavia M, Averame G, Canonica W, Cricelli C, Fogliani V, Grassi C, Moretti AM, Ferri P, Rossi A, Paggiaro PL. Feasibility and validation of telespirometry in general practice: The Italian “Alliance” study. Respir Med 103: 1732–1737, 2009 [DOI] [PubMed] [Google Scholar]
- 5.Brack T, Jubran A, Tobin MJ. Dyspnea and decreased variability of breathing in patients with restrictive lung disease. Am J Respir Crit Care Med 165: 1260–1264, 2002 [DOI] [PubMed] [Google Scholar]
- 6.Chon KH, Dash S, Ju K. Estimation of respiratory rate from photoplethysmogram data using time-frequency spectral estimation. IEEE Trans Biomed Eng 56: 2054–2063, 2009 [DOI] [PubMed] [Google Scholar]
- 7.El-Khatib M, Bou-Khalil P, Zeineldine S, Kanj N, Abi-Saad G, Jamaleddine G. Metabolic and respiratory variables during pressure support versus synchronized intermittent mandatory ventilation. Respiration 77: 154–159, 2009 [DOI] [PubMed] [Google Scholar]
- 8.Fraiwan L, Al-Bataineh O, Matouq J, Haddad S, Bani-Amer M. ECG-based wireless home infant apnoea monitor. J Med Eng Technol 33: 309–313, 2009 [DOI] [PubMed] [Google Scholar]
- 9.Gravelyn TR, Weg JG. Respiratory rate as an indicator of acute respiratory dysfunction. JAMA 244: 1123–1125, 1980 [PubMed] [Google Scholar]
- 10.Hooker EA, O'Brien DJ, Danzl DF, Barefoot JA, Brown JE. Respiratory rates in emergency department patients. J Emerg Med 7: 129–132, 1989 [DOI] [PubMed] [Google Scholar]
- 11.Javaheri S, Parker TJ, Wexler L, Michaels SE, Stanberry E, Nishyama H, Roselle GA. Occult sleep-disordered breathing in stable congestive heart failure. Ann Intern Med 122: 487–492, 1995 [DOI] [PubMed] [Google Scholar]
- 12.Jovanov E, Raskovic D, Hormigo R. Thermistor-based breathing sensor for circadian rhythm evaluation. Biomed Sci Instrum 37: 493–497, 2001 [PubMed] [Google Scholar]
- 13.Kristiansen NK, Fleischer J, Jensen MS, Andersen KS, Nygaard H. Design and evaluation of a handheld impedance plethysmograph for measuring heart rate variability. Med Biol Eng Comput 43: 516–521, 2005 [DOI] [PubMed] [Google Scholar]
- 14.Leonard P, Grubb NR, Addison PS, Clifton D, Watson JN. An algorithm for the detection of individual breaths from the pulse oximeter waveform. J Clin Monit Comput 18: 309–312, 2004 [DOI] [PubMed] [Google Scholar]
- 15.Lindemann J, Leiacker R, Rettinger G, Keck T. Nasal mucosal temperature during respiration. Clin Otolaryngol Allied Sci 27: 135–139, 2002 [DOI] [PubMed] [Google Scholar]
- 16.Lomb NR. Least-squares frequency analysis of unequally spaced data. Astrophys Space Sci 39: 1976, 447–462 [Google Scholar]
- 17.Malone S, Liu PP, Holloway R, Rutherford R, Xie A, Bradley TD. Obstructive sleep apnoea in patients with dilated cardiomyopathy: effects of continuous positive airway pressure. Lancet 338: 1480–1484, 1991 [DOI] [PubMed] [Google Scholar]
- 18.Massumi RA, Nutter DO. Cardiac arrhythmias associated with Cheyne-Stokes respiration: a note on the possible mechanisms. Dis Chest 54: 21–32, 1968 [DOI] [PubMed] [Google Scholar]
- 19.Moody G, Mark R, Zoccola A, Mantero S. Derivation of respiratory signals from multi-lead ECGs. Comp Cardiol 12: 113–116, 1985 [Google Scholar]
- 21.Pallas-Areny R, Canals Riera F. Recovering the respiratory rhythm out of the ECG. Med Biol Eng Comput 23: 338–339, 1985 [Google Scholar]
- 22.Park SB, Noh YS, Park SJ, Yoon HR. An improved algorithm for respiration signal extraction from electrocardiogram measured by conductive textile electrodes using instantaneous frequency estimation. Med Biol Eng Comput 46: 147–158, 2008 [DOI] [PMC free article] [PubMed] [Google Scholar]
- 23.Pellegrino R, Viegi G, Brusasco V, Crapo RO, Burgos F, Casaburi R, Coates A, van der Grinten CP, Gustafsson P, Hankinson J, Jensen R, Johnson DC, MacIntyre N, McKay R, Miller MR, Navajas D, Pedersen OF, Wanger J. Interpretative strategies for lung function tests. Eur Respir J 26: 948–968, 2005 [DOI] [PubMed] [Google Scholar]
- 24.Pichon A, Zhenzhong B, Favret F, Jin G, Shufeng H, Marchant D, Richalet JP, Ge RL. Long term ventilatory adaptation and ventilatory response to hypoxia in Plateau pika (Ochotona curzoniae): role of nNOS and dopamine. Am J Physiol Regul Integr Comp Physiol 297: R978–R987, 2009 [DOI] [PubMed] [Google Scholar]
- 25.Quaranta AJ, D'Alonzo GE, Krachman SL. Cheyne-Stokes respiration during sleep in congestive heart failure. Chest 111: 467–473, 1997 [DOI] [PubMed] [Google Scholar]
- 25a.Sayadi O, Weiss EH, Merchant FM, Puppala D, Armoundas AA. An optimized method for estimating the tidal volume from intracardiac or body surface electrocardiographic signals: implications for estimating minute ventilation. Am J Physiol Heart Circ Physiol 306, 2014. First published June 6, 2014; 10.1152/ajpheart.00038.2014 [DOI] [PMC free article] [PubMed] [Google Scholar]
- 26.Schneider J, Mitchell I, Singhal N, Kirk V, Hasan SU. Prenatal cigarette smoke exposure attenuates recovery from hypoxemic challenge in preterm infants. Am J Respir Crit Care Med 178: 520–526, 2008 [DOI] [PubMed] [Google Scholar]
- 27.Schoenfeld MH, McGovern B, Garan H, Ruskin JN. Long-term reproducibility of responses to programmed cardiac stimulation in spontaneous ventricular tachyarrhythmias. Am J Cardiol 54: 564–568, 1984 [DOI] [PubMed] [Google Scholar]
- 28.Shelley KH, Awad AA, Stout RG, Silverman DG. The use of joint time frequency analysis to quantify the effect of ventilation on the pulse oximeter waveform. J Clin Monit Comput 20: 81–87, 2006 [DOI] [PubMed] [Google Scholar]
- 29.Siew ML, Te Pas AB, Wallace MJ, Kitchen MJ, Lewis RA, Fouras A, Morley CJ, Davis PG, Yagi N, Uesugi K, Hooper SB. Positive end-expiratory pressure enhances development of a functional residual capacity in preterm rabbits ventilated from birth. J Appl Physiol 106: 1487–1493, 2009 [DOI] [PubMed] [Google Scholar]
- 30.Smith JM, Clancy EA, Valeri CR, Ruskin JN, Cohen RJ. Electrical alternans and cardiac electrical instability. Circulation 77: 110–121, 1988 [DOI] [PubMed] [Google Scholar]
- 31.Weiss EH, Merchant FM, d'Avila A, Foley L, Reddy VY, Singh JP, Mela T, Ruskin JN, Armoundas AA. A novel lead configuration for optimal spatio-temporal detection of intracardiac repolarization alternans. Circ Arrhythm Electrophysiol 4: 407–417, 2011 [DOI] [PMC free article] [PubMed] [Google Scholar]
- 32.Wilber D, Garan H, Ruskin J. Electrophysiologic testing in survivors of cardiac arrest. Circulation 75: 146–153, 1987 [PubMed] [Google Scholar]


