Abstract
The ability to accurately monitor tidal volume (TV) from electrocardiographic (ECG) signals holds significant promise for improving diagnosis treatment across a variety of clinical settings. The objective of this study was to develop a novel method for estimating the TV from ECG signals. In 10 mechanically ventilated swine, we collected intracardiac electrograms from catheters in the coronary sinus (CS), left ventricle (LV), and right ventricle (RV), as well as body surface electrograms, while TV was varied between 0 and 750 ml at respiratory rates of 7–14 breaths/min. We devised an algorithm to determine the optimized respirophasic modulation of the amplitude of the ECG-derived respiratory signal. Instantaneous measurement of respiratory modulation showed an absolute error of 72.55, 147.46, 85.68, 116.62, and 50.89 ml for body surface, CS, LV, RV, and RV-CS leads, respectively. Minute TV estimation demonstrated a more accurate estimation with an absolute error of 69.56, 153.39, 79.33, 122.16, and 48.41 ml for body surface, CS, LV, RV, and RV-CS leads, respectively. The RV-CS and body surface leads provided the most accurate estimations that were within 7 and 10% of the true TV, respectively. Finally, the absolute error of the bipolar RV-CS lead was significantly lower than any other lead configuration (P < 0.0001). In conclusion, we have demonstrated that ECG-derived respiratory modulation provides an accurate estimation of the TV using intracardiac or body surface signals, without the need for additional hardware.
Keywords: tidal volume, percent modulation, body surface, intracardiac electrograms, minute ventilation
tidal volume (tv) represents the volume of air displaced between normal inspiration and expiration. Objective assessment of lung function, and in particular the TV, plays an important part in understanding the physiology and pathophysiology of the respiratory system (23). Measurement of TV is an integral component of patient monitoring and disease management in adults with acute lung injury and acute respiratory distress syndrome (6, 27a). It plays a significant role during mechanical ventilation to ensure adequate ventilation without causing trauma to the lungs (12). Monitoring respiratory function and measuring the TV are used increasingly in neonatal intensive care units for ventilatory management of neonates (7, 8). Furthermore, measurement of TV in ambulatory settings (2, 17, 34) and in long-term monitoring outside the hospital would be desirable for a variety of disorders that are known to be associated with respiratory abnormalities, such as chronic obstructive pulmonary disease (10, 20), restrictive lung disease (5), and Cheyne-Stokes respiration (CSR) in heart failure (24). In particular, CSR is a form of sleep-disordered breathing characterized by oscillations of ventilation between apnea and hyperapnea with a crescendo-diminuendo alteration in TV (24), which has been associated with cardiac dysrhythmias including atrioventricular block (15) and ventricular ectopy (18), and is shown to be a marker of worse prognosis and increased mortality in patients with heart failure (24). These clinical observations exemplify the complex interplay among the respiratory, cardiovascular, and autonomic systems and highlight the need for tools to monitor respiratory and cardiovascular parameters in ambulatory patients with heart failure.
In clinical settings, measurement of TV can be accomplished either directly or indirectly, using a number of different methods. Spirometer (4), Pitot tube (13), and ultrasonic airflow meter (26) directly measure air flow into and out of the lungs. Respiratory inductance plethysmography (32), computed tomography (31), electrical impedance plethysmography (25, 28), and differential pressure pneumotachograph (1) have been used to indirectly measure TV by monitoring body volume changes.
All these techniques use specialized hardware dedicated to the monitoring of TV. This hardware dependency is a feature that is not often practical and convenient in ambulatory patient monitoring. Moreover, methods of volume and flow measurement with a face mask and pneumotachograph induce error through increased dead space and resistive loading (9, 11). Therefore, their use is poorly tolerated in unsedated subjects, inducing arousal, especially during light sleep, and is completely impractical in the awake infant, thus limiting the ability to acquire data dynamically during unpredictable respiratory events such as apneas, sighs, and hypopneas (35) for protracted periods.
To date, a limited number of studies have estimated the TV using only electrocardiographic (ECG) signals by measuring the mean cardiac electrical axis direction relative to ECG lead axis direction (19) or estimating the direction of the vector loop in the QRS complex obtained from two orthogonal leads (22). These studies utilized signal processing techniques to assess the impact of changes in lung volume on the ECG signal. Such an approach could be highly desirable in situations when the TV is impractical to monitor but the ECG is recorded, such as in neonatal monitoring, during a 24-h Holter ambulatory recording or in implantable cardiac devices (i.e., pacemaker or defibrillator). However, a practical limitation of this approach is that selecting orthogonal leads is challenging because lead motion may cause the angle between two leads to change as a function of respiration or posture (22). In addition, not only the mean cardiac axis but also the thoracic impedance changes as a function of respiration, such that the angle of the mean cardiac axis is not perfectly described by the arctangent of the ratios of orthogonal leads. This issue becomes especially problematic in case of an implantable device where the number and configuration of recording leads are limited.
In this study, we present a novel ECG-derived algorithm to estimate the TV using a limited set of ECG leads. We use a porcine model to test the hypothesis that this algorithm can be used to reliably estimate TV from either body surface ECGs or intracardiac electrograms. The findings of this study may have important implications for monitoring respiratory volumes in patients with implantable cardiac devices and ambulatory patients during routine cardiac monitoring and for estimating minute ventilation.
METHODS
Animal preparation.
Ten male Yorkshire swine (40–45 kg) were anesthetized and acutely instrumented in the Animal Electrophysiology Laboratory of the Massachusetts General Hospital. The investigation conforms to the Guide for the Care and Use of Laboratory Animals published by the US National Institutes of Health (NIH Publication No. 85–23, revised 1996). The study protocols were approved by the Massachusetts General Hospital Animal Care and Use Committee.
Anesthesia was induced with telazol (4.4 mg/kg im) and xylazine (2.2 mg/kg im). Each animal was intubated and placed on a mechanical ventilator, and anesthesia was maintained with isoflurane (1.5–5%).
Percutaneous access was achieved by inserting standard angiographic sheaths into the femoral arteries and veins using the Seldinger technique (33). Decapolar catheters were placed under fluoroscopic guidance in the 1) right ventricle (RV), 2) coronary sinus (CS), and 3) left ventricle (LV). An inferior vena cava catheter was inserted as a reference electrode for unipolar signals. The actual locations of the catheters were verified by orthogonal fluoroscopic views of the heart. Standard ECG electrodes were placed on the animal's limbs and chest.
Data recording equipment.
Body surface ECG and intracardiac electrogram signals were recorded through a Prucka Cardiolab (Generic Electric) electrophysiology system that provided 16 high-fidelity analog output signals and front-end signal conditioning. Body surface signals were band-pass filtered 0.05–100 Hz, with a 60-Hz notch filter and gain of 2,500 V/V, and intracardiac signals were band-pass filtered 0.05–500 Hz, with a 60-Hz notch filter and gain of 250 V/V (3, 30).
Signals were sampled at 1,000 Hz by a multichannel 16-bit data acquisition card (National Instruments M-Series PCI6255), using a signal acquisition, display, and processing system consisting of custom software written in LabView 8.5 (National Instruments, Austin, TX) and MATLAB 7.6 (MathWorks, Natick, MA) (3, 30).
An Ohmeda anesthesia system with an Ohmeda 7800 ventilator was used to control the TV. A respiratory monitor (Surgivet, Advisor 9203) was used to measure and confirm the respiratory rate (RR) throughout each respiratory intervention.
Data collection.
For each mechanically ventilated animal, body surface and intracardiac electrograms were recorded while 1) the TV was stepped from 0 to 250, 500, and 750 ml at varying respiratory rates (7–14 breath/min). Recordings at TV = 0 ml were performed after the ventilator was switched off (breath hold), such that the state of the lungs was reflecting their functional residual capacity (29). Each TV was maintained for a minimum of 90 s.
In the intracardiac recording configuration, electrograms were recorded from 2 body surface leads (lead II and V4) and 13 intracardiac unipolar leads, including 5 leads from the RV catheter (RV2, RV3, RV4, RV7, and RV8, where smaller numbers refer to more distal electrodes), 4 leads from the CS catheter (CS3, CS4, CS7, and CS8), and 4 leads from the LV catheter (LV3, LV4, LV9, and LV10). All unipolar leads were referenced to the same lead in the inferior vena cava catheter. Bipolar intracardiac leads were reconstructed by subtracting pairs of unipolar leads, including three far-field bipolar leads (RV82, CS83, and LV10LV3), three near-field bipolar leads (RV32, CS43, and LV43), and two intercatheter bipolar leads (RV2CS3 and RV2CS8), utilizing electrodes on the RV and CS. A set of intracardiac recordings and a set of 12-lead body surface ECG recordings were collected in 10 animals.
Development of an ECG-derived TV surrogate.
The method relies on the estimation of the changes in the QRS amplitude on a beat-by-beat basis, which varies with respiration as the mean cardiac axis changes throughout the respiratory cycle (19). Specifically, the respiratory envelopes are estimated by calculating the beat-to-beat root-mean-square (RMS) of QRS amplitude from each ECG lead.
We hypothesized that as the TV increases, the deviation of the QRS amplitude and therefore the magnitude of the RMS envelope should also increase. We introduced percent modulation as a surrogate for TV, and we hypothesized that changes in TV could therefore be estimated by determining the normalized peak-to-peak amplitude (the percent modulation) of the respiratory envelope signal. The percent modulation is determined by first estimating the maximum and minimum peaks of the envelope of the time-varying signal and then calculating at every respiratory envelope (cycle) 100× (max envelope − min envelope)/(max envelope + min envelope)/2.
Due to the spatial variability in the amplitude of the ECG signals, the peak-to-peak amplitude of the ECG-derived RMS signal would be different across leads. Therefore, the peak-to-peak amplitude of the respiratory envelope is normalized to the mean value to obtain percent modulation. In practice, the magnitude of respirophasic modulation can also vary because lead motion may cause the envelope to change as a function of respiration or posture. Therefore, we attempted to develop a method that could accurately and reliably estimate the TV from an optimal lead combination based on maximizing the respirophasic modulation of the RMS envelope.
Optimized ECG-derived TV.
A software-based QRS detection algorithm was applied to body surface lead V4 to obtain preliminary R-wave annotations. Preliminary QRS detections were refined, and abnormal beats, e.g., premature ventricular complexes (PVCs) and aberrantly conducted beats, were identified using a template-matching QRS alignment algorithm (27).
Briefly, for each new beat, a 40-ms window centered at the peak of the QRS complex was formed from the preliminary R-wave detection; an isoelectric PR segment was automatically subtracted as a zero amplitude reference point (by estimating the mean voltage in a 10-ms window preceding the start of each QRS complex); a median QRS template was generated from all “normal” QRS complexes across the previous 127 beats, and the current beat was aligned to the QRS template using cross-correlation. Cross-correlation was repeated twice for each new QRS complex to ensure proper QRS alignment. A beat was considered “abnormal” if its correlation coefficient was less than a threshold value of 0.90 or if the preceding R-to-R interval was at least 10% shorter or longer than the mean R-to-R interval of the previous seven beats.
Next, we calculated the RMS amplitude of each good beat for all leads on a beat-by-beat basis using a 40-ms window centered at the peak of the QRS complex. The RMS amplitudes for all abnormal beats were generated from neighboring RMS amplitudes using cubic-spline interpolation. By replacing aberrant beats with interpolated points, rather than the average RMS value of the good beats, we minimized discontinuities in the RMS sequence before surrogate estimation.
Thereafter, we estimated the RMS signal modulation as follows: we first calculated the signal envelope by finding all maxima and minima. The peak-to-peak amplitude was calculated as the maximum minus the minimum of the envelope, and the mean signal was calculated by taking the average of the maximum and minimum of the envelope. Percent modulation was calculated as the peak-to-peak amplitude divided by the mean signal, multiplied by 100%.
Since the respiratory RMS signal is sampled by each heart beat, the accuracy of the estimation of the peak-to-peak amplitude depends on both the respiration frequency and the heart rate. To overcome the scenario that the RMS signal is undersampled in case of high respiration frequency and low heart rate, we use cubic spline interpolation to resample the RMS signal. We used simulated data to estimate the minimum required heart rate to ensure that the percent modulation error is <1%: HRmin = 12.56RR + 2.05 with an R2 statistics of 0.9995 (data not shown). In this study, given that the heart rate range was 90–120 beats/min and the respiration frequency range was 7–14 breath/min, a resampling rate of 2 (i.e., 1-point cubic spline interpolation) was used to ensure the percent modulation error is <1%.
To determine the optimal lead for TV analysis, we devised an algorithm to find the maximum percent modulation during each cycle (from a maximum point to the next maximum point) of the RMS envelope signal. For each lead type, we identified the instantaneous maximum percent modulation during each cycle of the RMS envelope signal. We also estimated the median percent modulation in a running 60-s window to smooth the instantaneous abrupt changes in the estimations.
Predicting TV using percent modulation.
Having estimated the optimized percent modulations for each lead, we sought to develop a predictive model based on the ECG-derived percent modulation such that the TV can be estimated indirectly by measuring the percent modulation (TV = a × percent modulation + b). Coefficients a and b are derived from a least squares regression analysis between the TV and percent modulation. We partitioned our data into complementary subsets, performing the Jackknife analysis each time on nine datasets (the training set) and validating the prediction model on the remaining one dataset (the test set). The estimated slopes and intercepts of the resulting linear prediction models (n = 10) were averaged over all iterations to form the final prediction equation.
RESULTS
Algorithm demonstration.
To illustrate the algorithm, in Fig. 1 we plot the QRS RMS amplitude signal from a body surface lead as well as intracardiac CS, LV, RV, and RV-CS leads (Fig. 1A), and the estimated percent modulation for each lead (Fig. 1B) of a single swine in which the TV of the ventilator was changed 2 min after the beginning of the recording from 750 to 250 ml at a fixed respiratory rate of 9 breaths/min. We observe that as the TV decreases, both the peak-to-peak amplitude of the respiratory modulation and the estimated percent modulation also decrease in all leads.
Fig. 1.
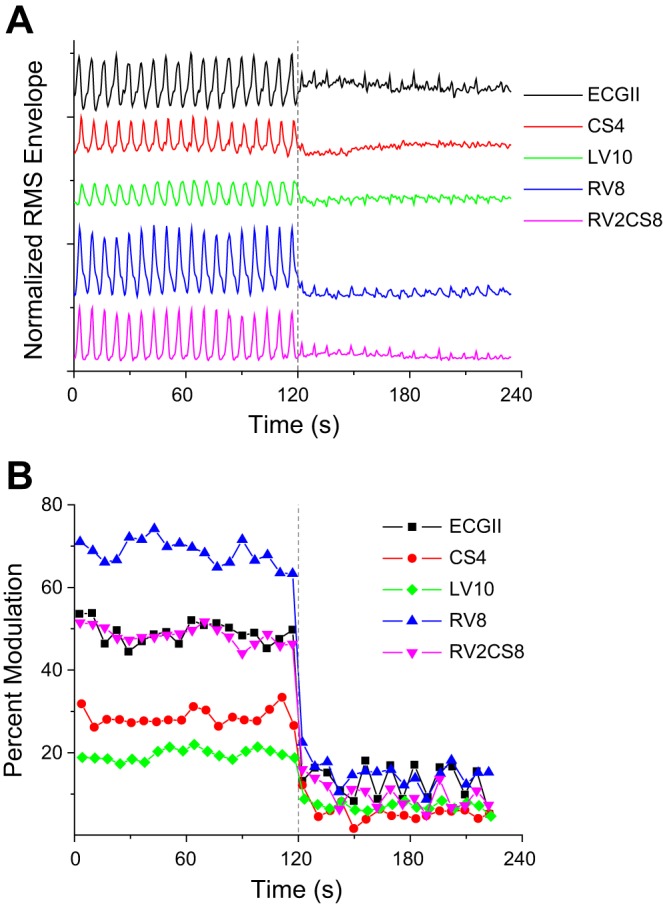
Normalized (to maximum value) QRS root-mean-squared amplitude signal from a body surface (ECG lead II) and intracardiac coronary sinus lead 4 (CS4), left ventricle lead 10 (LV10), right ventricle lead 8 (RV8), and RV2CS8 lead (A), and the estimated percent modulation (B) of a single swine in which the tidal volume (TV) of the ventilator was changed 2 min after the beginning of the recording (dashed line) from 750 to 250 ml at a fixed respiratory rate of 9 breaths/min. As the TV decreases, both the peak-to-peak amplitude of the respiratory modulation and the estimated percent modulation also decrease in all leads. Following the change of TV from 750 to 250 ml, the percent modulation in this illustration changes in 12 s from 49.01 ± 2.66 to 15.39 ± 3.67% in body surface, from 27.95 ± 1.93 to 4.83 ± 1.46% in CS, from 19.52 ± 1.31 to 7.00 ± 0.79% in LV, from 68.89 ± 2.82 to 15.09 ± 2.58% in RV, and from 48.51 ± 1.98 to 9.89 ± 2.75% in RV-CS.
Percent modulation using body surface and intracardiac leads.
We next examined the ability of a nonoptimized approach based on the respiratory modulation to estimate the TV using body surface, unipolar, far-field bipolar, near-field bipolar, and RV-CS intracardiac leads.
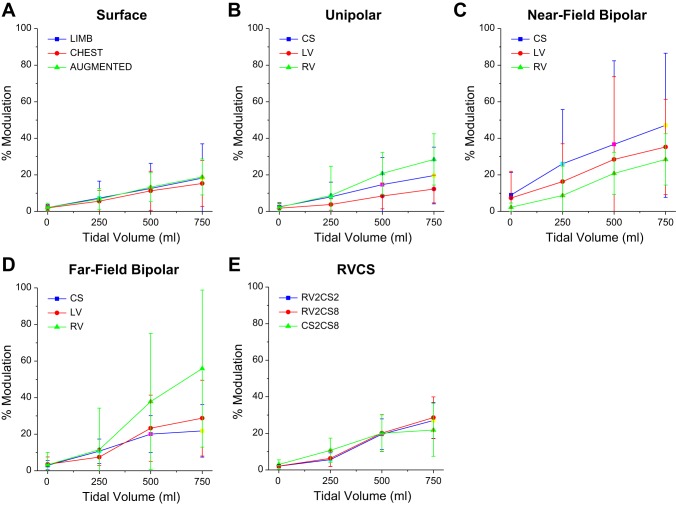
In Fig. 2, we show the percent modulation at TVs of 0, 250, 500, and 750 ml, averaged across all animals (n = 10) for body surface leads (Fig. 2A), unipolar leads (Fig. 2B), far-field bipolar leads (Fig. 2C), near-field bipolar leads (Fig. 2D), and RV-CS leads (Fig. 2E). For every lead configuration, as the TV increases so does the percent modulation. However, we observe significant variability across lead configurations.
Fig. 2.
The percent modulation (medians ± SE) at TVs of 0, 250, 500, and 750 ml, computed across all animals (n = 10), for body surface leads (A), unipolar leads (B), near-field bipolar leads (C), far-field bipolar leads (D), and RV-CS leads (E). For every lead configuration, as the TV increases, the percent modulation also increases. The data present significant variability among the different lead configurations.
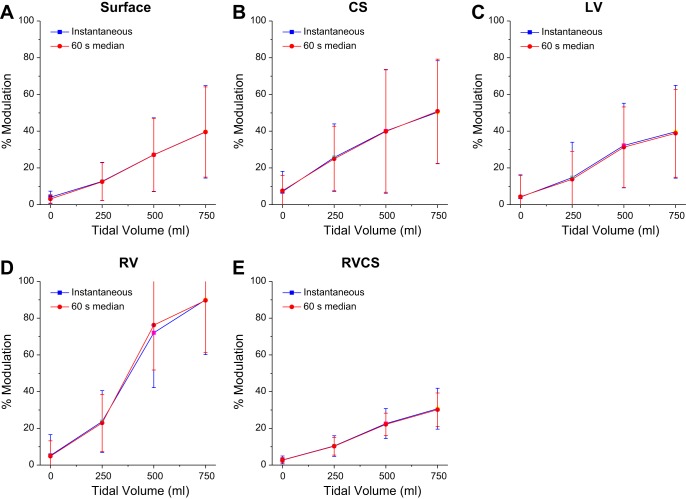
Then, for each of the body surface and intracardiac leads, within each set of body surface, intracardiac CS, LV, and RV, and the triangular RV-CS leads, we identified the lead with the maximum percent modulation and set it to be an optimized estimation of the percent modulation. Figure 3 shows the optimized instantaneous percent modulation and the minute percent modulation as a function of TV for each of the body surface, intracardiac CS, LV, and RV and the triangular RV-CS leads.
Fig. 3.
The optimized instantaneous percent modulation (■) and optimized minute percent modulation (●) (medians ± SE) at TVs of 0, 250, 500, and 750 ml, computed across all animals (n = 10), for body surface (A), CS (B), LV (C), RV (D), and RV-CS leads (E). For every lead configuration, as the TV increases, the percent modulation also increases.
To assess the correlation between the percent modulation and the TV, in Table 1 we present the coefficient of determination (R2) for the nonoptimized (Fig. 2) and optimized (Fig. 3) percent modulation, for body surface and intracardiac CS, LV, RV, and RV-CS leads, across all animals (n = 10). We observe that the RV-CS lead configuration provides the highest R2 statistic (R2 = 0.84). Moreover, optimization of the percent modulation results in an increase of the R2 statistic across all leads (R2 increased from 0.45 ± 0.19 to 0.77 ± 0.11 in body surface, from 0.44 ± 0.22 to 0.69 ± 0.18 in CS, from 0.47 ± 0.24 to 0.76 ± 0.20 in LV, from 0.63 ± 0.22 to 0.76 ± 0.20 in RV, and from 0.84 ± 0.14 to 0.91 ± 0.14 in RV-CS).
Table 1.
Goodness of fit to a line for the percent modulation as a function of tidal volume, for body surface and intracardiac CS, LV, RV, and RV-CS leads, across all animals
| Lead | R2 (nonoptimized) | R2 (optimized) | a | b |
|---|---|---|---|---|
| SURF | 0.45 ± 0.19 | 0.77 ± 0.11 | 16.61 | 0.51 |
| CS | 0.44 ± 0.22 | 0.69 ± 0.18 | 15.42 | −122.29 |
| LV | 0.47 ± 0.24 | 0.76 ± 0.20 | 17.50 | −41.37 |
| RV | 0.63 ± 0.22 | 0.76 ± 0.20 | 9.50 | −42.16 |
| RV-CS | 0.84 ± 0.14 | 0.91 ± 0.14 | 25.35 | −57.09 |
The coefficient of determination (medians ± SE) is reported for both nonoptimized and optimized percent modulation at tidal volumes (TVs) of 0, 250, 500, and 750 ml; n = 10. The regression coefficients derived from a least squares regression analysis (TV = a × percent modulation + b) between the TV and percent modulation are also presented.
SURF, body surface; CS, coronary sinus; LV, left ventricle; RV, right ventricle.
Evaluation of the TV prediction using cross-validation.
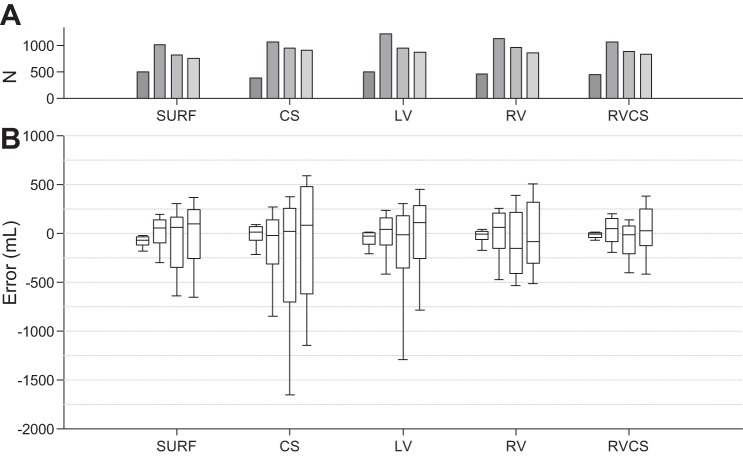
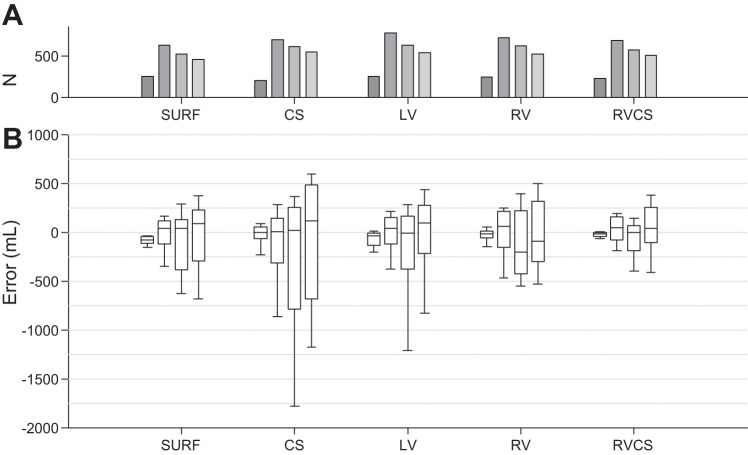
We performed the leave-one-out cross-validation on our 10 datasets, such that each subject contributes to the validation data only once. Figures 4 and 5 show the overall validation error (true TV − estimated TV) using the instantaneous percent modulation (Fig. 4) and the minute percent modulation (Fig. 5) at each of the TVs of 0, 250, 500, and 750 ml compiled over all 10 cross-validation attempts for the body surface and intracardiac CS, LV, RV, and RV-CS lead configurations.
Fig. 4.
A and B: total validation error (true TV − estimated TV) using the instantaneous percent modulation at each of the TVs of 0, 250, 500, and 750 ml compiled over all 10-folds of the cross-validation for the body surface (SURF) and intracardiac CS, LV, RV, and RV-CS lead configurations. Overall, the error increases as the TV increases from 0 to 750 ml in all leads. Data are presented as median (horizontal solid line), 25–75th percentiles (box), and 10–90th percentiles (error bars). For each lead and each TV, the total number of cycles (N) used to estimate the error is shown in A (gray bars).
Fig. 5.
A and B: total validation error (true TV − estimated TV) using the minute percent modulation at each of the TVs of 0, 250, 500, and 750 ml compiled over all 10-folds of the cross-validation for the body surface, and intracardiac CS, LV, RV, and RV-CS lead configurations. Overall, the error increases as the TV increases from 0 to 750 ml in all leads. Data are presented as median (horizontal solid line), 25–75th percentiles (box), and 10–90th percentiles (error bars). For each lead and each TV, the total number of cycles (N) used to estimate the error is shown in A (gray bars).
Overall, the TV prediction error increases as the TV increases from 0 to 750 ml in all leads. This is described by the increased variability of percent modulation at larger TVs (Fig. 3). The median estimation error using the instantaneous percent modulation at TVs 0, 250, 500, and 750 is −76.36, 51.53, 57.36, and 96.94 ml for body surface; 12.28, −24.98, 14.36, and 78.72 ml for CS; −29.74, 36.08, −15.50, and 104.34 ml for LV; −8.11, 60.94, −154.63, and −88.90 ml for RV; and −12.92, 44.34, −14.01, and 27.70 ml for RV-CS leads. Similarly, the median estimation error using the minute percent modulation at TVs 0, 250, 500, and 750 ml is −77.20, 36.42, 36.83, and 85.05 ml for body surface; −1.31, 4.27, 15.82, and 113.60 ml for CS; −41.21, 37.19, −13.28, and 95.00 for LV; −14.42, 57.96, −206.44, and −90.75 ml for RV; and −14.68, 43.29, −6.56, and 37.71 ml for RV-CS leads. We observe that for both instantaneous and minute percent modulation methods, the bipolar RV-CS configuration has the smallest error. No statistical difference of the error was found between the instantaneous and the minute percent modulation for the body surface and intracardiac leads.
ECG-derived TV prediction using optimized percent modulation.
We performed the leave-one-out cross-validation on our 10 datasets and used Jack-knifing to estimate the slopes and intercepts of the linear regression models for each of the optimized body surface, CS, LV, RV, and RV-CS leads. The final linear prediction models (presented in Table 1) were obtained by averaging the slopes and intercepts across all 10-folds of the cross-validation.
In Fig. 6, we show the absolute error for each lead including all TVs of 0, 250, 500, and 750 ml, averaged across all animals. The results demonstrate that the median absolute error for instantaneous measurement is 72.55, 147.46, 85.68, 116.62, and 50.89 ml for body surface, CS, LV, RV, and RV-CS leads, respectively. We also observe that the median absolute error for the minute percent modulation is 69.56, 153.39, 79.33, 122.16, and 48.41 ml for body surface, CS, LV, RV, and RV-CS leads, respectively.
Fig. 6.
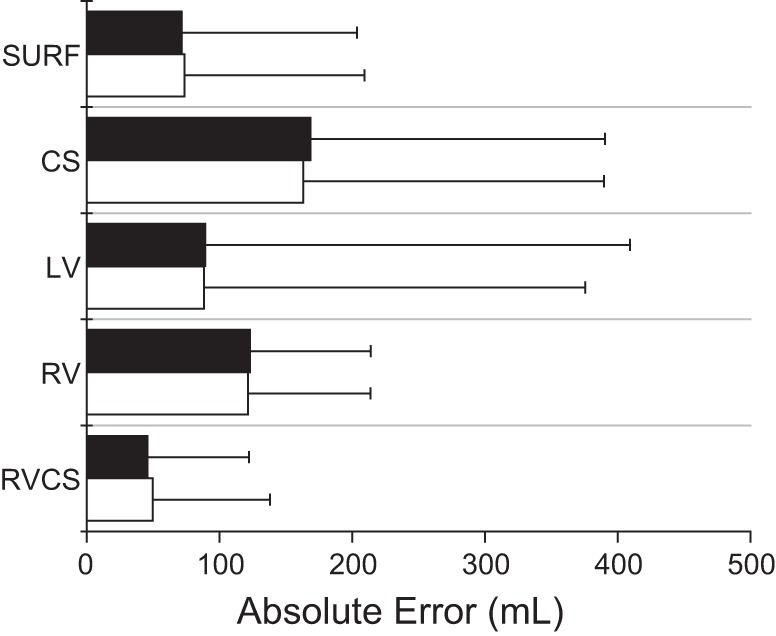
Absolute error (medians ± SE) for each of the body surface and intracardiac leads at all TVs, computed across all animals (n = 10) for the instantaneous percent modulation (white bars) and the minute percent modulation (black bars). No statistical difference of the error was found between the instantaneous and the minute percent modulation for the body surface and intracardiac leads. However, the absolute error of the bipolar RV-CS lead is significantly lower than any other lead configuration including body surface and unipolar CS, LV, and RV leads (P < 0.0001).
These results demonstrate that the triangular RV-CS leads and the body surface leads provide the most accurate estimations, which are within 7 and 10% of the true TV, respectively. No statistical difference of the error was found between the instantaneous and the minute percent modulation for the body surface and intracardiac leads. However, the absolute error of the bipolar RV-CS lead is significantly lower than any other lead configuration including body surface and unipolar CS, LV, and RV leads (P < 0.0001). As shown by the small absolute errors in the body surface and intracardiac RV-CS lead configurations, the algorithm closely tracks the true value across a wide range of TVs in these two leads.
TV prediction confidence bound using optimized percent modulation.
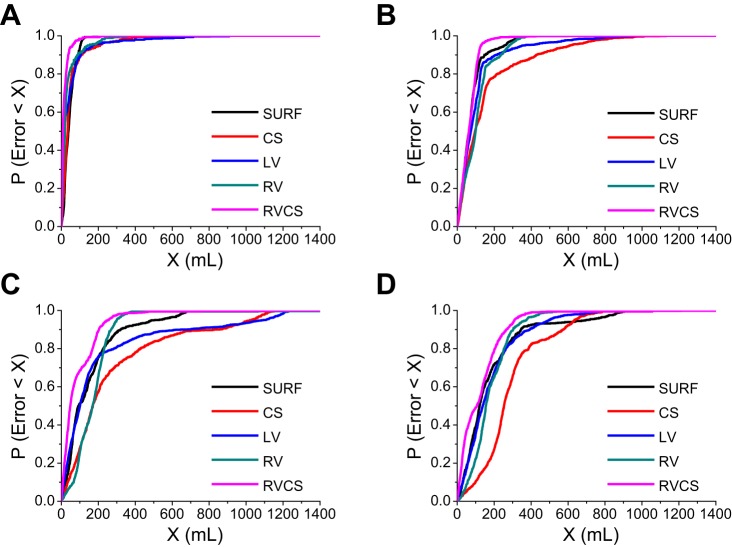
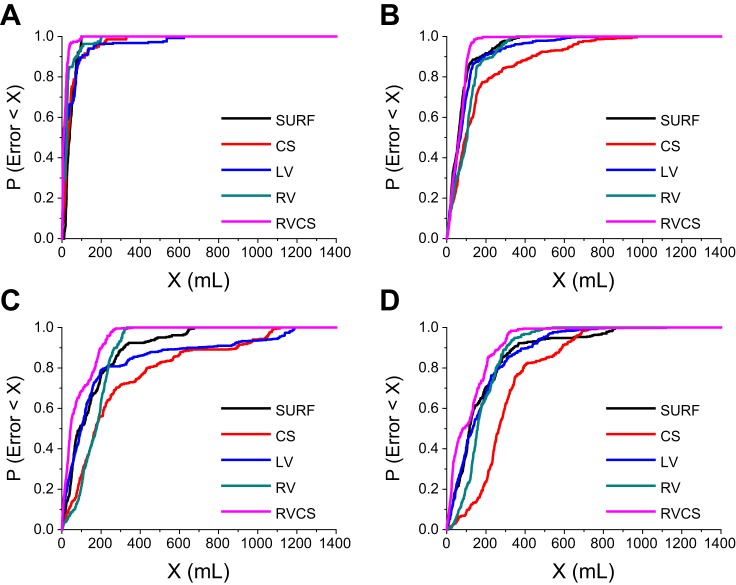
To explore the confidence bound of our optimized TV estimations, we examined the prediction error in a wide range of TVs by estimating the probability that the error is less than X ml and changing X from 0 ml to 1,400 ml.
Figure 7 shows the probability that a TV estimation error is less than X ml as a function of X, for the body surface and intracardiac leads, using the instantaneous percent modulation estimation, at TV 0 ml (Fig. 7A), 250 ml (Fig. 7B), 500 ml (Fig. 7C), and 750 ml (Fig. 7D). An arbitrary point (x, y) in these plots reflects the probability of having an estimation error of less than x ml is equal to y. For instance, the probability of having an error of 100 ml or less for the body surface, CS, LV, RV, and RV-CS leads is 0.94, 0.89, 0.89, 0.91, and 0.98 at TV 0 ml; 0.76, 0.51, 0.64, 0.51, and 0.81 at TV 250 ml; 0.51, 0.28, 0.47, 0.26, and 0.69 at TV 500 ml; and 0.39, 0.10, 0.35, 0.22, and 0.49 at TV 750 ml.
Fig. 7.
The probability of having a TV estimation error less than X ml as a function of X, for the body surface and intracardiac leads, using the instantaneous percent modulation measurement, at TV 0 ml (A), 250 ml (B), 500 ml (C), and 750 ml (D). An arbitrary point (x, y) in these plots reflects that the probability of having an estimation error of less than x ml is equal to y.
Similarly, in Fig. 8 we show the probability that a TV estimation error is less than X ml as a function of X, using the minute percent modulation estimation, at TV 0 ml (Fig. 8A), 250 ml (Fig. 8B), 500 ml (Fig. 8C), and 750 ml (Fig. 8D) for the body surface and intracardiac leads. We observe that the triangular RV-CS lead configuration has the smallest error bound. Moreover, the error bounds are smaller compared to the error bounds obtained by the instantaneous measurement of the percent modulation. Specifically, the 95% prediction confidence error during breath hold at TV 0 ml was 60 ml for instantaneous and 38 ml for minute TV estimation. Overall, these data suggest that TV estimates based on a running median of a 60-s window provide a more reliable estimation of the true TV, as compared with the instantaneous estimate.
Fig. 8.
The probability of having a TV estimation error less than X ml as a function of X, for the body surface and intracardiac leads, using the minute percent modulation measurement, at TV 0 ml (A), 250 ml (B), 500 ml (C), and 750 ml (D). An arbitrary point (x, y) in these plots reflects that the probability of having an estimation error of less than x ml is equal to y.
Effect of abnormal beats on the estimation of TV.
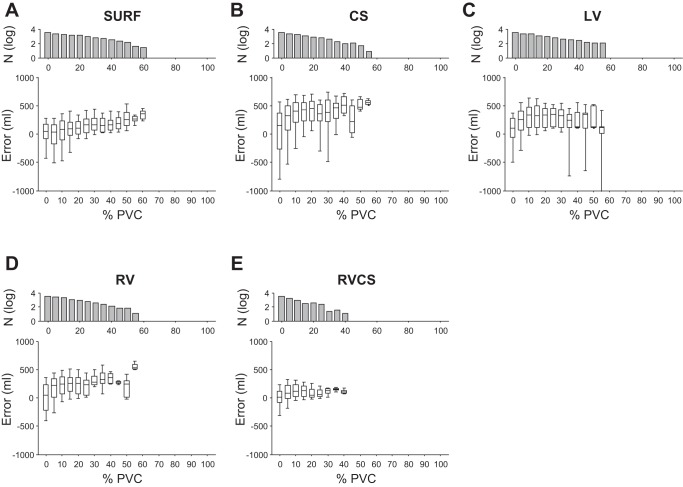
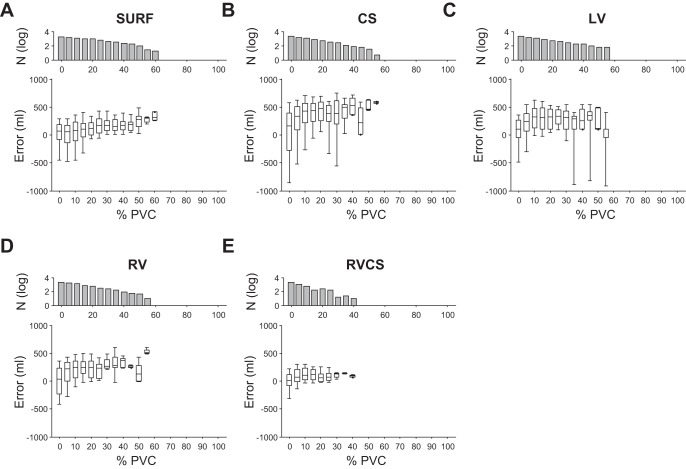
To examine the ability of our method to estimate the TV in the presence of abnormal beats, such as PVCs, we applied the optimized percent modulation estimation algorithm to ECG signals with different percentage of PVCs within each cycle of the RMS envelope. For this analysis, the QRS root-mean-squared amplitude signals were sorted based on the percentage of PVCs (from 0 to 100%) within each respiration cycle, such that 0% corresponds to cycles with no PVCs whereas 100% refers to cycles with no normal beats.
In Fig. 9, we show the TV estimation error as a function of PVC percentage within each respiration cycle for the body surface and intracardiac CS, LV, RV, and RV-CS leads using the instantaneous percent modulation estimation. For every lead configuration, as the PVC percentage increases, the error between the true TV and the ECG-derived TV increases. However, the increase in unipolar intracardiac signals is more profound, compared with the changes in the body surface and, particularly, the RV-CS triangular lead configuration. It can be observed that as the PVC percentage increases from 0 to 50%, the median error in body surface and unipolar CS, LV, and RV leads increases from 49.20 to 258.10, 154.79 to 475.98, 106.92 to 128.60, and 44.71 to 247.96 ml, respectively, while the median error in the RV-CS leads changes from 15.98 to 108.11 ml.
Fig. 9.
The TV estimation error as a function of premature ventricular complexes (PVCs) percentage within each respiration cycle for body surface leads (A), CS (B), LV (C), RV (D), and RV-CS (E) leads using the instantaneous percent modulation estimation. For every lead configuration, as the PVC percentage increases, the error between the true TV and the ECG-derived TV increases. However, the increase in unipolar intracardiac signals is more profound, compared to the changes in the body surface and particularly, the RV-CS triangular lead configuration. Data are presented as median (horizontal solid line), 25–75th percentiles (box), and 10–90th percentiles (error bars). For each lead, the number of cycles (N) used to estimate the error is also shown on the top (in log scale).
Similarly, Fig. 10 shows the TV estimation error as a function of PVC percentage during each respiration cycle using the minute percent modulation. The results demonstrate that for every lead configuration, as the PVC percentage increases, the error between the true TV and the ECG-derived TV increases. However, the RV-CS triangular lead configuration has the least increase rate. We observe that an increase from 0 to 50% in the PVC percentage results in an increase of the median error from 64.60 to 276.48 ml in body surface, from 165.67 to 466.14 ml in CS, from 103.39 ml to 111.74 in LV, from 39.83 to 125.86 ml in RV, and from 8.02 to 95.17 ml in RV-CS leads.
Fig. 10.
The TV estimation error as a function of PVC percentage within each respiration cycle for body surface leads (A), CS (B), LV (C), RV (D), and RV-CS (E) leads using the minute percent modulation estimation. For every lead configuration, as the PVC percentage increases, the error between the true TV and the ECG-derived TV increases. However, the body surface and, particularly, the RV-CS triangular lead configuration demonstrate a smaller error increase rate. Data are presented as median (horizontal solid line), 25–75th percentiles (box), and 10–90th percentiles (error bars). For each lead, the number of cycles (N) used to estimate the error is also shown at top (in log scale).
Robustness of percent modulation to the abnormal beats occurring around the maximum/minimum peaks of the respiratory envelope.
We explored the ability of percent modulation to estimate the TV in the presence of abnormal beats that occur on or around the maximum/minimum of the respiratory envelope. For this analysis, the QRS root-mean-squared amplitude signals were sorted (from 0 to 100%) based on the percentage of PVCs within each respiration cycle, such that 0% corresponds to cycles with no PVCs whereas 100% refers to cycles with no normal beats. Thereafter, we excluded respiration cycles that have at least one PVC within three, five, and seven beats from the maximum/minimum peaks of the RMS envelope.
We applied the optimized percent modulation estimation algorithm to these data and compared the results against Figs. 9 and 10, in which the occurrence of PVC on or around the maximum/minimum of the RMS envelope is not used as an exclusion criterion. Consistent with the data shown in Fig. 3, we have observed that for every lead configuration, as the PVC percentage increases, the error between the true TV and the ECG-derived TV increases; however excluding respiration cycles with different number of PVCs on or around the maximum/minimum points does not have a significant effect on the accuracy of the TV estimation. Specifically, comparison of the TV estimation error with no PVCs against the case in which cycles that have at least one PVC among three, five, and seven beats around the maximum/minimum of the RMS envelope are excluded gave P = 0.7573, P = 0.8174, and P = 0.7779, respectively, using the instantaneous percent modulation estimation and P = 0.8175, P = 0.7389, and P = 0.6861, respectively, using the minute percent modulation. In other words, the accuracy of the percent modulation estimation is not affected by PVCs occurring around the maximum/minimum of the respiratory envelope.
The apparent robustness of this algorithm results from the use of the cubic spline interpolation to create the RMS envelope. In fact, we replace aberrant beats with the interpolated RMS points, such that between each two points on either side of an aberrant beat, there is a piecewise cubic curve. When we string these curves together, we set the second and first derivatives at the endpoints of each piecewise cubic curve equal to that of the adjacent cubic curve's second and first derivatives thus providing a continuous second derivative. This gives a smooth curve that passes through each point, thus providing a better respiratory envelope representation that is less sensitive to abrupt amplitude changes due to an abnormal ECG morphology.
DISCUSSION
The ability to accurately measure TV and monitor minute ventilation is of great clinical utility in multiple settings. Currently available tools for monitoring TV require specialized hardware and additional sensors that are often not practical or convenient during ambulatory patient monitoring. The diagnosis of sleep-disordered breathing often necessitates an overnight stay in a clinical facility, thus generating a substantial cost for the healthcare system and creating a significant inconvenience for the patient. Furthermore, in light of the rapidly growing number of patients with class III and IV heart failure who have implantable devices for rhythm monitoring or cardiac resynchronization, the opportunity to capitalize on these devices with the added benefit of respiratory monitoring would represent a significant advance in the diagnosis and treatment of sleep-disordered breathing.
In this study we propose a novel algorithm to accurately estimate the TV from body surface or intracardiac leads. Overall, we have shown that first, the algorithm to estimate the TV using only ECG signals is not sensitive to aberrant ECG morphologies, such as PVCs; second, it does not require a priori knowledge of lead orthogonality or placement of the electrodes on the body surface or in the heart in predetermined positions; and third, the error in estimating the TV is relatively small for the instantaneous and minute TV estimation methods.
For TV estimation using the instantaneous measurement of percent modulation, our results show a median absolute error of 72.55 and 50.89 ml for the body surface and RV-CS leads, respectively, while using the minute percent modulation, we observe a median absolute error of 69.56 and 48.41 ml for the body surface and RV-CS leads, respectively. These findings indicate that the average precision of the proposed ECG-derived TV estimation method is within 10% of the true TV for body surface and within 7% of the true TV for intracardiac RV-CS leads.
Our results demonstrate that the adoption of the triangular intracardiac lead configuration consisting of bipolar leads between the RV and CS catheters provides the most accurate TV estimation. In light of currently available biventricular devices for cardiac resynchronization therapy that use implanted RV and CS catheters, the application of a triangular RV-CS lead configuration is a potentially clinically feasible means to monitor TV in heart failure patients. In addition, the demonstrated accuracy of body surface TV estimation ensures a reliable approach to monitor respiratory parameters in ambulatory patients and neonates. Minute ventilation plays a significant role in neonatal intensive care units for ventilatory management of neonates (7, 8). In ambulatory patients, it holds significant promise for improving the management of a number of different diseases, such as restrictive lung disease (5), chronic obstructive pulmonary disease (10, 20), and CSR in heart failure (24). Abnormal respiratory patterns are prevalent in patients with heart failure and LV function may improve by the treatment of sleep-disordered breathing (16). Another important application is the determination of the optimal dosage of drugs with respiration suppressing side effects; for example, opiates and sedatives that are commonly prescribed for chronic cancer related pain are often underdosed to avoid any risk of respiratory arrest (14). By monitoring respiratory parameters such as TV and minute ventilation while titrating the dosage, patient safety can be assured even at higher drug doses. Finally, it is likely that in a diseased subject (i.e. with chronic obstructive pulmonary disease), the residual volume is increased while the vital capacity remains relatively normal, and therefore, the lung volume variation can be smaller; the extent that the presented method can be effectively utilized in severe obstructive pulmonary disease needs to be confirmed in clinical studies.
In conclusion, the proposed novel algorithm takes advantage of simple hardware that is readily available as part of ECG patient monitoring to accurately estimate TV that in conjunction with estimation of the respiratory rate [see companion paper (30a)], contributes to the estimation of minute ventilation, as a critical parameter in physiological monitoring that may help improve diagnosis, treatment, and outcomes across a variety of clinical settings. Equally importantly, a similar simple approach could be employed in humans to obtain the regression model, where the true TV may be obtained through a TV monitor.
GRANTS
The work was supported by a Scientist Development Grant (No. 0635127N), a Pre-Doctoral Fellowship (No. 0815767D), a Founders Affiliate Post-Doctoral Fellowship (No. 12POST9310001) from the American Heart Association, the Kenneth M. Rosen Fellowship in Cardiac Pacing and Electrophysiology (No. 13-FA-32-HRS) from the Heart Rhythm Society, and grants from the Center for Integration of Medicine and Innovative Technology (CIMIT), the Deane Institute for Integrative Research in Atrial Fibrillation and Stroke and the Cardiovascular Research Society. This work was conducted with support from Harvard Catalyst and The Harvard Clinical and Translational Science Center (National Center for Research Resources and the National Center for Advancing Translational Sciences, National Institutes of Health Award 8UL1TR000170–05, and financial contributions from Harvard University and its affiliated academic health care centers).
DISCLOSURES
No conflicts of interest, financial or otherwise, are declared by the author(s).
DISCLAIMER
The content is solely the responsibility of the authors and does not necessarily represent the official views of Harvard Catalyst, Harvard University and its affiliated academic health care centers, or the National Institutes of Health.
AUTHOR CONTRIBUTIONS
Author contributions: O.S., E.H.W., F.M.M., D.P., and A.A.A. performed experiments; O.S., E.H.W., and A.A.A. analyzed data; O.S., F.M.M., and A.A.A. interpreted results of experiments; O.S. and A.A.A. prepared figures; O.S. and A.A.A. drafted manuscript; O.S., F.M.M., D.P., and A.A.A. edited and revised manuscript; A.A.A. conception and design of research; A.A.A. approved final version of manuscript.
REFERENCES
- 1.Abrahams N, Fisk GC, Churches AE, Loughman J, Vonwiller JB, Agzarian J, Harrison GA. Errors in pneumotachography with intermittent positive pressure ventilation. Anaesth Intensive Care 3: 284–294, 1975 [DOI] [PubMed] [Google Scholar]
- 2.Anderson DE, Coyle K, Haythornthwaite JA. Ambulatory monitoring of respiration: inhibitory breathing in the natural environment. Psychophysiology 29: 551–557, 1992 [DOI] [PubMed] [Google Scholar]
- 3.Armoundas AA, Weiss EH, Sayadi O, Laferriere S, Sajja N, Mela T, Singh JP, Barrett CD, Heist KE, Merchant FM. A novel pacing method to suppress repolarization alternans in vivo: implications for arrhythmia prevention. Heart Rhythm 10: 564–572, 2013 [DOI] [PubMed] [Google Scholar]
- 4.Bonavia M, Averame G, Canonica W, Cricelli C, Fogliani V, Grassi C, Moretti AM, Ferri P, Rossi A, Paggiaro PL. Feasibility and validation of telespirometry in general practice: The Italian “Alliance” study. Respir Med 103: 1732–1737, 2009 [DOI] [PubMed] [Google Scholar]
- 5.Brack T, Jubran A, Tobin MJ. Dyspnea and decreased variability of breathing in patients with restrictive lung disease. Am J Respir Crit Care Med 165: 1260–1264, 2002 [DOI] [PubMed] [Google Scholar]
- 6.Brochard L, Roudot-Thoraval F, Roupie E, Delclaux C, Chastre J, Fernandez-Mondejar E, Clementi E, Mancebo J, Factor P, Matamis D, Ranieri M, Blanch L, Rodi G, Mentec H, Dreyfuss D, Ferrer M, Brun-Buisson C, Tobin M, Lemaire F. Tidal volume reduction for prevention of ventilator-induced lung injury in acute respiratory distress syndrome. The Multicenter Trail Group on Tidal Volume reduction in ARDS. Am J Respir Crit Care Med 158: 1831–1838, 1998 [DOI] [PubMed] [Google Scholar]
- 7.Cheema IU, Ahluwalia JS. Feasibility of tidal volume-guided ventilation in newborn infants: a randomized, crossover trial using the volume guarantee modality. Pediatrics 107: 1323–1328, 2001 [DOI] [PubMed] [Google Scholar]
- 8.Chow LC, Vanderhal A, Raber J, Sola A. Are tidal volume measurements in neonatal pressure-controlled ventilation accurate? Pediatr Pulmonol 34: 196–202, 2002 [DOI] [PubMed] [Google Scholar]
- 9.Dolfin T, Duffty P, Wilkes D, England S, Bryan H. Effects of a face mask and pneumotachograph on breathing in sleeping infants. Am Rev Respir Dis 128: 977–979, 1983 [DOI] [PubMed] [Google Scholar]
- 10.El-Khatib M, Bou-Khalil P, Zeineldine S, Kanj N, Abi-Saad G, Jamaleddine G. Metabolic and respiratory variables during pressure support versus synchronized intermittent mandatory ventilation. Respiration 77: 154–159, 2009 [DOI] [PubMed] [Google Scholar]
- 11.Fleming PJ, Levine MR, Goncalves A. Changes in respiratory pattern resulting from the use of a facemask to record respiration in newborn infants. Pediatr Res 16: 1031–1034, 1982 [DOI] [PubMed] [Google Scholar]
- 12.Gajic O, Dara SI, Mendez JL, Adesanya AO, Festic E, Caples SM, Rana R, St Sauver JL, Lymp JF, Afessa B, Hubmayr RD. Ventilator-associated lung injury in patients without acute lung injury at the onset of mechanical ventilation. Crit Care Med 32: 1817–1824, 2004 [DOI] [PubMed] [Google Scholar]
- 13.Guyatt AR, Parker SP, McBride MJ. Measurement of human nasal ventilation using an oxygen cannula as a pitot tube. Am Rev Respir Dis 126: 434–438, 1984 [DOI] [PubMed] [Google Scholar]
- 14.Jarzyna D, Jungquist CR, Pasero C, Willens JS, Nisbet A, Oakes L, Dempsey SJ, Santangelo D, Polomano RC. American Society for Pain Management Nursing guidelines on monitoring for opioid-induced sedation and respiratory depression. Pain Manag Nurs 12: 118–145, e110, 2011 [DOI] [PubMed] [Google Scholar]
- 15.Javaheri S, Parker TJ, Wexler L, Michaels SE, Stanberry E, Nishyama H, Roselle GA. Occult sleep-disordered breathing in stable congestive heart failure. Ann Intern Med 122: 487–492, 1995 [DOI] [PubMed] [Google Scholar]
- 16.Malone S, Liu PP, Holloway R, Rutherford R, Xie A, Bradley TD. Obstructive sleep apnoea in patients with dilated cardiomyopathy: effects of continuous positive airway pressure. Lancet 338: 1480–1484, 1991 [DOI] [PubMed] [Google Scholar]
- 17.Martinez JM, Papp LA, Coplan JD, Anderson DE, Mueller CM, Klein DF, Gorman JM. Ambulatory monitoring of respiration in anxiety. Anxiety 2: 296–302, 1996 [PubMed] [Google Scholar]
- 18.Massumi RA, Nutter DO. Cardiac arrhythmias associated with Cheyne-Stokes respiration: a note on the possible mechanisms. Dis Chest 54: 21–32, 1968 [DOI] [PubMed] [Google Scholar]
- 19.Moody G, Mark R, Zoccola A, SM. Derivation of respiratory signals from multi-lead ECGs. In: Computers in Cardiology. Washington, DC: IEEE Computer Soc, 1985, p. 113–116 [Google Scholar]
- 20.Nazir SA, Erbland ML. Chronic obstructive pulmonary disease: an update on diagnosis and management issues in older adults. Drugs Aging 26: 813–831, 2009 [DOI] [PubMed] [Google Scholar]
- 22.Noshiro M, Inaoka H, Yoshida Y, Ryumae S, Shimizu M, Hoshino H, Hosaka H. Indirect measurement of tidal volume by multi-lead electrocardiograms: effect of filtering, deep breath, lead and posture. Front Med Biol Eng 7: 207–219, 1996 [PubMed] [Google Scholar]
- 23.Pellegrino R, Viegi G, Brusasco V, Crapo RO, Burgos F, Casaburi R, Coates A, van der Grinten CP, Gustafsson P, Hankinson J, Jensen R, Johnson DC, MacIntyre N, McKay R, Miller MR, Navajas D, Pedersen OF, Wanger J. Interpretative strategies for lung function tests. Eur Respir J 26: 948–968, 2005 [DOI] [PubMed] [Google Scholar]
- 24.Quaranta AJ, D'Alonzo GE, Krachman SL. Cheyne-Stokes respiration during sleep in congestive heart failure. Chest 111: 467–473, 1997 [DOI] [PubMed] [Google Scholar]
- 25.Sandberg KL, Lindstrom DP, Krueger ED, Sundell H, Cotton RB. Measurement of tidal volume during high frequency ventilation by impedance plethysmography. Pediatr Res 23: 253–256, 1988 [DOI] [PubMed] [Google Scholar]
- 26.Schibler A, Hall GL, Businger F, Reinmann B, Wildhaber JH, Cernelc M, Frey U. Measurement of lung volume and ventilation distribution with an ultrasonic flow meter in healthy infants. Eur Respir J 20: 912–918, 2002 [DOI] [PubMed] [Google Scholar]
- 27.Smith JM, Clancy EA, Valeri CR, Ruskin JN, Cohen RJ. Electrical alternans and cardiac electrical instability. Circulation 77: 110–121, 1988 [DOI] [PubMed] [Google Scholar]
- 27a.The Acute Respiratory Distress Syndrome Network. Ventilation with lower tidal volumes as compared with traditional tidal volumes for acute lung injury and the acute respiratory distress syndrome. The Acute Respiratory Distress Syndrome Network. N Engl J Med 342: 1301–1308, 2000 [DOI] [PubMed] [Google Scholar]
- 28.Voscopoulos C, Brayanov J, Ladd D, Lalli M, Panasyuk A, Freeman J. Special article: evaluation of a novel noninvasive respiration monitor providing continuous measurement of minute ventilation in ambulatory subjects in a variety of clinical scenarios. Anesth Analg 117: 91–100, 2013 [DOI] [PubMed] [Google Scholar]
- 29.Wanger J, Clausen JL, Coates A, Pedersen OF, Brusasco V, Burgos F, Casaburi R, Crapo R, Enright P, van der Grinten CP, Gustafsson P, Hankinson J, Jensen R, Johnson D, Macintyre N, McKay R, Miller MR, Navajas D, Pellegrino R, Viegi G. Standardisation of the measurement of lung volumes. Eur Respir J 26: 511–522, 2005 [DOI] [PubMed] [Google Scholar]
- 30.Weiss EH, Merchant FM, d'Avila A, Foley L, Reddy VY, Singh JP, Mela T, Ruskin JN, Armoundas AA. A novel lead configuration for optimal spatio-temporal detection of intracardiac repolarization alternans. Circ Arrhythm Electrophysiol 4: 407–417, 2011 [DOI] [PMC free article] [PubMed] [Google Scholar]
- 30a.Weiss EH, Sayadi O, Ramaswamy P, Merchant FM, Sajja N, Foley L, Laferriere S, Armoundas AA. An optimized method for the estimation of the respiratory rate from electrocardiographic signals: implications for estimating minute ventilation. Am J Physiol Heart Circ Physiol; 10.1152/ajpheart.00039.2014 [DOI] [PMC free article] [PubMed] [Google Scholar]
- 31.Werner R, White B, Handels H, Lu W, Low DA. Technical note: development of a tidal volume surrogate that replaces spirometry for physiological breathing monitoring in 4D CT. Med Phys 37: 615–619, 2010 [DOI] [PMC free article] [PubMed] [Google Scholar]
- 32.Whyte KF, Gugger M, Gould GA, Molloy J, Wraith PK, Douglas NJ. Accuracy of respiratory inductive plethysmograph in measuring tidal volume during sleep. J Appl Physiol (1985) 71: 1866–1871, 1991 [DOI] [PubMed] [Google Scholar]
- 33.Wilber D, Garan H, Ruskin J. Electrophysiologic testing in survivors of cardiac arrest. Circulation 75: 146–153, 1987 [PubMed] [Google Scholar]
- 34.Wilhelm FH, Grossman P, Roth WT. Analysis of cardiovascular regulation. Biomed Sci Instrum 35: 135–140, 1999 [PubMed] [Google Scholar]
- 35.Wilson SJ, O'Brien C, Harris MA, Masters IB. Measuring tidal volume and functional residual capacity change in sleeping infants using a volume displacement plethysmograph. Eur Respir J 12: 1186–1190, 1998 [DOI] [PubMed] [Google Scholar]


