

Significance
Macrolichens are considered to be well known, including the tropical montane basidiolichen fungus Dictyonema glabratum, also known as Cora pavonia, an important component of threatened paramo ecosystems, where it acts as a biological fertilizer due to its ability to fix atmospheric nitrogen. This lichen was long believed to represent a single species, but after revising this number to 16 in two genera (Cora and Corella), here we show that at least 126 phylogenetically and morphologically distinct species are contained within this group, with statistical analysis predicting more than 400. Our findings underline the importance of accurately documenting species richness for conservation purposes and support the notion of neotropical paramos as hotspots of recent diversification in plants, animals, and fungi.
Keywords: diversification, global diversity prediction, Hygrophoraceae
Abstract
The number of Fungi is estimated at between 1.5 and 3 million. Lichenized species are thought to make up a comparatively small portion of this figure, with unrecognized species richness hidden among little-studied, tropical microlichens. Recent findings, however, suggest that some macrolichens contain a large number of unrecognized taxa, increasing known species richness by an order of magnitude or more. Here we report the existence of at least 126 species in what until recently was believed to be a single taxon: the basidiolichen fungus Dictyonema glabratum, also known as Cora pavonia. Notably, these species are not cryptic but morphologically distinct. A predictive model suggests an even larger number, with more than 400 species. These results call into question species concepts in presumably well-known macrolichens and demonstrate the need for accurately documenting such species richness, given the importance of these lichens in endangered ecosystems such as paramos and the alarming potential for species losses throughout the tropics.
Fungi make up the second largest kingdom, with an estimated number of 1.5–3 million species (1–3). Lichenization plays an important role in fungal evolution, particularly in the Ascomycota, where lichens make up 30% of the currently recognized species (4–6). Transition toward a lichenized lifestyle appears to have taken place at least 10 times in the Ascomycota and 5 times in the Basidiomycota (7–9), but the distribution of lichen formers favors the Ascomycota, with the Basidiomycota accounting for less than 0.3% of all lichenized Fungi (7, 10). Altogether, ∼18,000 lichenized species are currently accepted, but estimates suggest that this represents only 50–65% of the true species richness (4, 6).
Global species richness of lichenized Basidiomycota appears to be especially underestimated. The Dictyonema clade, which includes some of the best-known basidiolichens, until recently was considered to represent five species in a single genus, Dictyonema (11, 12). Subsequent taxonomic and molecular phylogenetic studies suggested that this concept did not reflect the true diversity in this clade (7, 12, 13). Currently, a total of 43 species are recognized in five genera (14, 15). Two genera, Cora and Corella, are foliose macrolichens, with a total of 16 species, corresponding to what was considered a single species, Dictyonema glabratum (11, 12, 16). This name is well known in the scientific community and even among nonspecialists and is included in the Listing of Interesting Plants of the World (17). The 16-fold increase in the number of species now recognized is a striking figure that even surpasses recent findings reported from the large macrolichens Lobariella and Sticta in the Ascomycota (18, 19). The dramatic change in the taxonomic concept of these basidiolichens has important implications for recognizing their role in ecosystem function and as model organisms. Species of Cora abound in tropical montane regions and, with their cyanobacterial photobionts capable of fixing atmospheric nitrogen, serve as biological fertilizers (20). Cora is also one of the best studied lichens in terms of ecomorphology, ecophysiology, and biochemistry (10, 21–28).
Sixteen Species: The Tip of the Iceberg?
The increase from 1 to 16 currently recognized species in Cora and Corella still probably does not adequately encompass the true species richness in this group, given the limited sequence data available until recently (7, 13). For the present study, we assembled a much larger data set of the internal transcribed spacer (ITS) barcoding locus for these two genera, with a total of 376 sequences, which is more than an order of magnitude larger than the most recent phylogenetic study (13). ITS provides a surprising amount of resolution and support in this group, and our analyses, based on topology, support, and correlation with phenotype features, suggest that the total number of species in this dataset is 126, a nearly eightfold increase over the currently recognized 16 species (Fig. 1 and Fig. S1). Single-gene species recognition using a coalescent approach suggests even more species to be present. Single- and multiple-threshold Generalized Mixed Yule Coalescent (GMYC) analysis using the R splits package (29) resulted in 73–84 multisequence and 71–86 singleton species, for a total of 144–170 species recognized in the dataset.
Fig. 1.

Condensed, best-scoring maximum likelihood ITS phylogeny of Cora and Corella. Recognized species are indicated by alternating colors (blue-black for Cora, orange-black for Corella). See Fig. S1 for complete tree with bootstrap support values.
Notably, most of these are not cryptic species recognizable from molecular data only, but morphologically distinct taxa supported by phenotype features, substrate ecology, habitat preferences, and geographical distribution. Many are so distinctive that it is surprising that they have not been recognized before (Fig. 2). The likely explanation is that important features such as color, texture, and substrate are lost in dried herbarium specimens, which makes these lichens a prime example of taxa to be studied in the field. In instances where some of this diversity was acknowledged, it was attributed to infraspecific, habitat-induced variation of a single species (10, 24, 30), but our data show that this is not the case, and the correct interpretation of this variation has dramatic consequences for estimating taxonomic and phylogenetic diversity in this lineage.
Fig. 2.
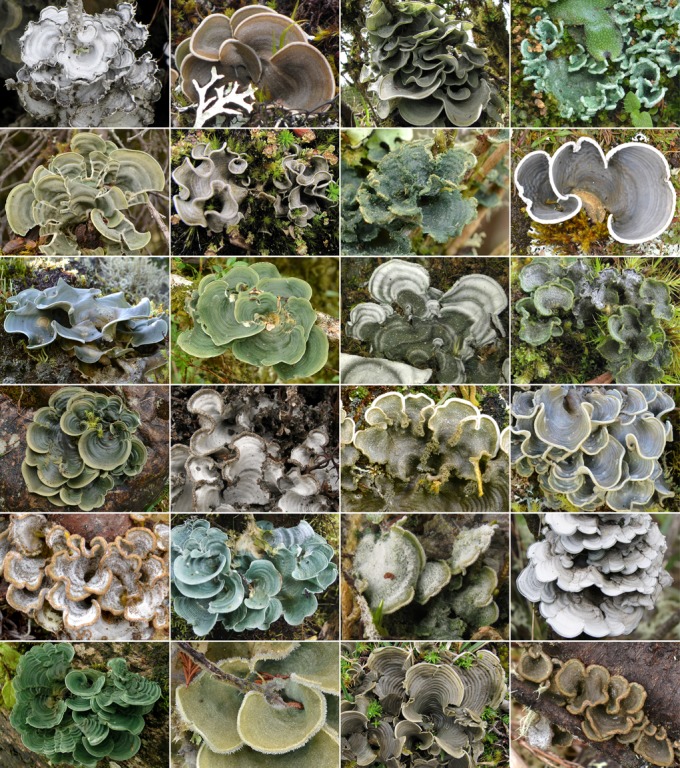
Field photographs of selected species of Cora, showing the remarkable diversity of morphological features. Many of these characters cannot be assessed in herbarium material.
Using a grid map of southern North America to South America that covers almost the entire distribution range of Cora and Corella (Fig. 3), we found that of the 126 recognized species, 101 were sampled within a single grid only. Another 16 taxa were sampled in two to five grids, and only one in more than five grids, suggesting a strong geographic signal and an unexpectedly high level of endemism in a lineage thought to represent a single, widely distributed species. This result does not appear to be a sampling artifact, because the number of sampled specimens was up to 18 per taxon in species found in one grid only and up to 17 per taxon in those found in more than one grid. Rather, it matches frequency patterns found in many other chiefly tropical organisms, with few frequent and many rare and often locally endemic species (31).
Fig. 3.

Grid map of Central and South America and the Caribbean used to predict total species richness of Cora and Corella species. Sampled grids from which sequences were obtained are marked in white. Black grids are those well-sampled with either high observed species richness (51, 153) or documented absence of species (109). Biogeographical regions with presumed high species richness are indicated. Grid numbers range from 1 to 209 and are given in two-digit numbers; after grid 99, grids 00, 01, etc. mean 100, 101, etc.; after second grid 99, grids 00, 01, etc. mean 200, 201, etc.
In addition, the recognition of such a large number of species does not appear to be an artifact of possible gene duplication, as has been suggested for certain fungal lineages (32–36). In a separate analysis of 454 pyrosequencing data obtained from Cora, we found no evidence for ITS paralogs and instead demonstrated that almost all intragenomic variation can be attributed to sequencing errors (37). This assessment is consistent with the observation that the individual clades are morphologically and ecologically distinct.
Not There Yet! Grid-Based Model Predicts 452 Species
Although the number of 126 species in Cora (116) and Corella (10) now recognized is staggering, it may still be far from the actual species richness in this group. The 376 sequenced samples were gathered in only 20 of 209 grids (9%). Only two species-rich grids (1%) could be considered well sampled (Table 1): grid 51 in the Colombian Andes (37 species) and grid 153 in the Atlantic Rain Forest in southeastern Brazil (14 species). These two grids alone account for 51 or nearly half of the species, with 43 species unique to either grid and zero overlap between the two grids. Several grids covering Costa Rica and the Galápagos Islands (41, 42, and 59) could be considered well sampled in terms of available specimens but were set to an intermediate sampling score because only part of the material was recent enough to allow for successful DNA extraction.
Table 1.
Grids with sequenced specimens of Cora and/or Corella, with an additional six well-sampled grids in which presence of these genera could not be demonstrated
| Grid | Political unit | CBS | SS | CS | SO | SP |
| 11 | United States (Florida) | 0 | 2 | 0 | 0 | 1 |
| 20 | Mexico | 2.1 | 1 | 2.1 | 1 | 2 |
| 41 | Costa Rica | 7 | 2 | 14 | 13 | 11 |
| 42 | Costa Rica/Panama | 7.7 | 2 | 15.4 | 9 | 15 |
| 45 | Colombia/Venezuela | 10 | 2 | 20 | 8 | 36 |
| 50 | Colombia | 7 | 2 | 14 | 9 | 11 |
| 51 | Colombia | 10 | 3 | 30 | 37 | 36 |
| 52 | Colombia | 10 | 2 | 20 | 6 | 36 |
| 59 | Galápagos Islands | 3.5 | 2 | 7 | 2 | 3 |
| 60 | Colombia/Ecuador | 10 | 2 | 20 | 8 | 36 |
| 70 | Ecuador/Peru | 10 | 2 | 20 | 16 | 36 |
| 82 | Ecuador/Peru | 10 | 1 | 10 | 1 | 36 |
| 100 | Brazil (Rondonia) | 0 | 2 | 0 | 0 | 1 |
| 101 | Brazil (Rondonia) | 0 | 2 | 0 | 0 | 1 |
| 108 | Brazil (Sergipe) | 2 | 1 | 2 | 1 | 2 |
| 109 | Brazil | 0 | 3 | 0 | 0 | 1 |
| 114 | Brazil/Bolivia | 0 | 2 | 0 | 0 | 1 |
| 115 | Brazil (Rondonia) | 0 | 2 | 0 | 0 | 1 |
| 124 | Peru | 8 | 1 | 8 | 4 | 17 |
| 136 | Peru/Bolivia | 8 | 2 | 16 | 11 | 17 |
| 153 | Brazil | 8 | 3 | 24 | 14 | 17 |
| 162 | Brazil | 3.5 | 2 | 7 | 7 | 3 |
| 169 | Brazil | 6 | 2 | 12 | 4 | 8 |
| 170 | Brazil | 3.5 | 1 | 3.5 | 4 | 3 |
| 177 | Brazil | 2.8 | 1 | 2.8 | 1 | 3 |
| 208 | Chile/Argentina | 0.7 | 1 | 0.7 | 1 | 1 |
CBS, corrected biome score (taking into account biome diversity, suitability for occurrence of Cora and Corella, and substantial presence of ocean surface); CS, combined score; SO, species observed; SP, species predicted; SS, sampling score (for molecular phylogenetic analysis). All other grids were not sampled and had zero species observed and one species predicted per grid.
Nonlinear estimation between grid species number, Tgrid, and a combined score of grid biome diversity, Bgrid, and grid sampling effort, Egrid, resulted in a strongly and significantly correlated regression model: Tgrid = 0.52 + e(–0.34 + 0.13 × Bgrid × Egrid) (r = 0.95, P = 0.0000; proportion of variance explained = 91%). We used this model to predict species numbers for each of the 209 grids assuming optimal sampling effort by setting the sampling score, Egrid, to the maximum (maximum score = 3) for each grid. This approach resulted in predicted species numbers per grid ranging between 1 and 36 (Table 1), for a total grid sum, Gtotal, of 1,201 species. The highest species number per grid (36) was predicted for 12 grids and the second highest (17) for 13 grids, for a total of 25 high-richness grids. Low-richness grids included 69 grids with one species per grid; zero species were not predicted for any grid, even if one well-sampled grid yielded zero species. High-richness grids were concentrated in the northern and southern tropical Andes, northern Central America, and the southern Atlantic Rainforest; low-richness grids were mostly found in areas with dominance of lowland rain forest, savanna, or semiarid vegetation. All high-richness grids included either paramo or (mixed) montane or cloud forest vegetation.
Total species number for the target area, Ttotal, is a function of total grid sum, Gtotal, and average distribution of species across grids, Daverage: Ttotal = Gtotal/Daverage. This formula is based on Whittaker's (38) definition of beta diversity or species turnover, originally defined through the following formula: gamma diversity = average alpha diversity × beta diversity. Beta diversity is then inversely proportional to Daverage through the following formula: beta diversity = number of grids/Daverage. Based on the data from the 26 sampled grids (Table 1), observed Daverage was 1.21 grids per species, which would result in Ttotal = 1,201/1.21 = 993 predicted species for the target area. However, because additional data will not only add further species but will increase grid distribution per species, we first used grid interpolation to correct for this bias. For example, if a paramo species was sampled in grids 45, 50, 51, and 136 (four grids), it should also be present in grids with paramo vegetation located in between these grids (additional seven grids). Using this technique, Daverage increased to 1.42 grids per species, for a predicted total species richness Ttotal = 1,201/1.42 = 846 species. We still considered this an overestimate, because interpolation does not account for possible range extensions of species outside the observed grid area. Therefore, we used an even more conservative approach to estimate Daverage.: for the 26 sampled grids, we computed predicted species grid sum G26 assuming maximum sampling effort. We then took the observed species number for these grids (126), conservatively assuming that complete sampling would not add any new species, and assumed this to be the same as the total number of predicted species, T26. Average grid distribution per species was then computed as D26 = G26/T26. = 335/126 = 2.66.
Using this value, the prediction for the total number of species for the entire grid map resulted in Ttotal = 1,201/2.66 = 452 taxa in Cora and Corella. This number would be a further remarkable increase from the 126 species recognized in our current phylogeny and an unthinkably dramatic increase from a single species, D. glabratum, accepted until a decade ago (11, 12, 16). With more than 400 species, Cora would become one of the largest genera of lichenized Fungi. It would also be the first large genus among any group of Fungi almost entirely elucidated “from scratch” using molecular sequence data.
How Realistic Is This Prediction?
Until 10 y ago, the scientific community was unaware that D. glabratum represented at least 16 different species in two genera (13, 15). No one could have anticipated that this number would rise to 126 species in our current dataset and even up to 170 species using a coalescent-based species recognition method. Hence, a figure of 452 predicted species does not seem out of the realm of possibility, considering that our current data are still based on very limited sampling effort. The extreme alternative would be to assume that additional sampling would not add any new species. Because the model predicting Tgrid is statistically supported and Ttotal is comparatively robust against variation in Tgrid, the prediction of Ttotal largely depends on the reliable estimation of Daverage. Using a conservative approach, we estimated this value at 2.66. To result in a value of Ttotal equal to the currently observed species richness (126), Daverage would have to be 1,201/126 = 9.53. Based on the frequency distribution using grid interpolation, with Daverage = 1.42, simple correction of observed frequency values by the factor 9.53/1.42 = 6.71 would require the most frequent species to occur in at least 74 grids. Because species of Cora and Corella are usually confined to a single type of vegetation (e.g., paramo), occurrence in at least 74 grids for the most frequent species would be unlikely given that the number of grids with vegetation that supports high species richness is much lower. For instance, there are only 20 grids that include paramo vegetation, where most of the Andean species are found, and 44 grids with mixed montane forest vegetation, where most of the southern Brazilian species are found. Mixed montane forest is disjunct between Mexico, the Caribbean, and southern Brazil, and species characteristic of this vegetation would be expected to occur in a subset of these grids only. Hence, assuming that species can occupy a maximum number of grids based on their ecology and setting this number to ∼20–22 grids (entire paramo area or mixed montane forest divided into two disjunct regions), the estimated value for Daverage based on observed frequencies (maximum = 11 grids) would be (20–22) × 1.42/11 = 2.58–2.84, which is consistent with the value of 2.66 used here.
Our prediction can also be evaluated by examining patterns of species richness within and between grids of the same ecoregion. The species-rich grid 51 (northern Andes, Colombia), with 37 species, represents seven well-sampled sites including paramos and subandine cloud forest. These sites are roughly situated along a line from north to south and extending about 130 km, with 10 km width, all near the capital, Bogotá. Considering the grid size of ∼370 × 370 km2, the actually sampled area covers less than 1% of the entire grid. The mean number of species observed at each site ranged from 5 to 16, and species turnover between adjacent sites was between 44% and mostly 100%, with cumulative turnover showing an almost straight, ascending line with little sign of saturation (Fig. 4). The same pattern was found at grid scale. Comparing grid 51 with grids 50 and 52 in the same ecoregion, species turnover was substantial: 80% toward grid 50 and 83% toward grid 52. Turnover between adjacent grids going south from grid 50 to grid 82 was uniformly 100%. A similar pattern was observed between grids 153, 162, 169, and 170 in southeastern Brazil: 86% turnover from grids 153 to 162, 75% between grids 162 and 169, and 50% between grids 169 and 170. Thus, it appears that increased collection effort will not simply extend distribution ranges for known species. Instead, there appears to be considerable local geographic differentiation and endemism, confirming findings from other organisms (31).
Fig. 4.

Species-area curve reconstructed through randomized subsampling of seven sites within grid 51. All sites are found along a narrow, north-south oriented band 130 × 10 km near the capital, Bogotá.
Our approach also allows us to predict where unrecognized species might be found. Nearly 50% of the identified taxa originate from only two grids in the northern Andes and southeastern Brazil. These two grids amount to only 1% of the target area and represent only two of seven major ecogeographical regions that can be expected to harbor a high number of species of Cora and Corella: the northern Andes and the southern Atlantic Rainforest (Fig. 1). The other five regions, which have only barely been sampled using molecular techniques for these taxa, are as follows: (i) Central America (Mexico south to Costa Rica), (ii) the Caribbean, (iii) the Guiana shield (eastern Venezuela to French Guiana and northern Brazil), (iv) the southern tropical Andes (Ecuador to Bolivia), and (v) the southern extratropical Andes south to Patagonia (Chile and Argentina). Indeed we have evidence for a number of morphologically distinct species from these regions for which currently no molecular data are available, especially from Costa Rica (grids 41 and 42). Notably, this includes the type material of the two names most used historically for this group: Cora glabrata (from Guadeloupe) and C. pavonia (from Jamaica). Because our study focused entirely on species supported by molecular data, these additional taxa did not enter the analysis.
Discussion
To the best of our knowledge, the recognition of at least 126 species, with a predicted number of 452, in what until recently was believed to be a single, widespread species, is the most spectacular case of unrecognized species richness in any group of macroorganisms. Our result is especially striking considering that these are conspicuous macrolichens well known to the scientific community, having been used in numerous environmental, ecophysiological, chemical, and ultrastructural studies (10, 20–28). Until recently, it was believed that unrecognized species in lichenized Fungi would most likely be found among little-studied tropical microlichens, and it was predicted that the number of missing species is less than the number of already known species (6). However, studies in families such as the Parmeliaceae and Lobariaceae suggest that macrolichens are a source of considerable, unrecognized species richness (18, 19, 39, 40).
Notably, most of these macrolichens are not hidden in tropical rain forests but mostly thrive in tropical montane, wet climates such as paramos, suggesting that these biomes are cradles of substantial diversification that occurred recently in geological time. Indeed, paramos have been characterized as “... the world's fastest evolving and coolest biodiversity hotspot” (41). This notion is based on evolutionary patterns found in vascular plants, such as the enigmatic frailejones, species of the genus Espeletia in the family Asteraceae, but our data suggest that macrolichens might surpass even the fastest-evolving vascular plants in diversification rates. Molecular dating estimates the stem node of Cora at 15 Mya and the crown node at 13 Mya (42), which implies that clades with predominantly Andean distribution, containing the bulk of the species currently recognized, evolved and diversified with the uplift of the Andes (43–45). This finding highlights the critical conservation status of paramos with regard to preservation of species richness and the consideration of lichens due to their ecosystem functions as biofertilizers and water supply regulators (46–48). Preservation of organismic diversity requires not only information about known diversity, but also predictions of unrecognized diversity at a global level. Our approach provides a way of identifying groups that harbor undescribed species and the potential number of species they contain and where to focus future sampling efforts to properly catalog this unrecognized diversity.
Methods
Material and Assessment of Phenotype Characters.
ITS fungal barcoding sequences were obtained from a total of 356 new samples of Cora and Corella collected throughout Central and South America (Table S1). Where possible, samples were documented in the field using high-quality photographs to record potentially important phenotype features. Dried samples were studied in the herbarium using a standardized matrix of 186 characters to assess phenotypic variation, including morphology, internal anatomy, and secondary chemistry (15).
Molecular Sequencing and Phylogenetic Analysis.
Genomic DNA was extracted from lichenized thalli, and ITS sequences were generated via Sanger sequencing following previously published protocols (13). Samples that did not yield high-quality Sanger sequences were subjected to 454 pyrosequencing to obtain sequences of the target mycobiont (37). Newly generated sequences were assembled with sequences from GenBank and aligned with MAFFT using the auto option (49) and then manually corrected, resulting in an alignment length of 822 bases. The dataset was subjected to a maximum likelihood (ML) search using RAxML 7.2.6 on the Cipres Science Gateway server (50, 51), with parametric bootstrapping using 500 replicates under the GTRGAMMA model. Both alignment and best-scoring tree file with branch lengths and bootstrap support values were submitted to TreeBASE (accession no. 15783).
Single-Gene Species Recognition.
We used GMYC in the splits package for R for phylogenetic species recognition, using both the single and multiple threshold approach (29). The ultrametric tree was reconstructed using a relative molecular clock in BEAST 1.7.5 (52), with the following specifications: the general time-reversible substitution model with base frequencies estimated and Gamma and invariant sites with six Gamma categories; speciation through a Yule process with the “yule.birthRate” prior set to an exponential distribution with 4.0 as mean; and the “ucld.mean” prior (mean substitution rate) set to an exponential distribution with 0.001 as mean. Estimation of priors was approximated by first running a strict clock and using the “meanRate” posterior estimates as prior for a second run applying a relaxed clock, with all other priors set to default values, and then a third, final run, using the posterior estimates from the second run for “ucld.mean” and “yule.birthRate” as priors. All runs were performed with 10 million generations on the Cipres Science Gateway server (51).
Prediction of Total Species Richness.
We generated a grid map of the target area, using a grid width of 10° subdivided into three grids each (3.33°), resulting in 209 grids of ∼370 km width and 300–370 km height depending on distance to the equator (Fig. 1). For each grid, we determined the number of biomes present.* Each biome received a score approximately proportional to the number of species of Cora and Corella found in this biome type in our dataset, taking the values of 0 (desert, thornbush, dry forest, lowland grassland and savanna, lowland rain forest), 1 (tundra, temperate forest, cerrado), 2 (temperate rain forest, mixed montane forest including pine forests in Mexico and Araucaria forests in southern Brazil, montane rain forest), 3 (cloud forest, puna), and 5 (wet paramo), and for each grid, the total score was determined by adding individual scores of biomes present. To adjust grids in which more than half of the area was ocean, a correcting factor of 0.7 was applied. For each grid, we set a sampling score, ranging from 0 (not sampled), to 1 (random opportunistic sampling of single sites), 2 (intermediate), and 3 (systematic sampling of more than three sites). The sampling score referred only to material for which we could obtain sequence data and not to the overall sampling effort, because material older than 2 y will usually not yield good DNA extracts. A combined biome-sampling score was then calculated by multiplying the biome score (corrected for ocean-containing grids) with the sampling score (Table S2).
We calculated the number of observed species for each sampled grid, for 26 grids in total (the other 183 grids did not contain sequenced samples). A nonlinear model between species number and biome-sampling score per grid was computed in STATISTICA 6.0, using exponential growth regression with the Quasi-Newton as estimation method, a maximum of 50 iterations, and 0.00099 as the convergence criterion. This model was used to predict species numbers per grid by setting the sampling score to maximum (3). To predict the total number of species, Ttotal, for the entire grid map, we made use of the fact that Ttotal is a function of the sum of species totals for all grids, Gtotal, and the average number of grids Daverage in which a species was found: Ttotal = Gtotal/Daverage. Although Gtotal is calculated from the number of predicted species per grid, Daverage can be estimated from the data, as further explained previously.
We reconstructed species-area curves in PC-ORD 6.0 (53) based on randomized subsampling, with Sørensen as a distance measure, to document patterns of species diversity within grids and between adjacent grids belonging to the same ecoregion. For that, we assembled a species (based on the phylogenetic tree) by sampling site (subdivision of each grid) matrix for the grid that contained the greatest number of species (grid 51 in the northern Andes in Colombia) and also compared adjacent grids 50–52 in the northern Andes and grids 153–162 and 169–170 in the Atlantic Rain Forest in southeastern Brazil.
Supplementary Material
Acknowledgments
The following colleagues are thanked for providing material or assisting with fieldwork: A. Beck, F. Beilke, W. R. Buck, R. S. Egan, S. Eliasaro, J. Farfan, A. Gerlach, E. Gumboski, J. E. Hernández, L. Herrera, M. A. Herrera-Campos, H. Jonitz, M. Kukwa, M. P. Marcelli, S. A. Martins, E. Navarro, F. Nugra, T. Paredes, C. Plaza, F. Quesada, A. A. Spielmann, A. Suárez, L. Vargas, Z. Vela, and K. Wilk. Ekaphan Kraichak is thanked for advice with using the splits package in R and for providing supplemental code. We are indebted to the Galápagos National Park, especially its technical director, Washington Tapia, for support and specimen export permits. Financial support for this study was provided by National Science Foundation Grant DEB-0841405 to George Mason University: “Phylogenetic Diversity of Mycobionts and Photobionts in the Cyanolichen Genus Dictyonema, with Emphasis on the Neotropics and the Galapagos Islands” (principal investigator, J.D.L.; co-principal investigators, R.L. and P.M.G.; local coordinator for Galápagos, F.B.). Material was also collected as part of National Science Foundation Grant DEB-0715660 to The Field Museum: “Neotropical Epiphytic Microlichens—An Innovative Inventory of a Highly Diverse yet Little Known Group of Symbiotic Organisms” (principal investigator, R.L.) and DEB-0206125 to The Field Museum: “TICOLICHEN” (principal investigator, R.L.), as well as two lichen courses as part of the Organization for Tropical Studies (OTS) specialty courses syllabus. This publication is Contribution 2093 of the Charles Darwin Foundation for the Galapagos Islands.
Footnotes
The authors declare no conflict of interest.
This article is a PNAS Direct Submission.
Data deposition: The sequences reported in this paper have been deposited in the GenBank database (see Table S1 for accession nos.). Sequence alignment and tree file are available from TreeBASE, http://treebase.org (Study ID no. 15783).
This article contains supporting information online at www.pnas.org/lookup/suppl/doi:10.1073/pnas.1403517111/-/DCSupplemental.
Fedorova IT, Volkova YA, Varlyguin DL (1994) World vegetation cover. Digital raster data on a 30-minute Cartesian orthonormal geodetic (lat/long) 1080x2160 grid. Formerly available at www.ngdc.noaa.gov/ecosys/cdroms/ged_iib/datasets/b01/fvv.htm. The link used to access this database is no longer active. The US National Oceanic and Atmospheric Administration provides a statement, dated January 19, 2012, regarding the availability of this database at www.nesdis.noaa.gov/NoticeOfChanges.html#ged.
References
- 1.Hawksworth DL. The magnitude of fungal diversity: The 1.5 million species estimate revisited. Mycol Res. 2001;105(12):1422–1432. [Google Scholar]
- 2.Hawksworth DL. Global species numbers of fungi: Are tropical studies and molecular approaches contributing to a more robust estimate? Biodiv Cons. 2012;21(9):2425–2433. [Google Scholar]
- 3.Blackwell M. The fungi: 1, 2, 3...5.1 million species? Am J Bot. 2011;98(3):426–438. doi: 10.3732/ajb.1000298. [DOI] [PubMed] [Google Scholar]
- 4.Feuerer T, Hawksworth DL. Biodiversity of lichens, including a world-wide analysis of checklist data based on Takhtajan's floristic regions. Biodiv Cons. 2007;16(1):85–98. [Google Scholar]
- 5.Kirk PM, Cannon PF, Minter DW, Stalpers JA. Dictionary of the Fungi. 10th Ed. Wallingford, UK: CAB International; 2008. [Google Scholar]
- 6.Lücking R, Rivas-Plata E, Chavez JL, Umaña L, Sipman HJM. How many tropical lichens there are…really? Bibl Lichenol. 2009;100:399–418. [Google Scholar]
- 7.Lawrey JD, et al. High concentration of basidiolichens in a single family of agaricoid mushrooms (Basidiomycota: Agaricales: Hygrophoraceae) Mycol Res. 2009;113(10):1154–1171. doi: 10.1016/j.mycres.2009.07.016. [DOI] [PubMed] [Google Scholar]
- 8.Nelsen MP, et al. Unravelling the phylogenetic relationships of lichenised fungi in Dothideomyceta. Stud Mycol. 2009;64:135–144, S4. doi: 10.3114/sim.2009.64.07. [DOI] [PMC free article] [PubMed] [Google Scholar]
- 9.Schoch CL, et al. A class-wide phylogenetic assessment of Dothideomycetes. Stud Mycol. 2009;64:1–15, S10. doi: 10.3114/sim.2009.64.01. [DOI] [PMC free article] [PubMed] [Google Scholar]
- 10.Oberwinkler F. 2012. Basidiolichens. The Mycota, ed Hock B (Springer, Berlin), 2nd Ed, Vol IX, pp 341–362.
- 11.Parmasto E. The genus Dictyonema (‘Thelephorolichenes’) Nova Hedwigia. 1978;29(1-2):99–144. [Google Scholar]
- 12.Chaves JL, Lücking R, Sipman HJM, Umaña L, Navarro E. A first assessment of the Ticolichen biodiversity inventory in Costa Rica, the genus Dictyonema (Polyporales, Atheliaceae) Bryologist. 2004;107(2):242–247. [Google Scholar]
- 13.Dal-Forno M, et al. Starting from scratch: Evolution of the lichen thallus in the basidiolichen Dictyonema (Agaricales: Hygrophoraceae) Fungal Biol. 2013;117(9):584–598. doi: 10.1016/j.funbio.2013.05.006. [DOI] [PubMed] [Google Scholar]
- 14.Yánez A, Dal-Forno M, Bungartz F, Lücking R, Lawrey JD. A first assessment of Galapagos basidiolichens. Fung Div. 2012;52(1):225–244. [Google Scholar]
- 15.Lücking R, et al. Ten new species of lichenized Basidiomycota in the genera Dictyonema and Cora (Agaricales, Hygrophoraceae) Phytotaxa. 2013;139(1):1–38. [Google Scholar]
- 16.Hawksworth DL. A new name for Dictyonema pavonium (Swartz) Parmasto. Lichenologist. 1988;20(1):101. [Google Scholar]
- 17. Rural Industries Research and Development Corporation (2012) The Australian New Crops. Available at http://newcrops.com.au. Accessed January 12, 2013.
- 18.Moncada B, Lücking R, Betancourt-Macuase L. Phylogeny of the Lobariaceae (lichenized Ascomycota: Peltigerales), with a reappraisal of the genus Lobariella. Lichenologist. 2013;45(2):203–263. [Google Scholar]
- 19.Moncada B, Lücking R, Suárez A. Molecular phylogeny of the genus Sticta (lichenized Ascomycota: Lobariaceae) in Colombia. Fung Div. 2014;64(1):205–231. doi: 10.15517/rbt.v62i1.3564. [DOI] [PubMed] [Google Scholar]
- 20.Fritz-Sheridan RP. Nitrogen fixation on a tropical volcano, La Soufriere, nitrogen fixation by the pioneer lichen Dictyonema glabratum. Lichenologist. 1988;20(1):96–100. [Google Scholar]
- 21.Mitidieri J, Joly S, Ferraz EC. Teste de antibiose exercida pelo extrato do liquens Parmelia tinctorum Desp. e Cora pavonia (Web.) E. Fries. Rev Agron (Piracicaba) 1964;39:119–121. [Google Scholar]
- 22.Coxson DS. Net photosynthetic response patterns of the basidiomycete lichen Cora pavonia (Web.) E. Fries from the tropical volcano La Soufriere (Guadeloupe) Oecologia. 1987;73(3):454–458. doi: 10.1007/BF00385264. [DOI] [PubMed] [Google Scholar]
- 23.Iacomini M, Zanin SMW, Fontana JD. Isolation and characterization of B-D-glucan, heteropolysaccharide, and trehalose components of the basidiomycetous lichen Cora pavonia. Carbohydr Res. 1987;168(1):55–65. [Google Scholar]
- 24.Larcher W, Vareschi V. Variation in morphology and functional traits of Dictyonema glabratum from contrasting habitats in the Venezuelan Andes. Lichenologist. 1988;20(3):269–277. [Google Scholar]
- 25.Lange OL, Büdel B, Zellner H, Zotz G, Meyer A. Field measurements of water relations and CO2 exchange of the tropical, cyanobacterial basidiolichen Dictyonema glabratum in a Panamanian rainforest. Bot Acta. 1994;107(5):279–290. [Google Scholar]
- 26.Thomas MA, Nash TH, III, Gries C. Ecophysiological comparison of two tropical/subtropical lichen species, Dictyonema glabratum from an alpine habitat and Coenogonium interplexum from a lowland forest. Bibl Lichenol. 1997;67:183–195. [Google Scholar]
- 27.Trembley ML, Ringli C, Honegger R. Hydrophobins DGH1, DGH2, and DGH3 in the lichen-forming basidiomycete Dictyonema glabratum. Fungal Genet Biol. 2002;35(3):247–259. doi: 10.1006/fgbi.2001.1325. [DOI] [PubMed] [Google Scholar]
- 28.Carbonero ER, Sassaki GL, Gorin PAJ, Iacomini M. A (1—>6)-linked beta-mannopyrananan, pseudonigeran, and a (1—>4)-linked beta-xylan, isolated from the lichenised basidiomycete Dictyonema glabratum. FEMS Microbiol Lett. 2002;206(2):175–178. doi: 10.1111/j.1574-6968.2002.tb11005.x. [DOI] [PubMed] [Google Scholar]
- 29.Fujisawa T, Barraclough TG. Delimiting species using single-locus data and the Generalized Mixed Yule Coalescent approach: A revised method and evaluation on simulated data sets. Syst Biol. 2013;62(5):707–724. doi: 10.1093/sysbio/syt033. [DOI] [PMC free article] [PubMed] [Google Scholar]
- 30.Möller A. Ueber die eine Thelephoree, welche die Hymenolichenen, Cora, Dictyonema und Laudatea bildet. Flora. 1893;77:254–278. [Google Scholar]
- 31.Jost L, et al. Partitioning diversity for conservation analyses. Div Distr. 2010;16:65–76. [Google Scholar]
- 32.Ko KS, Jung HS. Three nonorthologous ITS1 types are present in a polypore fungus Trichaptum abietinum. Mol Phylogenet Evol. 2002;23(2):112–122. doi: 10.1016/S1055-7903(02)00009-X. [DOI] [PubMed] [Google Scholar]
- 33.Gomes EA, Kasuya MCM, De Barros EG, Borges AC, Araujo EF. Polymorphism in the internal transcribed spacer (ITS) of the ribosomal DNA of 26 isolates of ectomycorrhizal fungi. Genet Mol Biol. 2002;25(4):477–483. [Google Scholar]
- 34.Simon UK, Weiss M. Intragenomic variation of fungal ribosomal genes is higher than previously thought. Mol Biol Evol. 2008;25(11):2251–2254. doi: 10.1093/molbev/msn188. [DOI] [PubMed] [Google Scholar]
- 35.Lindner DL, Banik MT. Intragenomic variation in the ITS rDNA region obscures phylogenetic relationships and inflates estimates of operational taxonomic units in genus Laetiporus. Mycologia. 2011;103(4):731–740. doi: 10.3852/10-331. [DOI] [PubMed] [Google Scholar]
- 36.Li Y, Jiao L, Yao YJ. 2013. Non-concerted ITS evolution in fungi, as revealed from the important medicinal fungus Ophiocordyceps sinensis. Mol Phylogen Evol 68(2):373–379.
- 37.Lücking R, et al. Multiple ITS haplotypes in the genome of the lichenized basidiomycete Cora inversa (Hygrophoraceae): Fact or artifact? J Mol Evol. 2014;78(2):148–162. doi: 10.1007/s00239-013-9603-y. [DOI] [PubMed] [Google Scholar]
- 38.Whittaker RH. Vegetation of the Siskiyou Mountains, Oregon and California. Ecol Monogr. 1960;30(3):279–338. [Google Scholar]
- 39.Crespo A, Lumbsch HT. Cryptic species in lichen-forming fungi. IMA Fungus. 2010;1(2):167–170. doi: 10.5598/imafungus.2010.01.02.09. [DOI] [PMC free article] [PubMed] [Google Scholar]
- 40.Kroken S, Taylor JW. A gene genealogical approach to recognize phylogenetic species boundaries in the lichenized fungus Letharia. Mycologia. 2001;93(1):38–53. [Google Scholar]
- 41.Madriñán S, Cortés AJ, Richardson JE. Páramo is the world’s fastest evolving and coolest biodiversity hotspot. Front Genet. 2013;4:192. doi: 10.3389/fgene.2013.00192. [DOI] [PMC free article] [PubMed] [Google Scholar]
- 42.Lücking R. 2012. One species is many: Unrecognized levels of diversification of tropical macrolichens in neotropical paramos. Proceedings of the 49th Annual Meeting of the Association for Tropical Biology and Conservation, S03.OC.01 (abstr). Available at www.eventus.com.br/atbc2012/ATBC.zip (S03OC01.pdf). Accessed June 19, 2014.
- 43.Gregory-Wodzicki KM. Andean paleoelevation estimates: A review and critique. Geol Soc Am Bull. 2002;112(7):1091–1105. [Google Scholar]
- 44.Meade BJ, Conrad CP. Andean growth and the deceleration of South American subduction: time evolution of a coupled orogen-subduction system. Earth Planet Sci Lett. 2008;275(1-2):93–101. [Google Scholar]
- 45.Hoorn C, et al. Amazonia through time: Andean uplift, climate change, landscape evolution, and biodiversity. Science. 2010;330(6006):927–931. doi: 10.1126/science.1194585. [DOI] [PubMed] [Google Scholar]
- 46.Luteyn JL. Páramos: A Checklist of Plant Diversity, Geographical Distribution, and Botanical Literature. New York: The New York Botanical Garden Press; 1999. [Google Scholar]
- 47.Crespo P, et al. 2010. Land use change impacts on the hydrology of wet Andean páramo ecosystems. Status and Perspectives of Hydrology in Small Basins, eds Herrmann A, Holko L, Schumann SA (International Association of Hydrological Sciences, Wallingford, UK), pp 1–6.
- 48.De Brievre B, Calle T. The Andean Paramo Project: Conserving biodiversity and hydrological services on the roof of the Andes. Mountain Forum Bull. 2011;2011:1–6. [Google Scholar]
- 49.Katoh K, Kuma K, Toh H, Miyata T. MAFFT version 5: Improvement in accuracy of multiple sequence alignment. Nucleic Acids Res. 2005;33(2):511–518. doi: 10.1093/nar/gki198. [DOI] [PMC free article] [PubMed] [Google Scholar]
- 50.Stamatakis A. RAxML-VI-HPC: Maximum likelihood-based phylogenetic analyses with thousands of taxa and mixed models. Bioinformatics. 2006;22(21):2688–2690. doi: 10.1093/bioinformatics/btl446. [DOI] [PubMed] [Google Scholar]
- 51.Miller MA, Pfeiffer W, Schwartz T. 2010. Creating the CIPRES Science Gateway for inference of large phylogenetic trees. Proceedings of the Gateway Computing Environments Workshop (Institute of Electrical and Electronics Engineers, New Orleans), pp 1–8.
- 52.Drummond AJ, Rambaut A. BEAST: Bayesian evolutionary analysis by sampling trees. BMC Evol Biol. 2007;7:214. doi: 10.1186/1471-2148-7-214. [DOI] [PMC free article] [PubMed] [Google Scholar]
- 53.McCune B, Mefford MJ. PC-ORD. Multivariate Analysis of Ecological Data, Version 4.0. Gleneden Beach, OR: MjM Software; 1999. [Google Scholar]
Associated Data
This section collects any data citations, data availability statements, or supplementary materials included in this article.