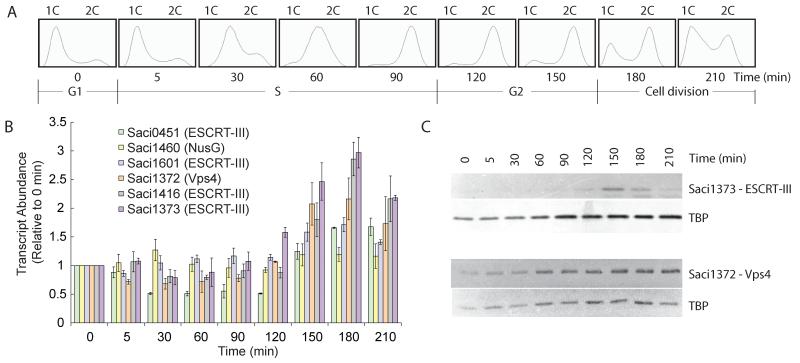
Fig. 1.
(A) Flow cytometric analysis of samples taken at the indicated time points during the progression of a synchronised culture of S. acidocaldarius. The positions of peaks corresponding to one chromosome content (1C) and 2C genome contents are indicated. The cell-cycle stages are indicated at the bottom.
(B) Real-time PCR measurements of transcript abundance of the indicated ESCRT-III homologs, Vps4 and a housekeeping control (the nusG transcription elongation factor). Experiments were performed in triplicate, and the standard deviation (SD) is indicated by the error bars. All samples were normalised to the level detected at 0 min.
(C) Western blot analysis of the levels of Saci1373 (ESCRT-III), Vps4 and the general transcription factor TATA box binding protein (TBP) proteins across the cell cycle. Samples were taken at the indicated times during the growth of synchronised S. acidocaldarius cultures.

