Abstract
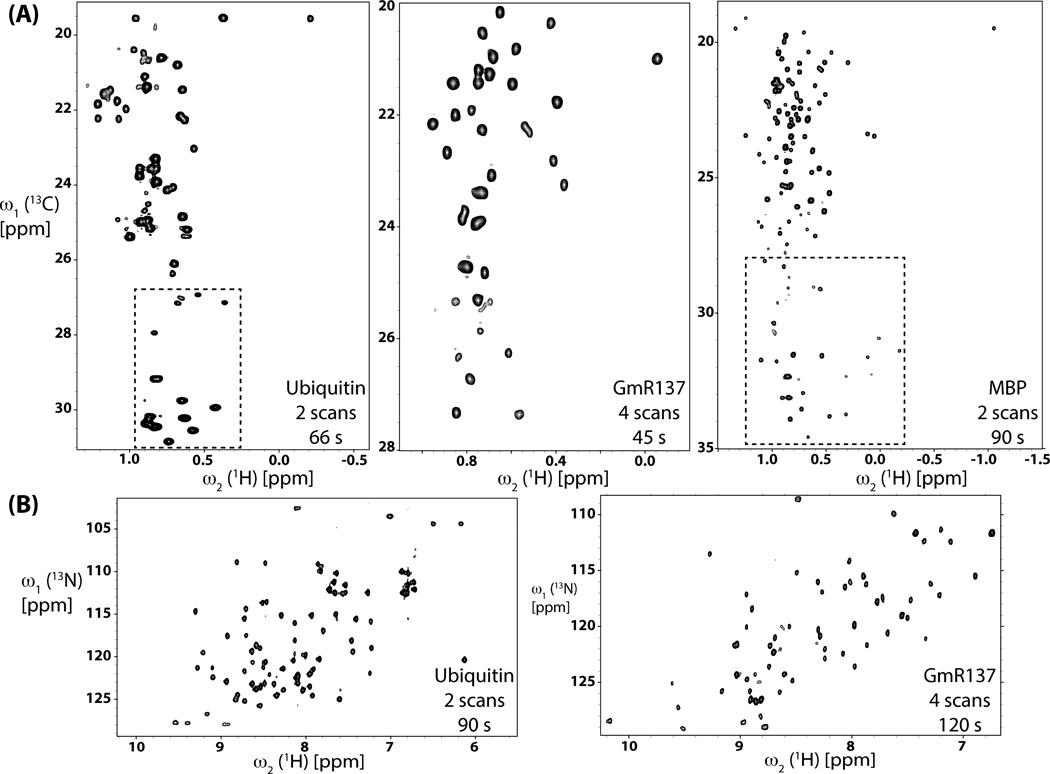
Spatially selective heteronuclear multiple-quantum coherence (SS HMQC) NMR spectroscopy was devised for solution studies of proteins. Due to ‘time-staggered’ acquisition of free induction decays (FIDs) in different slices, SS HMQC allows one to employ long delays for longitudinal nuclear spin relaxation at high repetition rates for the acquisition of the FIDs. To also achieve high intrinsic sensitivity, SS HMQC was implemented by combing a single spatially selective 1H excitation pulse with non-selective 1H 180° pulses. High-quality spectra could be obtained within 66 seconds for a 7.6 kDa uniformly 13C,15N-labeled protein, and within 45 and 90 seconds for, respectively, two uniformly 2H,13C,15N-labeled but isoleucine, leucine and valine methyl group protonated proteins with molecular weights of 7.5 and 43 kDa.
Keywords: rapid data acquisition, spatially selective NMR, time staggered data acquisition, flip-back pulses, HMQC
Introduction
The ever increasing sensitivity of NMR spectrometers[1] has fostered the development of a large number of fast approaches to acquire multi-dimensional NMR spectra[2]. In turn, this enables researchers to obtain the desired information rapidly: (i) NMR-based structural and dynamic atomic resolution studies can be pursued with reduced demand of spectrometer time[3] and (ii) time-resolved studies can be designed with higher time resolution, that is, faster processes become amenable to ‘real time’ observation by NMR[4].
Three and higher-dimensional spectra can be acquired rapidly by jointly sampling several (i.e., at least two) indirect evolution periods using (i) reduced-dimensionality[5] (RD) or (ii) G-matrix FT (GFT) projection NMR[6] along with its derivatives ‘projection reconstruction’ and ‘automated projection NMR Spectroscopy’[7]. Other approaches can be employed even for the single indirect dimension in two-dimensional (2D) NMR spectroscopy. Those include (i) non-uniform or severely truncated time domain sampling combined with non-FT based spectral processing[8] (maximum entropy, MDD, compressed sensing, co-variance processing), (ii) longitudinal relaxation (L-) optimization[9] allowing for a significant reduction of the relaxation delay between scans, (iii) Hadamard spectroscopy[10] relying on the use of arrays of selective radio-frequency (r.f.) pulses employed with relative signs as encoded in Hadamard matrices, and (iv) ultrafast NMR[4b], where chemical shift evolution in the indirect dimension is spatially encoded such that frequency domain signals can be obtained by applying a ‘read-out’ pulsed field gradient (PFG) during signal detection in the direct dimension.
The development of Ultrafast NMR, which relies on spatiotemporal encoding of the evolution of indirect chemical shifts followed by their repetitive decoding / re-encoding during the signal detection in the direct dimension, allows recording of multi-dimensional spectra in a single scan. In turn, Ultrafast NMR stimulated the implementation of a variety of other experiments taking advantage of the fact that r.f pulses become spatially selective when applied concomitantly with PFGs of suitable strength. The major challenge associated with ultrafast NMR arises from the necessity to apply ‘read out PFGs’ during signal detection: those greatly reduce intrinsic sensitivity and may also impact line-shapes.
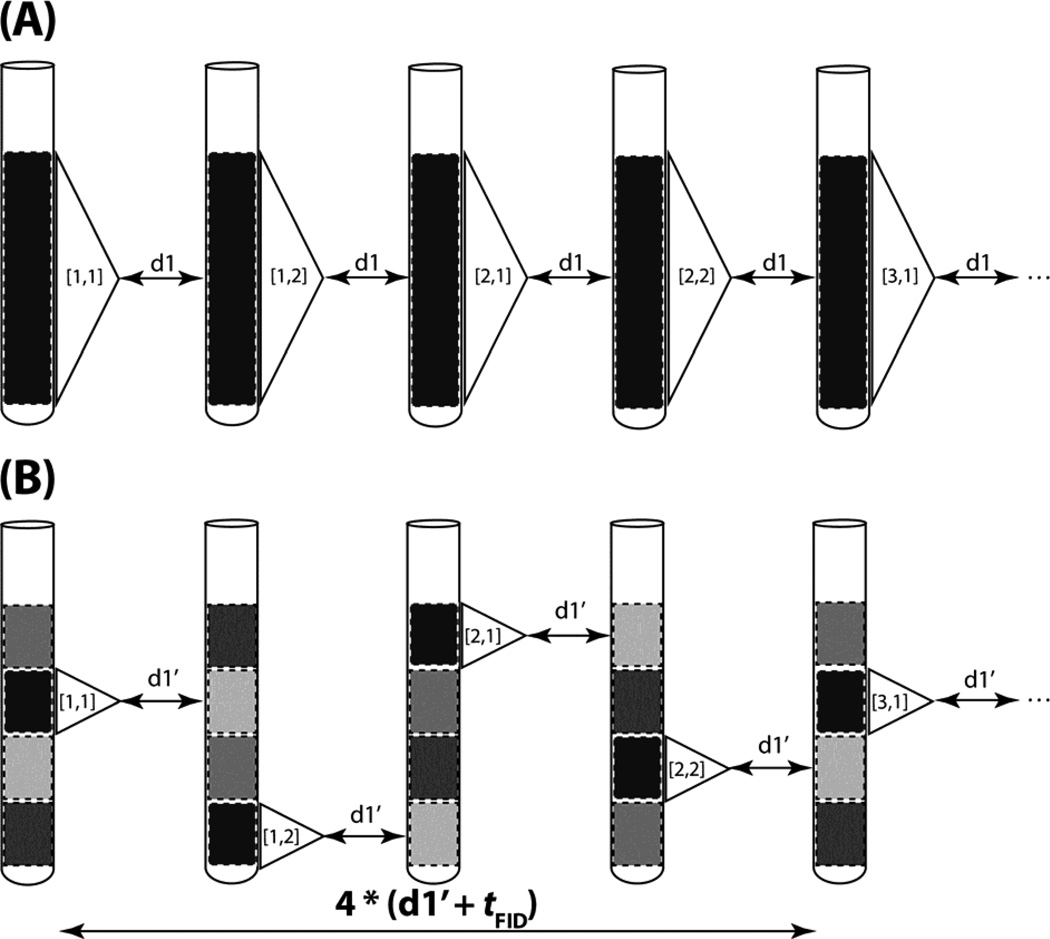
Hence, NMR experiments were developed which avoid read-out PFGs while taking advantage of spatially selective excitation. First, it is possible to design r.f. pulse phase cycle such that the receiver phase is the same for all steps of a phase cycle. All steps of the phase cycles can then be employed simultaneously in different ‘slices’ of the sample and the detected signal simply represents the desired sum of all free induction decays (FIDs) associated with the phase cycling scheme; read-out PFGs are not required. This approach has been named simultaneously cycled (SC) NMR spectroscopy[11]. Second, the signal arising from different slices can be detected separately by ‘time-staggered’ excitation (Figure 1), that is, only fractions of the sample volume are used to acquire the FIDs for obtaining a multi-dimensional experiment[12], or to measure accurately nuclear spin relaxation times[13] or molecular translational diffusion[14]. For the design of new experiments, it is important to note that (i) the intrinsic sensitivity of a spatially selective (SS) NMR experiment is significantly reduced by each additional SS r.f. pulse and that (ii) SS 180° pulses required for refocusing shift evolution introduce large phase shifts which are rather difficult to compensate for, in addition to the significant loss of sensitivity. It is thus desirable to implement a given experiment with the least possible number of such pulses, ideally with a single spatially selective r.f. pulse for excitation.
Figure 1.
Comparison of conventional with time-staggered data acquisition relying on spatial excitation. (A) Conventional data acquisition: the entire sample volume within the r.f. detection coil is utilized to record FIDs with a relaxation delay between scans denoted as d1. The excited region of the sample is depicted in black to indicate that a sizable steady state magnetization is present before excitation and the white dashed rectangle indicates the region for which the signal is detected. The FID is represented by a triangle and [N,P] within the triangle indicates the indirect dimension’s real data point N and its corresponding phase cycling step P. As an example, complex data acquisition (N = 1,2) is combined with a two step phase cycle (P = 1,2) cycle for axial peak suppression[15]. (B) Time-staggered data acquisition relying on spatial excitation of one slice of the entire volume at a time (highlighted with a white dashed rectangle). Considering tFID as the time required to detect an FID and d1’ as the relaxation delay between scans, the same steady state magnetization is present as in (A) if d1 + tFID = 4*(d1’ + tFID). The transitions from pale grey to grey, then to dark grey and eventually to black (second slice from the top) indicates progressing longitudinal relaxation in a slice while other slices are excited. As a result, NMR time domain data can be acquired more rapidly while ensuring that sufficiently long relaxation times between scans are employed.
Furthermore, longitudinal spin relaxation between scans greatly impacts the intrinsic sensitivity of an NMR experiment: sensitivity per unit time is maximal when the total time for longitudinal relaxation between scans is about 1.25 T1 (where T1 represents, as usual, the corresponding 1H relaxation time). Therefore, L-optimization[2a, 6b, 9, 16], possibly combined with applying an excitation pulse at the ‘Ernst angle’[4h, 17], is advantageous whenever rapid sampling is accomplished by shortening the relaxation delay between scans. Furthermore, quantitative analysis of NMR spectra when, for example, measuring relative concentrations or deriving distance information from nuclear Overhauser effects, can be severely impeded by short relaxation delays (which lead to significantly different steady-state magnetizations for nuclear spins exhibiting different T1-relaxation). Therefore, ‘time-staggered’ acquisition of FIDs (Figure 1) from selectively excited slices offers the distinct advantage to sample FIDs rapidly while using sufficiently long relaxation delay between scans. This becomes particularly important whenever L-optimization is not feasible, e.g., in deuterated systems[18] or when protein spectra are acquired in D2O: in both cases 1H-1H dipolar interactions promoting longitudinal relaxation are removed which results in longer 1H T1-relaxation times.
2D polypeptide 15N,1H and methyl group 13Cmethyl,1Hmethyl chemical shift correlation experiments are widely used to study a protein’s polypeptide backbone and molecular core, respectively. Heteronuclear multiple-quantum coherence (HMQC) NMR[19] spectroscopy relies on only two 1H r.f. pulses and thus offers itself for implementation of SS versions. Here we present HMQC experiments implemented by combining a single SS 90° 1H pulse with two non-selective 1H 180° pulses such that 1H magnetization outside of the selectively excited slice is returned to the z-axis before signal detection. Specifically, we implemented (i) simultaneous[20] 2D [13Cmethyl/15N, 1H] HMQC (referred to as sim-HMQC in this paper) and (ii) constant time (ct) [21] 2D [13Cmethyl, 1H] HMQC (ct-HMQC). Applications of sim-HMQC are presented for U-[13C,15N]-labeled 7.6 kDa protein ubiquitin as well as for U-[2H,13C,15N]-labeled, but isoleucine, leucine, valine (ILV) methyl protonated[22] 7.5 kDa Northeast Structural Genomics Consortium (NESG; http://www.nesg.org) target GmR137. The application of ct-HMQC is demonstrated for U-[2H,13C,15N]-labeled, ILV methyl protonated 43.4 kDa maltose-binding protein (MBP) because methyl HMQC for large proteins benefits greatly from a ‘TROSY effect’[23] arising from (partial) cancellation of 13C-1H dipolar relaxation within the methyl groups.
Experimental Section
NMR samples
NMR data were acquired for three samples: (a) [U-13C,15N]-labeled 7.6 kDa protein ubiquitin (3.7 mM in 90%/10% H2O/D2O containing 50 mM sodium phosphate buffer at pH 6.0 and 0.02% NaN3), (b) [U-2H,13C,15N]-labeled, ILV methyl protonated 7.5 kDa NESG target GmR137 (0.7 mM in 90%/10% H2O/D2O containing 20 mM 2-(N-morpholino)ethanesulfonic acid (MES) at pH 6.5, 0.02% NaN3, 10 mM DTT, 5 mM CaCl2, 200 mM NaCl), and (c) [U-2H,13C,15N]-labeled, ILV methyl protonated 43.4 kDa maltose-binding protein complexed to β-cyclodextrin[24] (MBP; 1 mM in the same buffer as sample b).
NMR data acquisition and analysis
NMR experiments were performed at 25 °C for ubiquitin and at 20 °C for GmR137 and MBP using a Varian INOVA 750 MHz spectrometer equipped with a cryogenic 1H[13C,15N] probe (Table S1). The maximal available z-axis PFG amplitude was Gz = 52 G/cm. NMR data were processed using the software NMRPipe[25] and analyzed using the program SPARKY (T. D. Goddard and D. G. Kneller, SPARKY 3, University of California, San Francisco). Polypeptide backbone amide and methyl 1H T1 relaxation times were determined by fitting a mono-exponential function of the S/N as a function of the relaxation delays (300, 400, 500, 600, 700, 900, 1100, 1300, 1600, 2100, 4100 and 5100 ms) employed for a series of HSQC spectra.
Spatially selective (SS) HMQC
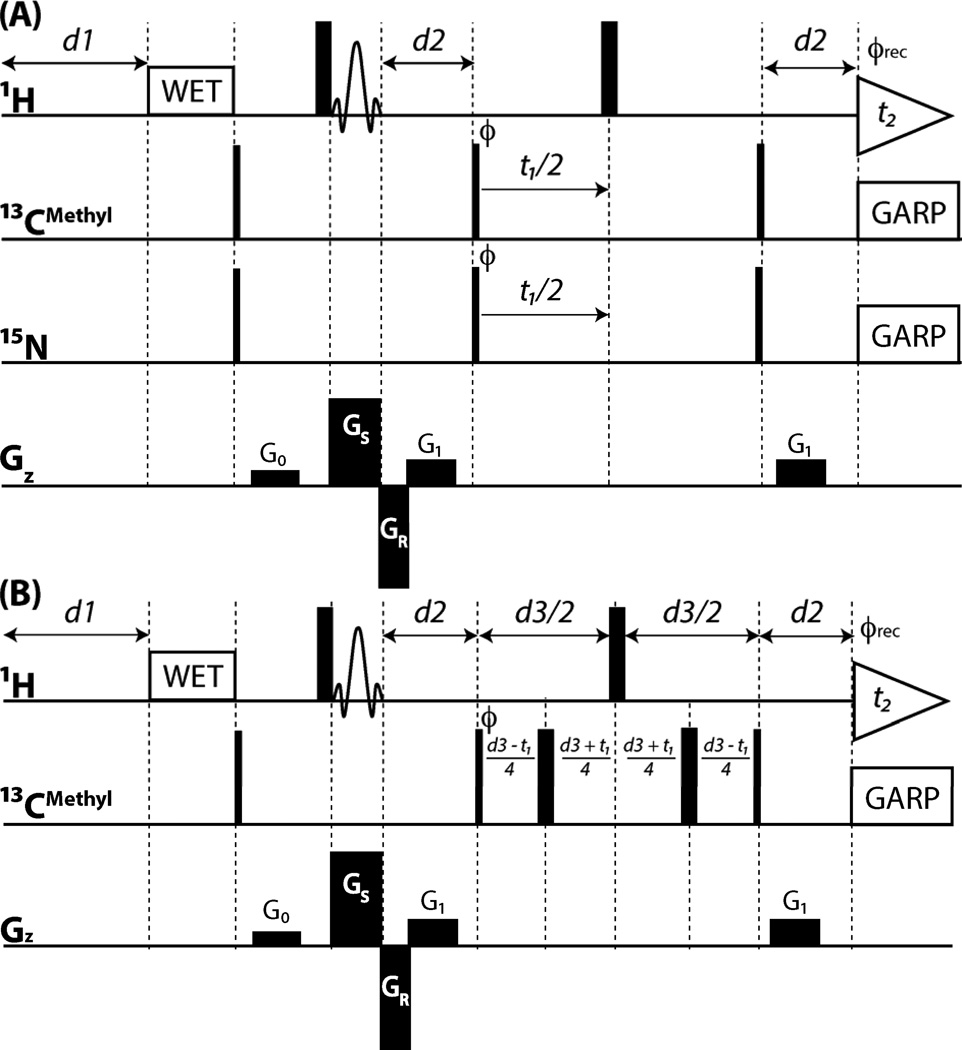
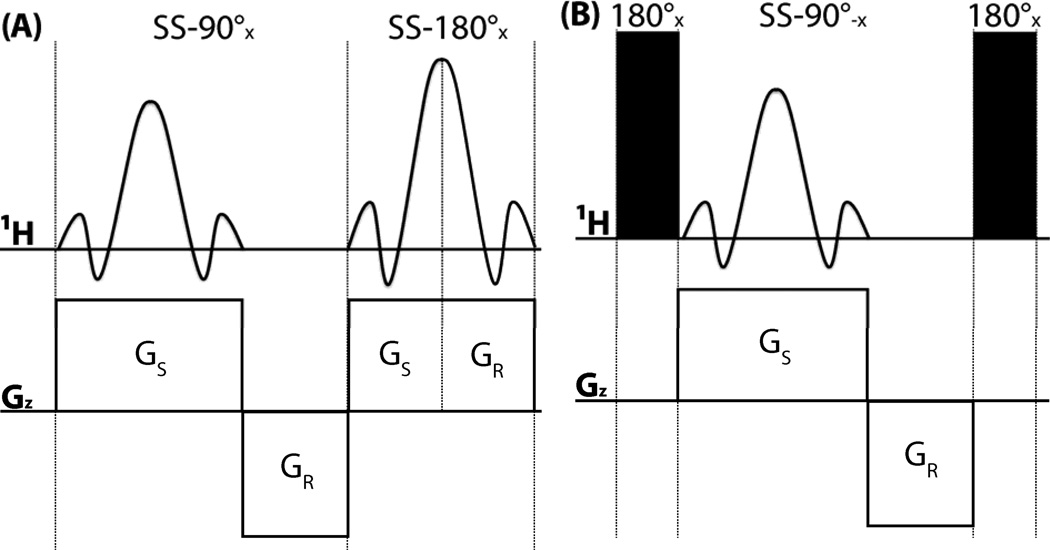
To enhance intrinsic sensitivity, simultaneous 2D [13Cmethyl/15N, 1H] HMQC (‘sim-HMQC’; Figure 2a) and ct [13Cmethyl, 1H] HMQC (‘ct-HQMC’; Figure 2b) were implemented by combining a single spatially selective 90° 1H pulse (Figure 3) with two non-selective 180° 1H-pulses such that 1H-magnetization outside of the selectively excited slice is returned to the z-axis in the middle of the indirect chemical shift evolution (Figure 4). This allows one to avoid an SS 180° 1H pulse that would result in a significant loss of sensitivity resulting from the application PFGs in the presence of transverse magnetization. Moreover, since two-spin coherence is generated in HMQC starting from 1H steady-state magnetization, all 15N/13C pulses can likewise be non-selective.
Figure 2.
SS HMQC r.f. pulse schemes implemented for n = 4 slices. Rectangular 90° and 180° pulses are indicated by thin and thick vertical bars, respectively, and the phase Φ of the excitation pulses are indicated. When no r.f. phase in marked, the pulse is applied along x. High-power 90° pulse lengths are: 8.5 µs for 1H, 15.5 µs for 13C and 39.0 µs for 15N. The length of the 3-lobed sinc pulse for spatially selective excitation is 180 µs and the concomitantly applied spatially selective PFG GS has an amplitude of 27 G/cm. The re-phasing PFG GR has an amplitude of 31 G/cm and a duration of 90 µs. GARP[26] is used for decoupling of 13C (r.f. field strength = 2.0 kHz) and 15N (r.f. field strength = 1.5 kHz) during acquisition of the FIDs. The 1H, 13C and 15N carrier positions are set to 4.78, 20.0 and 118.0 ppm, respectively. Sampling in t1(13C/15N) starts at half of the increment to ensure a 180° first-order phase correction. The duration and strengths of the rectangular PFGs are G0 (0.5 ms, 3.2 G/cm); G1 (0.5 ms, 6.3 G/cm). Phase cycling: Φ=x,−x; Φrec=x,−x for axial peak suppression, and quadrature detection in t1 is accomplished by altering the phases Φ and Φrec according to States-TPPI[27]. (A) Pulse scheme of SS simultaneous 2D [13Cmethyl/15N, 1H] HMQC. The delay d2 is set to a compromise values of 4.54 ms considering that 1JCH ~125 Hz and 1JHN ~90 Hz. Due to simultaneous decoupling of 15N and 13C, the maximally feasible duty cycle of the experimental set-up was reached at a minimal relaxation delay between scans of d1 = ~150 ms when t2,max ~ 80 ms (resulting in a delay of ~930 ms between the acquisition of FIDs for each of the four slices). (B) Pulse scheme of SS ct 2D [13Cmethyl, 1H] HMQC with d2 = 1/(2 JCH) = 4.0 ms and the ct delay d3 = 28.0 ms[15]. The maximally feasible duty cycle was reached at d1 = ~100 ms when t2,max ~ 80 ms (resulting in an effective delay of ~720 ms between the acquisition of FIDs for each of the four slices)
Figure 3.
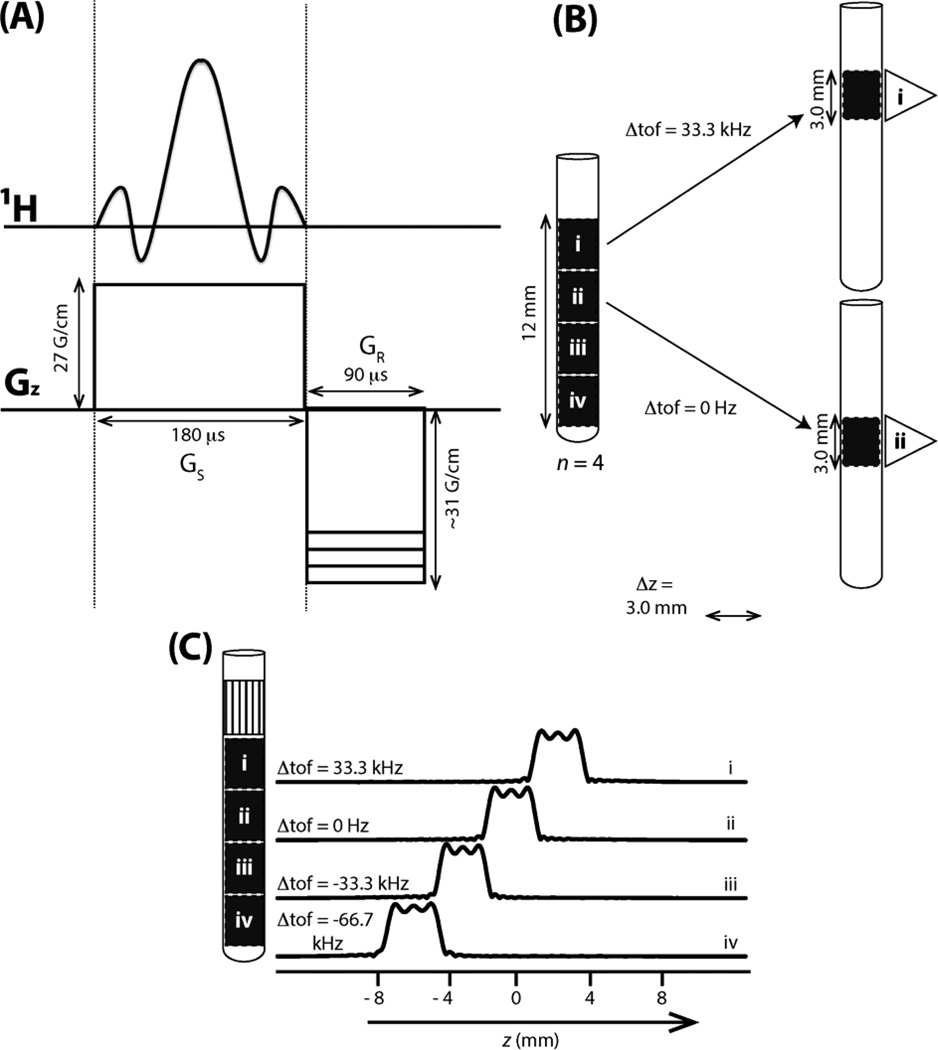
Implementation of SS excitation for HMQC with n = 4 slices (Figure 2) on a Varian INOVA 750 spectrometer equipped with a cryogenic 1H{13C,15N) probe. (A) 3-lobe sinc pulse of 180 µs duration applied along with a slice selection gradient GS (27 G/cm) to excite a slice of 3.0 mm which is followed by a re-phasing gradient GR (−31 G/cm) of opposite sign to compensate for the ‘phase ramp’ along the slice that arises from the application of the sinc pulse. (B) Four slices i to iv are depicted along 12 mm of the sample volume within the receiver coil in order to exemplify the required change of the offset, Δtof, from the 1H carrier frequency chosen for slice ii when exciting slice i. (C) Spatial excitation profiles (on the right) for the slices (on the left) obtained by applying the sinc pulse and PFG depicted in (A) detecting the water 1H signal in the presence of a read-out PFG (3 G/cm), and subsequent FT. Inspection of spatially selective 1D 1H NMR spectra revealed that the top ~4 mm section (hatched) could not be used for SS NMR (see text). Hence, four slices of 3.0 mm each were chosen as depicted (see text) while the top 4 mm of the sample volume within the r.f. coil could not be used.
Figure 4.
Conceptual comparison of two conceivable implementations of SS HMQC with n = 4 slices. (A) Hypothetical implementation in which both the 90° excitation pulse and the 180° pulse for refocusing 1H chemical shift evolution are spatially selective (shown on the left). As a result, the steady state magnetization of only one selected slice is converted into transverse magnetization (as shown on the right). Large sensitivity losses are resulting from the second spatially selective pulse. (B) Implementation chosen for the present implementation in which a non-selective 180° pulse is applied first in order to invert the longitudinal magnetization of the entire sample (depicted in grey on the right), followed by a selective 90° pulse to excite a selected slice and then a non-selective 180° pulse for refocusing 1H chemical shift evolution which also returns longitudinal magnetization of the slices which were not excited.
Spatially (i.e., slice) selective excitation was accomplished using an r.f. pulse with the shape of the three central lobes of a sinc function as was described[11]. Briefly, the time-bandwidth product[28] (i.e., the product of pulse width pw and excited spectral width bw) of such a pulse is 6. For a given amplitude of Gz = 27 G/cm of the magnetic z-field gradient (about one half of the maximally possible amplitude of the gradient amplifier used for the present study) which is applied simultaneously with the r.f. pulse and the gyromagnetic ratio of protons γH = 4.258 kHz/G−1, a given slice thickness Δz requires that the r.f. pulse excites a width of bw = Δz Gz γH. For the probe used in this study, the length of the sample volume located within the r.f. coil is 16 mm along the z-axis. However, recording of SS 1D 1H spectra revealed that significant imperfections of the PFGs in the upper ~4 mm prevented the acquisition of high-quality spectra. Hence, we decided to choose four slices with Δz = 3.0 mm for implementing SS HMQC as shown in Figure 3B (thereby excluding the upper ~4 mm). With Δz = 3.0 mm, one obtains bw = 33.3 kHz (which also equal to the shift of the carrier position to switch from one slice to a neighboring one) and pw = 180 µs is required for the selective excitation. To compensate for chemical shift evolution during the application of the selective pulse, a ‘re-phasing’ PFG[11] was applied, with half of the duration of the selective pulse, right after the r.f. pulse (Figure 3A). The amplitude of this gradient was tuned experimentally by maximizing the signal intensities observed in SS 1D 1H NMR spectra.
Intrinsic sensitivity of SS versus conventional HMQC
The signal intensity S detected for a slice is proportional to its thickness Δz while the noise N remains the same: signal detection is accomplished with an r.f. coil extending over the entire volume within a detection coil of length l in z-direction. Importantly, however, if n slices are used for SS HMQC, n FIDs can be acquired within the same time required for a single FID of conventional HMQC while preserving the relaxation delay of the conventional experiment. Dividing the S/N by the square root of the measurement time yields SNt, a measure for ‘intrinsic sensitivity’. If ntSS and ntC FIDs are acquired during the same time for SS and conventional HMQC, respectively, SNtSS/SNtC scales according to
| (1) |
Hence, if ntSS = n*ntC (i.e. SS and conventional HMQC are acquired with the same total measurement time) and the n slices cover the entire volume within the detection coil (i.e. n = l / Δz), SNtSS is lowered by 1/√n when compared with SNtC. A further sensitivity loss results from the reduced efficiency of SS excitation when compared to excitation with a non-selective (high power) pulse, ε, which is ~0.80 for the selective pulse used for the present implementation[11] (Figure 3).
Moreover, T1-relaxation needs to be considered. In particular, such relaxation occurs in SS HMQC between the two non-selective 180° 1H pulses (Figure 4) outside of the excited slice, which leads to some additional reduction of the detected signal intensity: 1H magnetization is flipped to −z and back to +z for n−1 times between detection of two subsequent FIDs for a given slice.
For non-ct experiments, the resulting loss of detected signal is also a function of t1 and thus leads, even for a comparably short 1H T1 of 500 ms, to a very small signal broadening (< ~1Hz; Figure S2) along the indirect dimension (see Supplementary Material). With mk = Mz,k / Mzeq being the magnetization along the z-axis at time point k divided by its equilibrium value and considering mono-exponential T1-relaxation during a delay τ between time points k and k+1 (during which no r.f. pulses are applied) one has
| (2) |
A formula was thus derived (Supplementary Material) for the ratio ρ of the 1H steady-state magnetizations present before the first 90° 1H pulse in a given slice of SS and in conventional HMQC experiments. Using Equation (2), the steady state magnetizations mSS and mC present in, respectively, a given slice in SS HMQC acquired with four slices and in conventional HMQC are (see Supplementary Material)
| (3) |
| (4) |
with
where τ1 and τ2 (e.g. 4.54 and 233.54 ms for both SS and conventional HMQC at t1 = 0 ms in the present study) are, respectively, the delays before and after the application of the 1H 180° refocusing pulses (during which relaxation is neglected). Dividing Equation (3) by Equation (4) yields the desired ratio ρ
| (5) |
After multiplication of ρ with ε and (Δz/l)*(ntSS/ntC)1/2 in Equation (1), the ratio of the corresponding SNt values is obtained as:
| (6) |
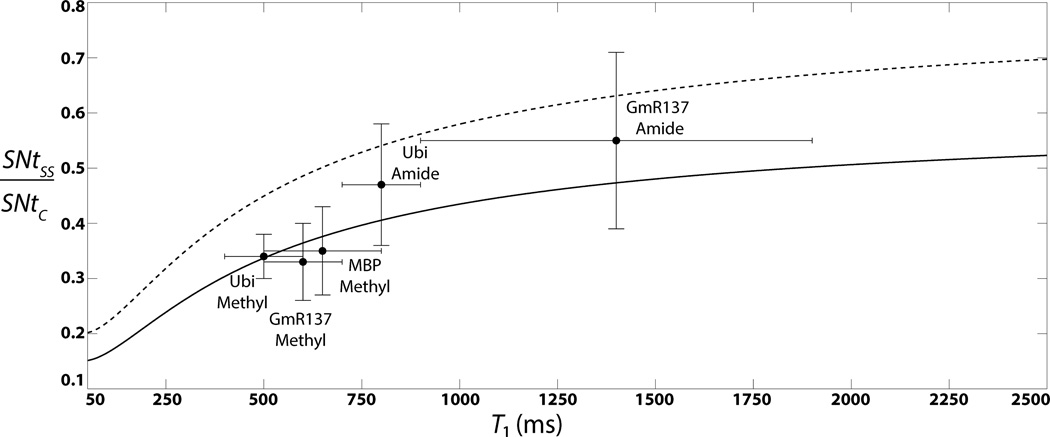
Figure 5 provides a plot of SNtSS/SNtC versus 1H T1 for Δz/l = 3/16 (solid line; for present study, see Figure 3) ; and for Δz/l =1/4 (dashed line; if the whole sample volume within the r.f. coil can be used for SS NMR), ε = 0.80, and t1 = 0 ms and ntSS = ntC, that is, for data acquired rapidly with identical sampling speed (relaxation delay between scans d1 = 150 ms for both SS and conventional HMQC; Table S1). Inspection of Figure 5 reveals (i) that for short T1 the ratio increases largely with T1 (which reflects the four times longer effective inter-scan delays, d1 + t2,max, in SS HMQC), and (ii) that for T1 around 1.5 s the intrinsic sensitivity of SS NMR can be expected to be, respectively, about 50% and 70% of the sensitivity of conventional HMQC for Δz/l = 3/16 and Δz/l = 1/4 (whole sample volume available for SS NMR).
Figure 5.
The ratio of the intrinsic sensitivities of SS HMQC with n = 4 slices, SNtSS, and conventional HMQC, SNtC, calculated according to Equation (6) is plotted (solid line) versus 1H T1 relaxation times for identical sampling speed (ntSS = ntC) at t1 = 0 ms, and with Δz/l = 3/16 and an inter-scan delay of 230 ms. Also shown are experimental values obtained for various protein samples (see text; ‘Ubi’ represents ubiqutin). The bars indicate the ranges that were measured for 1H T1 and SNt values. For comparison, SNtSS/SNtC is also plotted (dashed line) for Δz/l = 1/4 to illustrate the loss of sensitivity resulting from hardware limitations of our spectrometer (Figure 3), that is, the fact that the top 4 mm of the sample could not be used for SS NMR (see text). SN values were measured by dividing signal intensities by 2.5 times the standard deviation of the noise as measured in noise regions of the 2D spectra.
In principle, the translational diffusion of protein molecules needs to be considered to assess the intrinsic sensitivity of SS NMR. For the current implementation of SS NMR, however, a non-selective 180° 1H pulse is applied for the refocusing of transverse 1H magnetization during the indirect evolution period (Figure 2) along with likewise non-selective heteronuclear 90° pulses (Figure 2). As a result, protein molecules diffusing outside of the excited slice, while remaining within the receiver coil during the time elapsed between slice selective excitation and signal detection, still contributes to the signal (which is detected over the entire sample volume). Furthermore, the diffusion coefficient even for the small 7.6 kDa protein ubiquitin (1.3 10−4 mm2/s at 25 °C) results in a root mean squared displacement of only ~16 µm () when the delays between excitation and signal detection are shorter than 1 s. Hence, translational diffusion does not result in any noticeable losses of sensitivity in SS HMQC experiments.
Results and Discussion
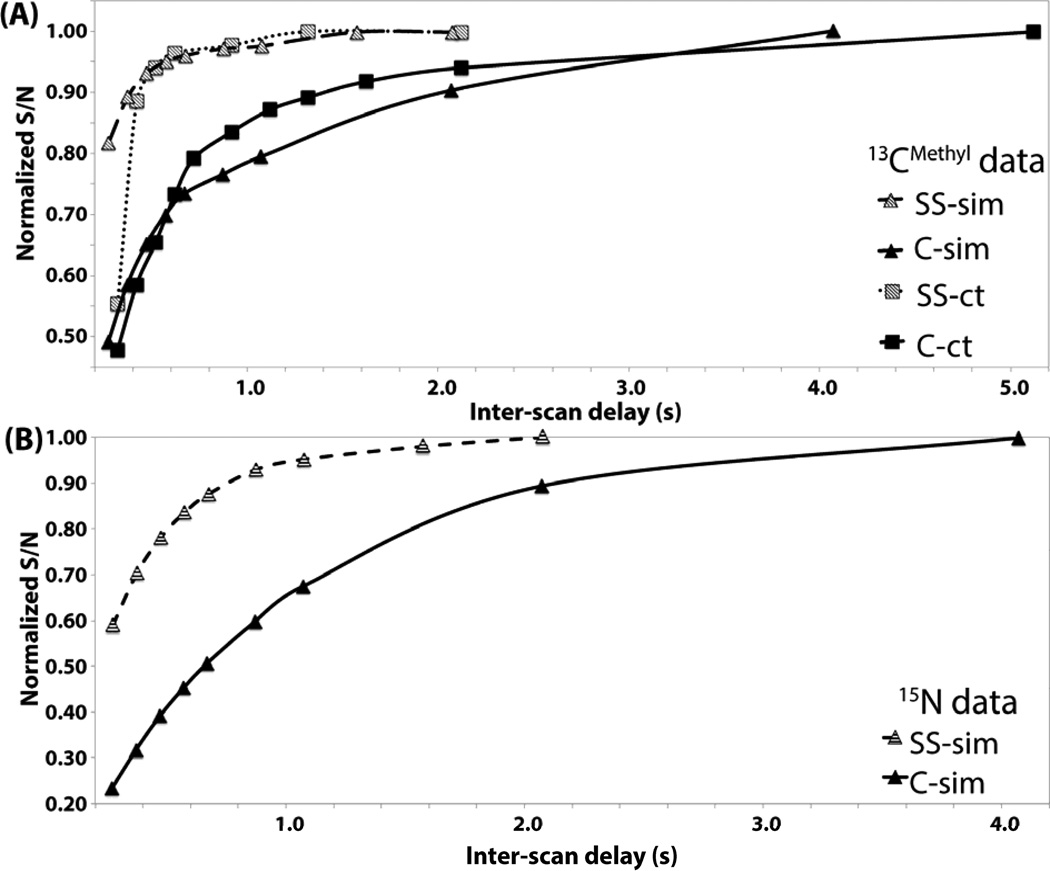
First, SS HMQC experiments were implemented and optimized using the sample containing 3.7 mM of 7.6 kDa protein ubiquitin. In order to demonstrate the impact of time-staggered data acquisition (Figure 1), the average S/N was measured as a function of the inter-scan delay and then compared with conventional HMQC acquired with the same sampling speed. S/N ratios were normalized relative to the values observed for (nearly) fully relaxed 1H spins at very long relaxation delays (Figure 6). Since the relaxation delay between two FIDs recorded from each of the four slices in SS HMQC is four times longer than the delay between two consecutive FIDs recoded in conventional HMQC (Figure 1), the S/N ratios increase, as expected, about four times faster for SS HMQC (Figure 6).
Figure 6.
Average S/N ratios measured for signals in spectra recorded for protein ubiquitin were normalized by dividing them with the S/N ratio observed at very long delays between the acquisition of FIDs (‘inter-scan delays’) and then plotted versus the inter-scan delay. Data points for SS and conventional HMQC are represented, respectively, by grey and black symbols as shown in the lower right (‘SS’ and ‘C’ denote SS and conventional HMQC) and connected by lines. (A) Methyl signals. (B) Polypeptide backbone amide signals.
Second, SS HMQC spectra were acquired with, respectively, 150 and 100 ms relaxation delays d1 between scans for sim and ct-HMQC for the three proteins with varying molecular weight and quite different 1H T1 relaxation times (Table S1), that is, U-[13C,15N]-labeled protein ubiquitin (7.6 kDa), and the two U-[2H,13C,15N]-labeled, ILV methyl protonated proteins GmR137 (7.5 kDa) and MBP (43.4 kDa). For comparison, conventional HQMC spectra were recorded with the same relaxation delays and measurement times. One set of HMQC spectra was acquired with comparably long measurement times (between 6 and 24 minutes; Table S1) to ensure that S/N > ~30 for all peaks in order to compare accurately the intrinsic sensitivity of SS and conventional HMQC. SNtSS/SNtC was measured for well-resolved peaks and the resulting averages and ranges are shown along with the corresponding averages and ranges of 1H T1-relaxation times (Table S1) also in Figure 5. The close agreement with predictions based on Equation (6) neatly validates the expected performance of the current implementation of SS HMQC (Figure 2). A second set of spectra was acquired with short measurement times between 45 and 120 seconds in order to demonstrate the feasibility of rapid data acquisition (S/N > 10 for all peaks). Likewise, high-quality SS HMQC spectra (Figure 7) were obtained and between 96% and 100% of the peaks detected in conventional HMQC spectra (Figure S4) were registered.
Figure 7.
Rapidly acquired SS HMQC spectra (for acquisition parameters, see Table S1). (A) SS ct-HMQC spectra collected in 66 s for 7.6 kDa protein ubiquitin, in 45 s for 7.5 kDa GmR137 and 90 s for 43 kDa MBP (boxed spectral regions contain folded peaks). (B) Spectral regions containing polypeptide backbone NH signals of sim-HMQC spectra acquired in 90 s for ubiquitin and 120 s for GmR137.
Conclusion
Newly developed SS HMQC represents a valuable addition to the portfolio of experiments for obtaining 2D NMR spectral information rapidly. Importantly, the time-staggered acquisition enables one to employ long relaxation delays at high repetition rates. This acquisition scheme promises to be particularly valuable for systems with long T1 relaxation times and/or for NMR experiments for which short relaxation delays can impede data analysis. For example, cross peaks in 1H-1H NOESY depend on the steady-state magnetization of dipolarly coupled protons (so that upper distance limit constraints derived from spectra recorded with short relaxation delay are inaccurate). Notably, SOFAST 2D [15N,1H] HMQC[4f] relies on L-optimization[9], i.e. the flip-back of aliphatic 1H magnetization to accelerate sampling speed[2a,6b,16]. Hence, in contrast to the SS HMQC experiments presented here, SOFAST HMQC (i) does not aim at employing long relaxation delays between scans, (ii) cannot be considered for simultaneous 2D [13Cmethyl/15N, 1H] HMQC data acquisition. and (iii) is of limited use for deuterated proteins. Moreover, SS simultaneous 2D [13Car°matic/15N,1H] HMQC could be readily implemented to study aromatic rings, which are valuable probes of protein structure and dynamics[29]. We thus expect that SS and SOFAST HMQC will be highly complementary for future bio-molecular studies.
Importantly, SS NMR can be readily combined with other approaches for rapid data acquisition such as SC NMR[11], Hadamard NMR[10], as well as non-uniform time domain sampling schemes[8] including GFT NMR[6]. In particular, SC NMR could be used to implement a minimal 2-step phase cycle for axial peak suppression and combined with SS NMR for quadrature detection, potentially in clean absorption mode to remove residual phase errors[30]. Similarly, SS NMR may be a viable option to more rapidly record spectra to obtain relative concentrations of compounds, e.g. when measuring kinetic isotope effects[31], which depends on exciting largely relaxed spin systems. Finally, it is conceivable (i) to develop multi-element receiver coils that may render SS NMR intrinsically more sensitive than conventional HMQC (with such coils noise arising from non-excited slices could be excluded during signal detection), and (ii) to extend the SS NMR approach to volume selective excitation using triple axis gradient probes.
Acknowledgements
This work was supported by the National Science Foundation (MCB 0817857 to T.S.) and the National Institutes of Health (GM094597 to G.T.M). We thank Dr. Dinesh Sukumaran for helpful discussions.
Footnotes
Supporting information for this article is available on the WWW under http://www.chemphyschem.org or from the author.
References
- 1.Kovacs H, Moskau D, Spraul M. Prog. Nucl. Magn. Reson. Spectrosc. 2005;46:131–155. [Google Scholar]
- 2.a) Atreya HS, Szyperski T. Methods Enzymol. 2005;394:78–108. doi: 10.1016/S0076-6879(05)94004-4. [DOI] [PubMed] [Google Scholar]; b) Felli IC, Brutscher B. ChemPhysChem. 2009;10:1356–1368. doi: 10.1002/cphc.200900133. [DOI] [PubMed] [Google Scholar]; c) Szyperski T, Montelione GT. Advances in NMR-based Structural Genomics. In: Dingley AJ, Pascal SM, editors. Biomolecular NMR Spectroscopy. IOS Press; 2011. [Google Scholar]; d) Rennella E, Brutscher B. ChemPhysChem. 2013;14:3059–3070. doi: 10.1002/cphc.201300339. [DOI] [PubMed] [Google Scholar]
- 3.a) Montelione GT, Arrowsmith C, Girvin M, Kennedy M, Markley J, Powers R, Prestegard J, Szyperski T. J. Struct. Funct. Genomics. 2009;10:101–106. doi: 10.1007/s10969-009-9064-0. [DOI] [PMC free article] [PubMed] [Google Scholar]; b) Montelione GT, Szyperski T. Curr. Opin. Drug Discov. Devel. 2010;13:335–349. [PMC free article] [PubMed] [Google Scholar]
- 4.a) Frydman L, Scherf T, Lupulescu A. Proc. Natl. Acad. Sci. U. S. A. 2002;99:15858–15862. doi: 10.1073/pnas.252644399. [DOI] [PMC free article] [PubMed] [Google Scholar]; b) Frydman L, Lupulescu A, Scherf T. J. Am. Chem. Soc. 2003;125:9204–9217. doi: 10.1021/ja030055b. [DOI] [PubMed] [Google Scholar]; c) Schanda P, Kupce E, Brutscher B. J. Biomol. NMR. 2005;33:199–211. doi: 10.1007/s10858-005-4425-x. [DOI] [PubMed] [Google Scholar]; d) Schanda P, Brutscher B. J. Am. Chem. Soc. 2005;127:8014–8015. doi: 10.1021/ja051306e. [DOI] [PubMed] [Google Scholar]; e) Schanda P, Brutscher B. J. Magn. Reson. 2006;178:334–339. doi: 10.1016/j.jmr.2005.10.007. [DOI] [PubMed] [Google Scholar]; f) Schanda P, Van Melckebeke H, Brutscher B. J. Am. Chem. Soc. 2006;128:9042–9043. doi: 10.1021/ja062025p. [DOI] [PubMed] [Google Scholar]; g) Schanda P, Forge V, Brutscher B. Magn. Reson. Chem. 2006;44:S177–S184. doi: 10.1002/mrc.1825. [DOI] [PubMed] [Google Scholar]; h) Schanda P, Forge V, Brutscher B. Proc. Natl. Acad. Sci. U. S. A. 2007;104:11257–11262. doi: 10.1073/pnas.0702069104. [DOI] [PMC free article] [PubMed] [Google Scholar]; i) Gal M, Schanda P, Brutscher B, Frydman L. J. Am. Chem. Soc. 2007;129:1372–1377. doi: 10.1021/ja066915g. [DOI] [PubMed] [Google Scholar]; j) Kern T, Schanda P, Brutscher B. J. Magn. Reson. 2008;190:333–338. doi: 10.1016/j.jmr.2007.11.015. [DOI] [PubMed] [Google Scholar]; k) Amero C, Schanda P, Dura MA, Ayala I, Marion D, Franzetti B, Brutscher B, Boisbouvier J. J. Am. Chem. Soc. 2009;131:3448–3449. doi: 10.1021/ja809880p. [DOI] [PubMed] [Google Scholar]; l) Gal M, Kern T, Schanda P, Frydman L, Brutscher B. J. Biomol. NMR. 2009;43:1–10. doi: 10.1007/s10858-008-9284-9. [DOI] [PubMed] [Google Scholar]; m) Corazza A, Rennella E, Schanda P, Mimmi MC, Cutuil T, Raimondi S, Giorgetti S, Fogolari F, Viglino P, Frydman L, Gal M, Bellotti V, Brutscher B, Esposito G. J. Biol. Chem. 2010;285:5827–5835. doi: 10.1074/jbc.M109.061168. [DOI] [PMC free article] [PubMed] [Google Scholar]; n) Shrot Y, Frydman L. J. Magn. Reson. 2011;209:352–358. doi: 10.1016/j.jmr.2011.01.017. [DOI] [PMC free article] [PubMed] [Google Scholar]; o) Rennella E, Cutuil T, Schanda P, Ayala I, Forge V, Brutscher B. J. Am. Chem. Soc. 2012;134:8066–8069. doi: 10.1021/ja302598j. [DOI] [PubMed] [Google Scholar]; p) Smith PES, Donovan KJ, Szekely O, Baias M, Frydman L. ChemPhysChem. 2013;14:3138–3145. doi: 10.1002/cphc.201300436. [DOI] [PMC free article] [PubMed] [Google Scholar]
- 5.a) Szyperski T, Wider G, Bushweller JH, Wuethrich K. J. Am. Chem. Soc. 1993;115:9307–9308. [Google Scholar]; b) Szyperski T, Yeh DC, Sukumaran DK, Moseley HNB, Montelione GT. Proc. Natl. Acad. Sci. U. S. A. 2002;99:8009–8014. doi: 10.1073/pnas.122224599. [DOI] [PMC free article] [PubMed] [Google Scholar]
- 6.a) Kim S, Szyperski T. J. Am. Chem. Soc. 2003;125:1385–1393. doi: 10.1021/ja028197d. [DOI] [PubMed] [Google Scholar]; b) Atreya HS, Szyperski T. Proc. Natl. Acad. Sci. U. S. A. 2004;101:9642–9647. doi: 10.1073/pnas.0403529101. [DOI] [PMC free article] [PubMed] [Google Scholar]; c) Atreya HS, Eletsky A, Szyperski T. J. Am. Chem. Soc. 2005;127:4554–4555. doi: 10.1021/ja042562e. [DOI] [PubMed] [Google Scholar]; d) Atreya HS, Garcia E, Shen Y, Szyperski T. J. Am. Chem. Soc. 2007;129:680–692. doi: 10.1021/ja066586s. [DOI] [PubMed] [Google Scholar]; e) Atreya HS, Sathyamoorthy B, Jaipuria G, Beaumont V, Varani G, Szyperski T. J. Biomol. NMR. 2012;54:337–342. doi: 10.1007/s10858-012-9687-5. [DOI] [PubMed] [Google Scholar]
- 7.a) Kupce E, Freeman R. J. Am. Chem. Soc. 2004;126:6429–6440. doi: 10.1021/ja049432q. [DOI] [PubMed] [Google Scholar]; b) Hiller S, Fiorito F, Wüthrich K, Wider G. Proc. Natl. Acad. Sci. U. S. A. 2005;102:10876–10881. doi: 10.1073/pnas.0504818102. [DOI] [PMC free article] [PubMed] [Google Scholar]
- 8.Mobli M, Maciejewski MW, Schuyler AD, Stern AS, Hoch JC. Phys. Chem. Chem. Phys. 2012;14:10835–10843. doi: 10.1039/c2cp40174f. [DOI] [PMC free article] [PubMed] [Google Scholar]
- 9.Pervushin K, Vögeli B, Eletsky A. J. Am. Chem. Soc. 2002;124:12898–12902. doi: 10.1021/ja027149q. [DOI] [PubMed] [Google Scholar]
- 10.Kupce E, Freeman R. J. Magn. Reson. 2003;163:56–63. doi: 10.1016/s1090-7807(03)00036-3. [DOI] [PubMed] [Google Scholar]
- 11.Parish DM, Szyperski T. J. Am. Chem. Soc. 2008;130:4925–4933. doi: 10.1021/ja711454e. [DOI] [PubMed] [Google Scholar]
- 12.a) Vega-Vazquez M, Cobas JC, Martin-Pastor M. Magn. Reson. Chem. 2010;48:749–752. doi: 10.1002/mrc.2659. [DOI] [PubMed] [Google Scholar]; b) Giraud N, Beguin L, Courtieu J, Merlet D. Angew. Chem., Int. Ed. 2010;49:3481–3484. doi: 10.1002/anie.200907103. [DOI] [PubMed] [Google Scholar]
- 13.Bhattacharyya R, Kumar A. Chem. Phys. Lett. 2004;383:99–103. [Google Scholar]
- 14.Thrippleton MJ, Loening NM, Keeler J. Magn. Reson. Chem. 2003;41:441–447. [Google Scholar]
- 15.Cavanagh J, Fairbrother WJ, GP A, III, Rance M, Skelton NJ. Protein NMR Spectroscopy. Elsevier Inc; 2007. [Google Scholar]
- 16.a) Eletsky A, Atreya HS, Liu G, Szyperski T. J. Am. Chem. Soc. 2005;127:14578–14579. doi: 10.1021/ja054895x. [DOI] [PubMed] [Google Scholar]; b) Deschamps M, Campbell ID. J. Magn. Reson. 2006;178:206–211. doi: 10.1016/j.jmr.2005.09.011. [DOI] [PubMed] [Google Scholar]
- 17.Ernst RR, Bodenhausen G, Wokaun A. Principles of Nuclear Magnetic Resonance in One and Two Dimensions. Oxford University Press; 1990. [Google Scholar]
- 18.Lu K, Heng X, Garyu L, Monti S, Garcia EL, Kharytonchyk S, Dorjsuren B, Kulandaivel G, Jones S, Hiremath A, Divakaruni SS, LaCotti C, Barton S, Tummillo D, Hosic A, Edme K, Albrecht S, Telesnitsky A, Summers MF. Science. 2011;334:242–245. doi: 10.1126/science.1210460. [DOI] [PMC free article] [PubMed] [Google Scholar]
- 19.a) Mueller L. J. Am. Chem. Soc. 1979;101:4481–4484. [Google Scholar]; b) Bax A, Griffey RH, Hawkins BL. J. Magn. Reson. 1983;55:301–315. [Google Scholar]
- 20.a) Farmer B, II, Mueller L. J. Biomol. NMR. 1994;4:673–687. doi: 10.1007/BF00404277. [DOI] [PubMed] [Google Scholar]; b) Pascal SM, Muhandiram DR, Yamazaki T, Formankay JD, Kay LE. J. Magn. Reson. Ser. B. 1994;103:197–201. [Google Scholar]; c) Uhrín D, Bramham J, Winder S, Barlow P. J. Biomol. NMR. 2000;18:253–259. doi: 10.1023/a:1026550629595. [DOI] [PubMed] [Google Scholar]; d) Xia Y, Yee A, Arrowsmith C, Gao X. J. Biomol. NMR. 2003;27:193–203. doi: 10.1023/a:1025407905478. [DOI] [PubMed] [Google Scholar]; e) Shen Y, Atreya HS, Liu G, Szyperski T. J. Am. Chem. Soc. 2005;127:9085–9099. doi: 10.1021/ja0501870. [DOI] [PubMed] [Google Scholar]; f) Parella T, Nolis P. Concept Magnetic Res. 2010;36A:1–23. [Google Scholar]
- 21.a) Santoro J, King GC. J. Magn. Reson. 1992;97:202–207. [Google Scholar]; b) Vuister GW, Bax A. J. Magn. Reson. 1992;98:428–435. [Google Scholar]
- 22.Ruschak A, Kay L. J. Biomol. NMR. 2010;46:75–87. doi: 10.1007/s10858-009-9376-1. [DOI] [PubMed] [Google Scholar]
- 23.Ollerenshaw JE, Tugarinov V, Kay LE. Magn. Reson. Chem. 2003;41:843–852. doi: 10.1002/mrc.1819. [DOI] [PubMed] [Google Scholar]
- 24.Lange OF, Rossi P, Sgourakis NG, Song Y, Lee H-W, Aramini JM, Ertekin A, Xiao R, Acton TB, Montelione GT, Baker D. Proc. Natl. Acad. Sci. U. S. A. 2012;109:10873–10878. doi: 10.1073/pnas.1203013109. [DOI] [PMC free article] [PubMed] [Google Scholar]
- 25.Delaglio F, Grzesiek S, Vuister GW, Zhu G, Pfeifer J, Bax A. J. Biomol. NMR. 1995;6:277–293. doi: 10.1007/BF00197809. [DOI] [PubMed] [Google Scholar]
- 26.Shaka AJ, Barker PB, Freeman R. J. Magn. Reson. 1985;64:547–552. [Google Scholar]
- 27.Marion D, Ikura M, Tschudin R, Bax A. J. Magn. Reson. 1989;85:393–399. [Google Scholar]
- 28.Bernstein M, King K, Zhou X. Handbook of MRI Pulse Sequences: A Guide for Scientists, Engineers, Radiologists, Technologists. Academic Press; 2004. [Google Scholar]
- 29.a) Skalicky JJ, Mills JL, Sharma S, Szyperski T. J. Am. Chem. Soc. 2001;123:388–397. doi: 10.1021/ja003220l. [DOI] [PubMed] [Google Scholar]; b) Sathyamoorthy B, Singarapu KK, Garcia AE, Szyperski T. ChemBioChem. 2013;14:684–688. doi: 10.1002/cbic.201300016. [DOI] [PubMed] [Google Scholar]
- 30.a) Wu Y, Ghosh A, Szyperski T. Angew. Chem. Int. Ed. Engl. 2009;48:1479–1483. doi: 10.1002/anie.200804927. [DOI] [PMC free article] [PubMed] [Google Scholar]; b) Wu Y, Ghosh A, Szyperski T. J. Struct. Funct. Genomics. 2009;10:227–232. doi: 10.1007/s10969-009-9066-y. [DOI] [PMC free article] [PubMed] [Google Scholar]; c) Ghosh A, Wu Y, He Y, Szyperski T. J. Magn. Reson. 2011;213:46–57. doi: 10.1016/j.jmr.2011.08.037. [DOI] [PubMed] [Google Scholar]
- 31.Manning KA, Sathyamoorthy B, Eletsky A, Szyperski T, Murkin AS. J. Am. Chem. Soc. 2012;134:20589–20592. doi: 10.1021/ja310353c. [DOI] [PubMed] [Google Scholar]


