

Abstract
Passive dielectric materials have been used to improve aspects of MRI by affecting the distribution of radiofrequency electromagnetic fields. Recently, interest in such materials has increased with the number of high-field MRI sites. Here, we introduce a new material composed of sintered high-permittivity ceramic beads in deuterated water. This arrangement maintains the ability to create flexible pads for conforming to individual subjects. The properties of the material are measured and the performance of the material is compared to previously used materials in both simulation and experiment at 3 T. Results show that both permittivity of the beads and effect on signal-to-noise ratio and required transmit power in MRI are greater than those of materials consisting of ceramic powder in water. Importantly, use of beads results in both higher permittivity and lower conductivity than use of powder.
Keywords: dielectric, MRI, signal-to-noise ratio
INTRODUCTION
In a growing number of applications, high dielectric materials have been used to improve the local sensitivity and/or homogeneity of the radiofrequency (RF) magnetic (B1) field in human MRI (1–13). For example, simple aqueous and gel-based pads of dielectric materials have been used to improve local sensitivity in head imaging at 3 and 7 T (4,10) or image homogeneity in abdominal imaging at 3 T (1–3). Brain imaging with pads of distilled water or a suspension made by calcium titanate (CaTiO3) powder in distilled or deuterated water placed beside the head have shown a significant increase in signal-to-noise ratio (SNR) in the area of the temporal lobe at 7 T (4,6,7).
One current explanation of these effects can be understood with examination of Ampere's law (4,10).
| [1] |
The intensity and distribution of the magnetic field B inside the human body are strongly affected by the conduction current (Jc = σE) and displacement current (Jd = iωε0εrE). Near the coil, the primary source of magnetic field is Jc within the transmit coil. Conduction current in a sample with nonzero conductivity (σ) results in the dissipation of electromagnetic (EM) energy as heat. Displacement current can be seen as a secondary field source supporting the propagation of RF fields through the sample. The high-value permittivity (εr) of dielectric material between the coil and the sample leads to a high intensity of Jd adjacent to the human body, which enhances the RF magnetic field in the region near the material. Based on this understanding, until wavelength effects (such as field nulls) become a factor, higher permittivity materials should produce greater enhancement. The dielectric materials used in MRI research tend to have relative permittivity higher than that of biological tissue on average, from aqueous solution or gel-based material (1–4) with 50 < εr < 80, to solid material in slurry form (6,7,11) with 100 < εr < 350.
Flexible dielectric pads have been used in MRI for years (12) and at least three types of dielectric materials have been introduced: gel-based (1,3), liquid water-based (2,4,10), and solid particulates in water creating a slurry (5,6,13). In earlier research (1–13), for a given volume of material, the slurries show the greatest effect on RF field distribution and SNR enhancement due to their high εr. Creation of slurries with still higher permittivity could facilitate greater effects or require lower volumes of material.
In this work, we introduce a new material composed of sintered high-permittivity ceramic beads in deuterated water and compare to different water/particle slurries with the overall goal of maximizing the permittivity value. Slurry permittivity is governed by the permittivity values of the constituent phases and the volume fraction of each phase (7). Perovskite powders (BaTiO3 and CaTiO3) with micron-scale particle sizes have been combined with water up to a ratio of 0.3 powder volume to water volume (6,12). A recently introduced bead-based slurry, with mm-scale barium titrate (BaTiO3) beads in deuterated water, can reach higher volume fractions and εr values above 500, depending on the volume fraction achieved. Field simulations are used to verify the experimental results and investigate the general effects of the dielectric material (4,7,10,13). Here, simple geometries are chosen to facilitate accurate simulation of the experimental conditions.
METHODS
Material Preparation and Characterization
Two powder slurries and one bead slurry were used in this study. A CaTiO3 powder slurry was made by mixing the CaTiO3 powder (Alfa Aesar, Ward Hill, MA) with deuterated water (Sigma–Aldrich, St. Louis, MO) to a powder volume/water volume ratio of 0.40 (a volume fraction of 0.29), at which point the slurry becomes saturated (7). The BaTiO3 powder slurry was prepared in the same manner and the saturated powder volume/water volume ratio was 0.35 (a volume fraction of 0.26) (13). The BaTiO3 bead slurry consisted of deuterated water and BaTiO3 beads in a 0.92 bead volume/water volume ratio (a volume fraction up to 0.45). The BaTiO3 beads were made by spraying a binding agent, 2% polyvinyl alcohol (Air Products, Allentown, PA), onto the BaTiO3 powder (Inframat Advanced Materials, Manchester, CT) and the resulting mixture was formed into beads with approximately 1-mm diameter using a standard laboratory sieve. Consistent with our standard sintering procedures (14), the BaTiO3 beads were then sintered in a custom-built furnace: 8 h from room temperature to 400°C, 4 h from 400 to 600°C, 2 h from 600 to 1300°C, 2 h at 1300°C, and a 2 h drop from 1300°C to room temperature. These long temperature ramps ensure removal of volatile chemicals from the binding agent.
The dielectric constant (εr) and conductivity (σ) of each powder slurry at approximately 123 and 300 MHz were measured using a dielectric probe kit (85070D, Agilent Technologies, Santa Clara, CA) and impedance analyzer (E4991A, Agilent Technologies). The BaTiO3 bead slurry has a heterogeneous composition over a few millimeters, precluding use of the dielectric probe kit in measuring electrical properties. Instead, a resonant cavity method was used to measure εr and σ of the bead slurry at approximately 123.2 and 300 MHz. Using standard equations for mode resonances in a closed cylindrical cavity (15) and the expected electrical properties of the bead slurry, we designed two tunable cavities to have good isolation of the TE111 mode from other resonant modes at 125 MHz (larger cavity) and at 300 MHz (smaller cavity) shown in Figure 1. Each resonant cavity consists of a cylindrical conducting wall shorted on both ends with conducting plates. The smaller cavity was constructed of a 15-mm radius copper tube soldered to a copper base. A plunger constructed by fixing copper mesh to a delrin tube with a diameter slightly smaller than the copper tube with good contact between the mesh and the cylinder walls formed the other conducting end of the cavity. Two coaxial ports were placed on opposite sides of the copper tube 2 cm from the base to excite and monitor the spectrum response with a spectrum analyzer (N9912A, Agilent Technologies). The larger cavity was constructed of an acrylic tube fixed at one end to a delrin base. The tube was fitted tightly into a circular well that was milled in the base and filled with silicone sealant to ensure a water-tight connection. Structural stability was added with four long bolts connecting the base plate to a top plate milled with a ridge to accommodate the top end of the tube and a hole to admit the plunger. Copper tape was carefully placed on the inner surface of the tube and on the area of the base inside the cavity after the cavity body was built. An adjustable plunger was constructed by fixing copper mesh to a delrin tube formed the other conducting end of the cavity. Two coaxial ports were installed on opposite sides of the conducting wall, 5 cm above the base. The cavity size (radius a and height d), resonant frequency (fr) of the TE111 mode, and its bandwidth (Δf) were required to calculate the εr and σ of the bead slurry (15). The height of the cavity was adjusted by adding or removing the bead slurry then inserting the plunger to rest on top of the slurry. By changing d, fr could be tuned and d was varied by controlling the amount of the bead slurry present in the cavity. Connecting the two measurement ports with a spectrum analyzer, an S21 or S12 spectrum was used to identify fr of the TE111 mode with reference to a mode chart. Once fr was identified, Δf was measured using the same spectrum. With the dimensions of the cavity and both Δf and fr of the TE111 mode, εr and σ at fr were calculated from and σ = 2πε0εrΔf, where c is the speed of light in vacuum, Δf is the bandwidth of the resonance at fr, p′ = 1.8412 (the first zero crossing of the first derivative of a Bessel function of the first kind), ε0 = 8.854 × 10⁻¹²F/m, and relative permeability μr is 1.
FIG. 1.

Resonant cavities used to characterize the BaTiO3 bead slurry. [Color figure can be viewed in the online issue, which is available at wileyonlinelibrary.com.]
MR Experiment
All images were acquired on a Siemens 3T Trio system (Siemens, Erlangen, Germany) with the system body birdcage coil used in transmission and a single loop coil (11-cm diameter, Siemens, Erlangen, Germany) used in reception. A cylindrical quality control phantom (diameter 12 cm, length 21 cm, containing 1900 mL water with NiSO4 and NaCl Siemens, Erlangen, Germany) was used to evaluate the effects of each slurry, which was packed in a Petri dish (9-cm diameter and 1.7-cm deep) laid on the top center of the phantom as shown in Figure 2. To ensure the dielectric material exhibited no self-resonance near the imaging frequency, a network analyzer (N9912A, Agilent Technologies) and small transmit/receive loop were used to examine S11 of the various materials in the Petri dish. No dielectric materials exhibited resonances within 100 MHz of the Larmor frequency at 3 T. Experimental data under four different configurations were taken: (1) no dielectric material present; (2) Petri dish packed with CaTiO3 powder slurry, (3) Petri dish packed with BaTiO3 powder slurry, and (4) Petri dish packed with BaTiO3 bead slurry. In each case, the Petri dish was placed between the single loop coil and phantom. The positions of the single loop coil, Petri dish, and phantom were fixed for all measurements, so that the distance between coil and phantom was constant. The quality factor (Q) of the coil was found to vary only 0.4% with addition of the dielectric pad.
FIG. 2.

Geometry of transmit birdcage coil, phantom, and receive surface coil as modeled in simulation. Quality control phantom and the Petri dish filled with dielectric material are shown as the blue cylinder and the white disk at the center of the 16-element transmit body-size birdcage coil. Part of the shield is also shown. The single loop receive coil was 15 mm above the Petri dish. [Color figure can be viewed in the online issue, which is available at wileyonlinelibrary.com.]
The distribution of the field in all experimental configurations was accomplished with the actual flip-angle imaging (AFI) technique (16). AFI scans utilized a nonselective hard pulse with a duration of 300 μs and a nominal flip angle of 60°. The voltage of the hard pulse was determined using the scanner's automated calibration routine without any dielectric material present, and this value was used for all AFI scans. The acquisition parameters for the AFI scans are: echo time/pulse repetition time 1/pulse repetition time 2 (TE/TR1/TR2) of 3/25/125 ms, 3D matrix size of 96 × 96 × 44, resolution of 3 × 3 × 3 mm3. RF and gradient spoiling were applied to remove effects of residual transverse magnetization (17).
Receive sensitivity () distributions were mapped with a gradient-refocused echo (GRE) sequence in conjunction with the aforementioned AFI scan. The GRE scan utilized a nonselective hard pulse with a duration of 300 μs, a nominal flip angle of 30°, and the transmit voltage set at 50% of the value used in the AFI scans. The TE/TR was 3/40 ms, and the 3D matrix size and field of view were identical to the AFI scan. RF and gradient spoiling were implemented to remove effects of residual transverse magnetization (18).
The image intensity in the GRE image is given by the following expression:
| [2] |
where K is the system scaling factor, and M0 is the equilibrium magnetization. The fraction term depends on the applied flip angle, the TR, and the T1 value of the phantom. Utilizing the flip angle map from the AFI scan, the known TR, and the known T1 of the phantom (291 ms), it is possible to compute this term and remove it from the GRE image. The remaining term is a function of the field and a constant term [K · M0 · ] that is removed when the and SNR at all locations in all cases are normalized to the value at the location of interest with no dielectric material present.
SNR was determined by dividing the signal intensity of the GRE image by the standard deviation of pixel intensities across an entire noise-only scan, acquired with identical parameters to those of the GRE image but with the RF pulses turned off.
Simulation
A 16-element birdcage coil (62-cm diameter, 48-cm length, with shield 68 cm in diameter and 1.2 m in length) was modeled and driven with unit current sources having a phase appropriate to simulate the ideal mode 1 resonance at 123.26 MHz placed in the middle of each end ring segment. The quality control phantom was modeled as a cylinder (12-cm diameter, 21-cm height) having electrical properties εr = 82.12 and σ = 0.97 S/m (determined by experimental measurement using an Agilent E4991A Impedance analyzer with Agilent 85070D dielectric probe kit) placed in the center of the birdcage coil with its central axis perpendicular to the rungs of the birdcage coil. A single loop receive coil was modeled as a copper ring (thin sheet of copper with outer diameter 11.5 cm, inner diameter 10.5 cm) having a single gap (as in experiment) and excited by an unit current source. It was located 3.5 cm away from the cylindrical phantom as in experiment. The Petri dish with dielectric material was simulated as a cylinder (diameter 8.73 cm, height 1.78 cm) positioned between the single loop coil and the phantom, as in experiment. The dielectric properties used for the high-dielectric slurries in this simulation were as determined with the experiments described earlier: CaTiO3 powder slurry (εr = 110, σ = 0.06 S/m), BaTiO3 powder slurry (εr = 333, σ = 0.725 S/m), and BaTiO3 bead slurry (εr = 515, σ = 0.35 S/m). The simulation geometry used in this study is shown in Figure 2.
The voxel-based (dv = 8 mm3) transmit sensitivity map (|B1+|) and receive sensitivity map (|B1−|) were calculated from the larger circularly polarized component of the magnetic field generated by the birdcage coil and the counter-rotating component of the magnetic field generated by the single loop coil with each dielectric material present (19). The flip angle (α) at each voxel was obtained as
| [3] |
where γ is the gyromagnetic ratio, the normalization factor Vτ (proportional to driving voltage times pulse duration) was determined by minimizing the difference (least mean square) between the experimental and simulated flip angle maps in the case with no dielectric material present (20). The intrinsic SNR of a short TR spoiled gradient echo sequence was calculated as (21,22)
| [4] |
where TR is 40 ms, T1 is 291 ms, flip angle θ for this short TR spoiled gradient echo sequence is α/2 (equivalent to a nominal 30° pulse as used in experiment), and Pdiss is total power dissipated in the phantom, dielectric material, and receive coil with the single loop coil driven with unit current. Power dissipated in the phantom and dielectric material were determined with the numerical calculations, and power dissipated in the coil was determined using an analytical approximation. All field computations were performed with the finite difference time domain numerical method using commercially available software (XFDTD; Remcom, Inc., State College, PA), and postprocessing of the EM fields was performed using Matlab (The Mathworks, Natick, MA).
RESULTS
The electrical properties of the BaTiO3 slurries as measured using the coaxial probe (powder-based slurries) and the resonant cavity (bead-based slurry) are reported in Table 1.
Table 1.
Dielectric Properties of Saturated Slurries
| Achieved volume ratios |
123 MHz |
300 MHz |
||||
|---|---|---|---|---|---|---|
| Vdiel/VH2O | Vdiel/Vtotal | σ (S/m) | ε r | σ (S/m) | ε r | |
| CaTiO3 powder | 0.40 | 0.29 | 0.060 | 110 | 0.083 | 107 |
| BaTiO3 powder | 0.35 | 0.26 | 0.72 | 333 | 0.97 | 319 |
| BaTiO3 beads | 0.92 | 0.45 | 0.35 | 515 | 0.62 | 487 |
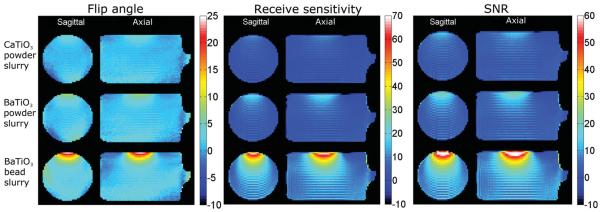
The flip angle, receive sensitivity, and SNR on the mid-sagittal and mid-axial planes in experiment and simulation are shown in Figure 3. The receive sensitivity and SNR maps were normalized by the value at a location in the phantom one coil radius from the receive coil when no dielectric material was present. Flip angle maps exhibit high values near the center of the phantom due to constructive interference from elements of the transmit birdcage coil (23), and the distribution of the receive sensitivity is typical for a single loop coil (22). The SNR maps were very similar to the receive sensitivity maps, because the flip angle is relatively homogeneous and the measured noise with different dielectric materials present was similar (between 3.6 × 10⁻¹⁰ and 3.7 × 10⁻¹⁰). The flip angle, receive sensitivity, and SNR all increase in the region near the dielectric material as εr of the material increases.
FIG. 3.

Distribution of flip angle (left column), receive sensitivity (center column), and SNR (right column) on mid-sagittal and mid-axial planes through the phantom in experiment (top row) and simulation (bottom row) with and without a Petri dish filled with various materials. Values for SNR and receive sensitivity are normalized to the experimental value at the center of the phantom with no dielectric material present.
We show the percent difference of experimentally measured distributions of flip angle, receive sensitivity, and SNR in Figure 4. The pixel-wise percent difference was calculated as (ValueDiel – Value NoDiel)/ValueNoDiel × 100%. The greatest increases were observed directly beneath the center of the Petri dish packed with the BaTiO3 bead slurry: increases greater than 20% in flip angle, 65% in receive sensitivity and 75% in SNR. For the CaTiO3 powder slurry, these increases were 4% in flip angle, 11% in receive sensitivity, and 13% in SNR. For the BaTiO3 powder slurry, these values were 7, 20, and 23%. Increases of this size are in line with other reported results using passive dielectric materials (24).
FIG. 4.
Experimentally measured percent difference in flip angle (left), receive sensitivity (center), and SNR (right) on mid-sagittal and mid-axial planes through the phantom with a Petri dish filled with different materials. The percentage change is calculated using the data measured with each respective dielectric material with respect to the data measured with no dielectric material present.
Figure 3 shows fairly good agreement between experimental and simulated results. To more closely examine the agreement, experimental and simulated flip angle, receive sensitivity, and SNR along the coil axis are plotted together in Figure 5.
FIG. 5.

Flip angle (top row), receive sensitivity (center row), and SNR (bottom row) along the receive coil axis in simulation (line) and experiment (+) for four different experimental conditions. Horizontal axis represented the distance from the top to the bottom of the phantom. Values for SNR and Receive sensitivity are normalized to the experimental value at the center of the phantom with no dielectric material present.
DISCUSSION
A new dielectric material suitable for creation of flexible high-dielectric pads, a BaTiO3 bead slurry, was manufactured and characterized. Having a higher εr than dielectric materials used in flexible pads for previous MRI studies, a given volume of it has a greater effect on the RF fields, and in principle it should be able to produce desired effects with a smaller volume than required using other materials with lower εr. This could be advantageous in applications with limited space between the sample and the coil. In the slurries used here, the εr of BaTiO3 bead slurry reached about 515. Use of liquid with higher permittivity than water to form the slurry could increase the permittivity further, but for pads adjacent the human body it is also necessary to ensure safety in the event of any leak. The electrical properties of powder-based slurries were comparable to those previously reported (13), and the relative permittivity of the bead slurry was in the range predicted using the Lichtenecker's logarithmic law (25). As expected, the bead slurry had the highest εr of all the flexible dielectric materials used in MRI research to date (1–13) because of its high volume fraction and inherent high εr of solid BaTiO3 (26). With strategic use of different size beads to maximize the volume ratio of BaTiO3 (27), it should be possible to achieve values of 800 or more. Consistent with previous works (7), the conductivity of BaTiO3 slurries is significantly higher than CaTiO3 slurries. The BaTiO3 slurry is expected to have higher σ than the CaTiO3 slurry, because the solubility of BaTiO3 is one order magnitude higher than that of CaTiO3 (28,29) resulting in more ions in solution for the BaTiO3 slurry. Although it is generally expected that both permittivity and conductivity of slurries will increase with increase in volume fraction of the dielectric material (13), using sintered beads we were able to increase the permittivity while decreasing the conductivity of a saturated slurry in comparison to a slurry made with powder. The surface area of the BaTiO3 beads is lower than that of the powder, resulting in less BaTiO3 dissolved into the medium and lower σ.
The results from this study indicate that for dielectric materials with εr up to 515, effects on SNR and receive sensitivity at 3 T improve with greater εr. This finding supports the explanation of the effect using Ampere's law described previously, where higher permittivity materials should produce greater local enhancement. A different potential explanation for the effect of dielectric material is that the dielectric material layer provides impedance matching such that the RF field inside the phantom is improved. Using a plane wave analysis, the reflection coefficient from air to the quality phantom for a normally incident plane wave has a magnitude of 0.87. This is reduced only to 0.866 when a 1.78-cm layer of CaTiO3 powder slurry is added, 0.854 for BaTiO3 powder slurry and 0.840 for BaTiO3 bead slurry. The reflection coefficient decreases as the relative permittivity of the dielectric layer increases, but the small decrease in reflection coefficient (1–4%) is not enough to explain the large increase in receive sensitivity and SNR seen here. Also, to have a perfect matching condition (which requires the thickness of the dielectric layer in quarter wavelength), the electrical properties of the dielectric material should be εr = 11.09 and σ = 0.0444 S/m. In short, a simple analysis based on classical impedance matching alone does not provide a good explanation for the observations in this study.
Conductive material in the vicinity of receive coils can be a source of noise. In this and prior studies using similar materials, no increase in noise level is seen when the dielectric pads are introduced, though the conductivities of the pads can be in the range of those for human tissues. The relatively small volume of dielectric material compared to sample material partly explains this result, with the total power dissipated in the sample when the receive coil is driven with 1 A being greater than that induced in the sample. Additionally, in this study the receive coil is fairly lightly loaded, resulting in coil noise dominance. Nonetheless, to minimize adverse effects in future applications, low-conductivity dielectric materials are generally preferred.
To determine the optimum geometry and electrical properties for high-dielectric materials in future applications, numerical calculations could be very useful, provided they can be trusted to produce accurate results. The comparison between experiment and simulation data shown in Figures 3 and 5 is a good demonstration of the accuracy of the numerical calculation. Some minor differences between simulation and experiment can be seen. Such differences may be due to minor differences between the experimental and simulated geometries and uncertainty in measurement of the dielectric properties of materials.
In summary, we have demonstrated the ability to increase permittivity while decreasing conductivity of flexible dielectric materials by use of sintered ceramic beads rather than ceramic powder in a slurry. This increases the available range of permittivity values for flexible pads. We have also shown the ability to use simulations to accurately predict results of dielectric pads on MR images when the geometry of the pads, coil, and phantom are modeled accurately. Such a demonstration of accuracy is important before performing further numerical studies to design pads for maximum benefit within space constraints. With future numerical studies, it should be possible to rapidly evaluate designs for optimal performance, and with a larger range of available material properties, it should be possible to implement a wider variety of designs in practice.
ACKNOWLEDGMENTS
The authors are grateful for valuable discussions with Zhipeng Cao and Andrew Webb.
Grant sponsor: NIH; Grant number: R01 EB000454.
REFERENCES
- 1.Takayama Y, Nonaka H, Nakajima M, Obata T, Ikehira H. Reduction of a high-field dielectric artifact with homemade gel. Magn Reson Med Sci. 2008;7:37–41. doi: 10.2463/mrms.7.37. [DOI] [PubMed] [Google Scholar]
- 2.Sreenivas M, Lowry M, Gibbs P, Pickles M, Turnbull L. A simple solution for reducing artefacts due to conductive and dielectric effects in clinical magnetic resonance imaging at 3T. Eur J Radiol. 2007;62:143–146. doi: 10.1016/j.ejrad.2006.11.014. [DOI] [PubMed] [Google Scholar]
- 3.Schmitt M, Feiweier T, Horger W, Krueger G, Schoen L, Lazar R, Kiefer B. Improved uniformity of RF-distribution in clinical whole body-imaging at 3T by means of dielectric pads. Proceedings of the 12th Annual Meeting of ISMRM; Kyoto, Japan. 2004. p. 197. [Google Scholar]
- 4.Yang QX, Wang J, Wang J, Collins CM, Wang C, Smith MB. Reducing SAR and enhancing cerebral signal-to-noise ratio with high permit-tivity padding at 3 T. Magn Reson Med. 2011;65:358–362. doi: 10.1002/mrm.22695. [DOI] [PMC free article] [PubMed] [Google Scholar]
- 5.Yang QX, Herse ZG, Ketterman M, Wang J, Sica C, Collins CM, Wang J, Lanagan M. Enhancement of RF field by high dielectric constant pad at 3T: cervical spine imaging. Proceedings of the 19th Annual Meeting of ISMRM; Montreal, Canada. Montreal: 2011. p. 621. [Google Scholar]
- 6.Snaar J, Teeuwisse WM, Versluis MJ, Buchem Mv, Kan HE, Smith NB, Webb AG. Improvements in high-field localized MRS of the medial temporal lobe in humans using new deformable high-dielectric materials. NMR Biomed. 2010;24:873–879. doi: 10.1002/nbm.1638. [DOI] [PubMed] [Google Scholar]
- 7.Haines K, Smith N, Webb A. New high dielectric constant materials for tailoring the distribution at high magnetic fields. J Magn Reson. 2010;203:323–327. doi: 10.1016/j.jmr.2010.01.003. [DOI] [PubMed] [Google Scholar]
- 8.Alsop DC, Connick TJ, Mizsei G. A spiral volume coil for improved RF field homogeneity at high static magnetic field strength. Magn Reson Med. 1998;40:49–54. doi: 10.1002/mrm.1910400107. [DOI] [PubMed] [Google Scholar]
- 9.Neufeld A, Landsberg N, Boag A. Dielectric inserts for sensitivity and RF magnetic field enhancement in NMR volume coils. J Magn Reson. 2009;200:49–55. doi: 10.1016/j.jmr.2009.06.001. [DOI] [PubMed] [Google Scholar]
- 10.Yang QX, Mao W, Wang J, Smith MB, Lei H, Zhang X, Ugurbil K, Chen W. Manipulation of image intensity distribution at 7.0 T: passive RF shimming and focusing with dielectric materials. J Magn Reson Imaging. 2006;24:197–202. doi: 10.1002/jmri.20603. [DOI] [PubMed] [Google Scholar]
- 11.Teeuwisse WM, Haines KN, Smith NB, Webb AG. New barium titanate based dielectric materials for high field imaging. Proceedings of the 19th Annual Meeting of ISMRM; Montreal, Canada. 2011. p. 622. [Google Scholar]
- 12.Webb AG. Dielectric materials in magnetic resonance. Concept Magn Res A. 2011;38A:148–184. [Google Scholar]
- 13.Teeuwisse WM, Brink WM, Haines KN, Webb AG. Simulations of high permittivity materials for 7 T neuroimaging and evaluation of a new barium titanate-based dielectric. Magn Reson Med. 2012;67:912–918. doi: 10.1002/mrm.24176. [DOI] [PubMed] [Google Scholar]
- 14.Fang CY, Randal CA, Lanagan MT, Agrawal DK. Microwave processing of electroceramic materials and devices. J Electroceram. 2009;22:125–130. [Google Scholar]
- 15.Pozar DM. Microwave engineering. Addison-Wesley Publishing Compnay; Reading, MA: 1990. [Google Scholar]
- 16.Yarnykh VL. Actual flip-angle imaging in the pulsed steady state: a method for rapid three-dimensional mapping of the transmitted radiofrequency field. Magn Reson Med. 2007;57:192–200. doi: 10.1002/mrm.21120. [DOI] [PubMed] [Google Scholar]
- 17.Nehrke K. On the steady-state properties of actual flip angle imaging (AFI) Magn Reson Med. 2009;61:84–92. doi: 10.1002/mrm.21592. [DOI] [PubMed] [Google Scholar]
- 18.Yarnykh VL. Optimal radiofrequency and gradient spoiling for improved accuracy of T1 and B1 measurements using fast steady-state techniques. Magn Reson Med. 2010;63:1610–1626. doi: 10.1002/mrm.22394. [DOI] [PubMed] [Google Scholar]
- 19.Collins CM, Smith MB. Calculations of B1 distribution, SNR, and SAR for a surface coil adjacent to an anatomically-accurate human body model. Magn Reson Med. 2001;45:692–699. doi: 10.1002/mrm.1092. [DOI] [PubMed] [Google Scholar]
- 20.Collins CM, Smith MB. Signal-to-noise ratio and absorbed power as functions of main magnetic field strength, and definition of “90°” RF pulse for the head in the birdcage coil. Magn Reson Med. 2001;45:684–691. doi: 10.1002/mrm.1091. [DOI] [PubMed] [Google Scholar]
- 21.Collins CM, Webb AG. Quadrature surface coils. Encyclopedia Magn Reson. 2010 doi:10.1002/9780470034590.emrstm1115. [Google Scholar]
- 22.Haacke EM, Brown RW, Thomson MR, Venkatesan R. Magnetic resonance imaging—physical principles and sequence design. Wiley-Liss; New York: 1999. p. 455. [Google Scholar]
- 23.Collins CM, Liu W, Schreiber W, Yang QX, Smith MB. Central brightening due to constructive interference with, without, and despite dielectric resonance. J Magn Reson Imaging. 2005;21:192–196. doi: 10.1002/jmri.20245. [DOI] [PubMed] [Google Scholar]
- 24.Webb AG, Teeuwisse WM, Brink WM. Quantitative assessment of the effects of high-permittivity pads in 7 Tesla MRI of the brain. Magn Reson Med. 2011;67:1285–1293. doi: 10.1002/mrm.23108. [DOI] [PubMed] [Google Scholar]
- 25.Simpkin R. Derivation of Lichtenecker's logarithmic mixture formula from Maxwell's equations. IEEE Trans Microwave Theory Tech. 2010;58:545–550. [Google Scholar]
- 26.Dogan F, Petrovsky V, Petrovsky T, Kamlapurkar S. Dielectric constant of barium titanate powders near Curie temperature. J Am Ceram Soc. 2008;91:3590–3592. [Google Scholar]
- 27.McGeary RK. Mechanical packing of spherical particles. J Am Ceram Soc. 1961;44:513–522. [Google Scholar]
- 28.Nesbitt HW, Bancroft GM, Fyfe WS, Karkhanis SN, Nishijima A, Shin S. Thermodynamic stability and kinetics of perovskite dissolution. Nature. 1981;289:358–362. [Google Scholar]
- 29.Neubrand A, Lindner R, Hoffmann P. Room-temperature solubility behavior of barium titanate in aqueous media. J Am Ceram Soc. 2000;83:860–864. [Google Scholar]