

Abstract
Background
Performing optogenetic experiments in a behaving animal presents a unique technical challenge. In order to provide an optical path between a fixed light source and a chronically implanted fiber in a freely moving animal, a typical experimental set-up includes a detachable connection between the light source and the head of the animal, as well as a rotary joint to relieve torsional stress during movement.
New Method
We have combined the functionality of the head mounted connector and the rotary joint into a single integrated device that is inexpensive, simple to build and easy to use.
Results
A typical rotary connector has a transmission efficiency of 80% with a rotational variability of 4%, but can be configured to have a rotational variability of 2% at the expense of lower transmission efficiency. Depending on configuration, rotational torque ranges from 14 - 180 μN*m, making the rotary connector suitable for use with small animals such as mice.
Comparison with Existing Methods
Benchmark tests demonstrate that our connectors perform similarly to commercially available solutions in terms of transmission efficiency, rotational variability, and torque but at a fraction of the cost. Unlike currently available solutions, our unique design requires a single optical junction which significantly reduces overall light loss. In addition, magnets allow the connectors and caps to “snap into place” for quick yet reliable connection and disconnection.
Conclusions
Our rotary connector system offers superior performance, reduced cost, and is easily incorporated into existing optogenetic set-ups.
Keywords: Optogenetics, Optical fibers, Chronic implantation
1. Introduction
Optogenetic techniques allow neuroscientists to functionally dissect the microcircuitry of the brain by putting the activity of specific, genetically defined, neuronal subtypes under experimental control (Boyden et al., 2005; Zhang et al., 2007; Han and Boyden, 2007; Yizhar et al., 2011 for review). Viral vectors and/or transgenic techniques are first used to express light sensitive ion channels within the population of interest. Illuminating cells that express these channels produces a rapid change in membrane potential, which modifies neural activity. Depending on the type of optogenetic protein used, one can either depolarize or hyperpolarize a cell thereby manipulating the ability of that cell to fire action potentials. In this way the activity of a particular subset of neurons can be studied in relation to its function and interactions within local circuits, and to larger neural networks, extending to the behavior of the animal (Bass et al., 2010; Huber et al., 2008; Ramirez et al., 2013; Tsai et al., 2009; van Zessen et al., 2012).
In order to illuminate cells of interest in an awake behaving animal, lightweight fiber optic cables previously developed for the communications industry have been used to guide light from an external source, such as a laser or LED. To prevent mechanical damage to the brain, a small length of fiber is implanted over the stimulation site and securely affixed to the skull. A head-mounted connection point allows the animal to be disconnected from the cable so that it may behave normally when not involved in an experiment (Aravanis et al., 2007; Sparta et al., 2012; Ung and Arenkiel, 2012). In order to allow the head of the animal to move freely when connected to the light source, an additional rotary joint is placed in the fiber between the animal and the light source.
Commercial rotary joints suitable for optogenetic experiments have reported transmission efficiencies of 65, 85%, and 90% (Thorlabs, Inc., Doric Lenses, Inc., and Prizmatix Ltd. respectively). When combined with a standard zirconia connector at the head of the animal with an efficiency of 85%, the total light transmission is reduced to 55, 72, and 68% respectively (see table 1). In addition, rotary joints rely on precisely machined parts, ball bearings, and lenses which make them costly to produce. We have developed an inexpensive, head-mounted connector that allows for free rotation without the need for an additional rotatory joint.
Table 1.
Comparison of reported specifications.
| Rotary System | Trans. Eff. (%) | Total Eff. (%)a | Rot. Var.(%) | Torque (μN*m) | Cost Estimate (US$) |
|---|---|---|---|---|---|
| Our Design | 82 | 82 | 4.1 | 64 | $26 |
| Doric Lenses | 85 | 72 | 3 | 20 | >$500 |
| ThorLabs | 65 | 55 | 7 | <10000c | $300 |
| Prizmatix | 89b | 68b | 4.5 | NA | >$500 |
Notes:
Total efficiency refers to the combined loss in the rotary joint and a standard head mounted zirconia connector (estimated at 85% efficiency, see (Sparta et al., 2012)).
The Prizmatix rotary joint relies on a large to small diameter coupling scheme. Their calculations are based the ratio of the transmission of their rotary joint to that of an equivalent fixed connection, rather than to that of an unbroken fiber. In order to provide a comparable estimate to that of the others, the total efficiency of the Prizmatix rotary joint is estimated as 0.85 (implant connector) * 0.9 (rotary joint) * 0.9 (equivalent FC/PC connection) * 100 = 68%.
Thorlabs Inc. reports an estimate of “startup torque” for their rotary joint which might be expected to be slightly greater than the kinetic torque measurements reported here (depending on the difference between static and kinetic friction in their rotary joint).
Sources: Doric Lenses Fall 2013 – 8.0b Optogenetics Catalog (http://www.doriclenses.com/administrer/upload/pdf/Product_catalog_RELEASE_8b-WEB_131224_doricl97_test_zH24tC.pdf), ThorLabs website (http://www.thorlabs.com/newgrouppage9.cfm?objectgroup_id=6865) as of 1/21/2014, Prizmatix Rotary Joint datasheet v.10 (http://www.prizmatix.com/pdf/optogenetics/OG-Rotary-Joint.pdf).
2 Materials and Methods
2.1 Overview
Our unique design uses commercially available zirconia ferrules (Precision Fiber Products, Milpitas, CA) with ring-shaped neodymium magnets (K & J Magnetics, Jamison, PA) to provide a secure connection while maintaining free rotation of the connector joint. The system consists of implantable magnetic fiber optic connectors, a patch cable to guide light from an external source (LED or laser) to the implanted connector, protective magnetic caps, a cap removal tool, and a magnetic holder for stereotaxic surgery (fig. 1).
Fig. 1.

Schematic of magnetic rotary optical fiber connection system. A. The light source is coupled to the experimental animal via an implanted connector embedded in a head cap made of dental cement. Optional stainless steel support wires in the cable increase rigidity, prevent coiling, and maintain the fiber in a position out of reach of the animal. B. Cross-section of magnetic rotary fiber connector. C. Cross section of the magnetic dust cap and cap extractor.
2.2 Patch cable
A length of fiber optic cable was constructed to transmit light from a source (DPSS laser or LED) to the implanted fiber (see below). A standard commercial connector (FC or SMA) was used on the light source side of the cable (not shown), while a zirconium ferrule assembly glued to a ring-shaped neodymium magnet was used on the implant side (fig. 2). A length of 17 gauge cannula can be used to ensure proper spacing of the magnet around the ferrule during construction (fig. 2 D,E). In order to prevent coiling and keep the cable out of reach of the animal, two lengths of 0.017 inch stainless steel were included in the cable and glued to the connectors on both sides, then covered with heat shrink tubing (care was taken not to overheat the magnets in the assembly to avoid de-magnetizing them). The stainless steel wires also act as a spring that eliminates the need for a counter balance system when the light source is mounted horizontally (fig. 1A). Alternatively, a ring-shaped magnet could be glued to a commercially available patch cable that terminates in a bare ferrule (eg. Thorlabs part# M83L01). Multiple patch cables can be produced with identical spacing by using an implant connector as a template to position the magnet.
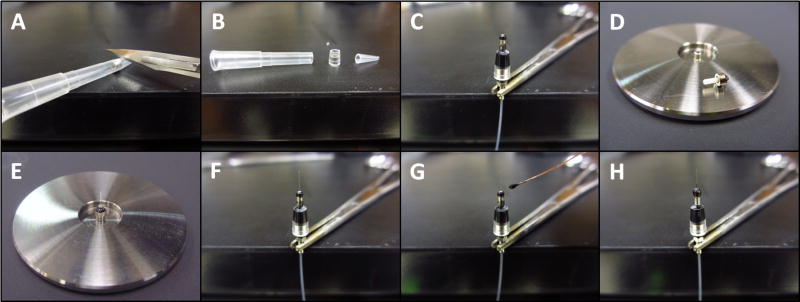
Fig. 2.

Construction of source connector (animal facing patch cable termination). A. Ceramic ferrule assembly. B. Rough cut fiber with stripped buffer is glued into the ferrule assembly. C. The fiber is polished using standard techniques. D. A 17 gauge TW cannula is placed over the polished ferrule in order to center the magnet. E. A ring shaped magnet is placed over the 17 gauge cannula and glued in place using rubberized cyanoacrylate + accelerant. F. The cannula is then removed and glue is used to fill in space between the magnet and the ferrule. After the glue dried, the excess can be cut away with a scalpel blade.
2.3 Implanted rotary connector
The implanted connector was constructed from a zirconia ferrule housed in a length of 17 gauge thin wall stainless steel cannula (fig. 3 & 4). The implanted fiber was contained within the ferrule and a ring shaped magnet was used to provide a secure connection. A purpose built template (or the patch cable) was used for construction of the implant (fig. 3A and S2). In order to eliminate friction between the magnets, a spacer was used during construction to hold the magnets apart (half of a double-edged razor blade works well), (fig. 3 E-I). The torque required to rotate the connectors is proportional to the pull strength of the magnetics (due to friction between the zirconia ferrules). Additional spacers or demagnetization could be used to customize the pull strength of the magnets and therefore the torque required to rotate the connector (fig. 7A & B). Another critical parameter that affected the coupling efficiency and rotational variation (see fig. 7A & C) was the spacing between the patch cable and the implanted fiber. A small amount of space (<5 μm) was desirable to prevent damage to the fiber tips and larger spacing (20 μm or more) reduced rotational variation at the expense of coupling efficiency. This could be achieved by using a template with a thin film of glue or epoxy polished to the desired thickness to construct the implantable connectors (fig. S2).
Fig. 3.
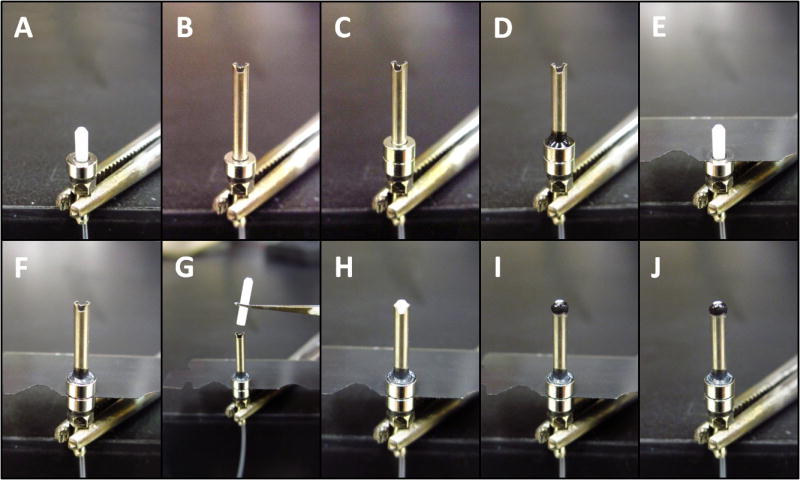
Construction of implantable connector (step 1). A. The source fiber or a purpose built template is used to construct the implant (see figure S2 for details of template construction). B. A 17 gauge cannula, cut to size, notched (to help glue adhere), de-burred, and cleaned, is placed over the template. C. & D. A ring-shaped magnet is glued to the cannula. E. The cannula and magnet are removed and one or more spacers (0.1 mm thick) are placed on the assembly (a razor blade is ideal). F. The cannula and magnet are placed back on the assembly. G. & H. A zirconia ferrule is placed into the cannula (concave side down) and pushed down until it contacts the template ferrule. I. & J. The ferrule is glued to the cannula (being careful not to get glue or accelerant into the hole) and the spacer is removed. The glue at the tip is easily broken at this stage so be careful to avoid disconnecting and re-connecting the magnets too forcefully.
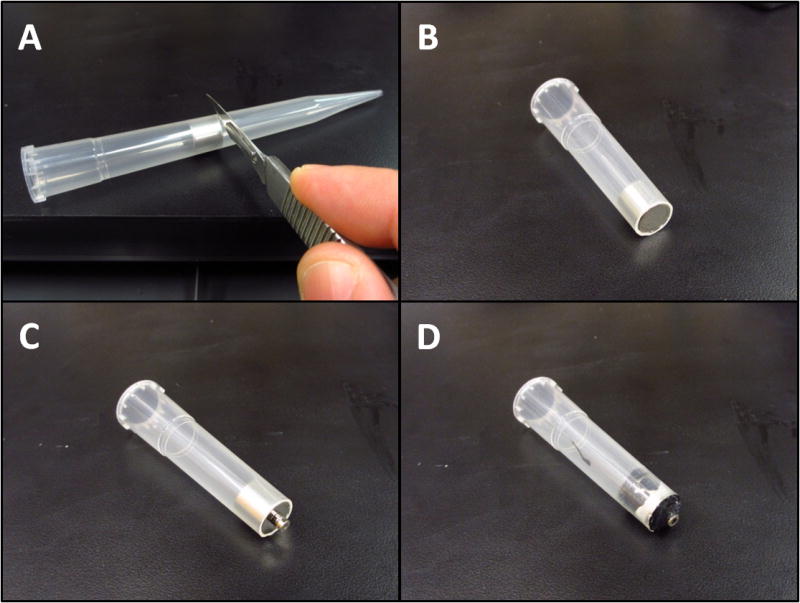
Fig. 4.
Finishing implantable connector (step 2). A. & B. The protective cap is constructed from a 200 μl pipette tip. Two ring-shaped magnets are pushed into the pipette tip until they are slightly snug and centered. A scalpel blade is used to cut the tip flush on the wide side and with some extra space on the narrow side. C. The magnets are removed and the plastic is slid over the implant assembly constructed in step 1. Care is taken to center the plastic on the assembly and ensure that the source side magnet does not contact the cup during rotation. Glue is then applied and allowed to flow between the cannula and the cup. D. Construction of a ferrule insert for polishing short sections of bare fiber. The ferrule insert consists of a ferrule inserted into the polishing disk (convex side down) until it is flush with the bottom of the disk, and a ring-shaped magnet is glued on top to keep it in place. Alternatively, one could use a bare ferrule polishing disk with set screw (ie. Thor Labs D50-L). E. Polishing bare-fiber sections. A light touch is needed to provide enough pressure on the fiber to polish it without breaking it or damaging the cladding. Tight fitting gloves help to improve grip on the fiber. F. The fiber is then inserted into the implant from the exposed end and care is taken to avoid damaging the cladding. A gentle twisting motion helps to guide the fiber into place. G. Once the fiber is flush against the template, it can be glued to the ferrule. H. The finished implant. A recording electrode can now be glued to the fiber and additional glue applied to cover the cannula to increase durability (not shown).
Fig. 7.
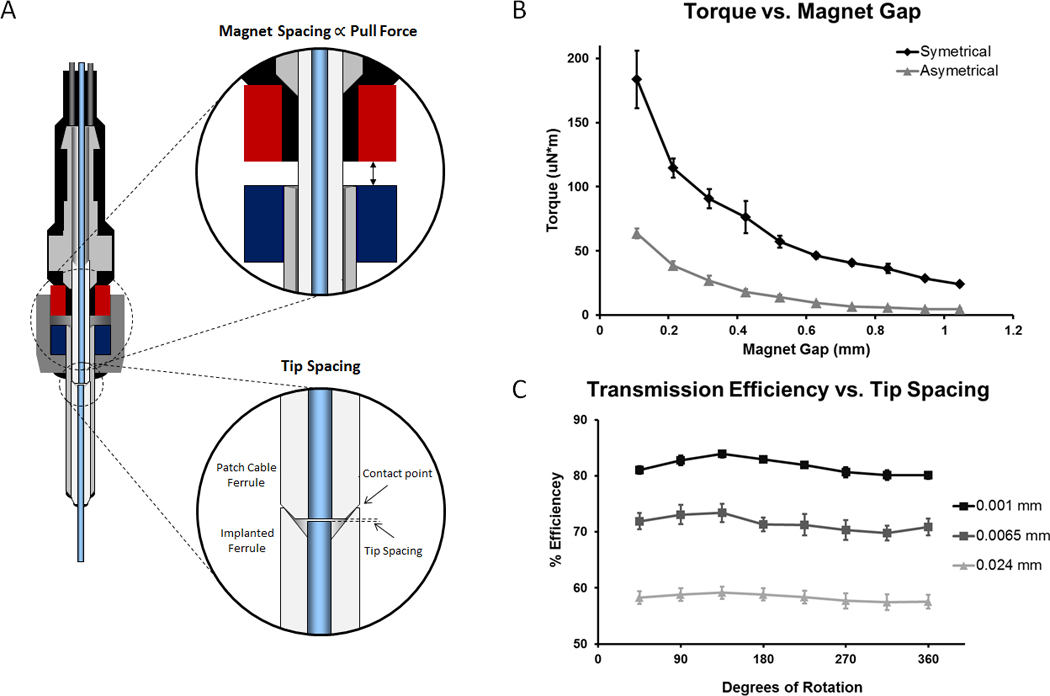
Customizable Parameters – Torque and Tip Spacing. A. Diagram showing magnet spacing and tip spacing. B. The effect of magnet spacing on rotational torque with two un-altered magnets (symmetrical) and with a single side de-magnetized by heating (asymmetrical). Introducing a larger gap between the magnets reduced the attractive force of the magnets as well as the torque required to rotate the connectors. C. The effect of tip spacing on transmission efficiency and rotational variation. Increasing the fiber tip spacing reduced coupling efficiency but also reduced rotational variation. Tip spacing: Close (0.001 mm), 81.74 ± 0.57% eff., 4.13 ± 0.82% rot. var., n = 4, Mid (0.0065 mm), 71.40 ± 1.44% eff., 4.04 ± 0.65% rot. var., n = 4, Far (0.024 mm), 58.27 ± 1.17% eff., 2.17 ± 0.44% rot. var., n = 5 (all values ± SEM).
2.4 Dust caps and extraction tool
Magnetic dust caps were crafted from disk shaped neodymium magnets that were held in place by a plastic ring constructed from a standard 200 μl pipette tip (fig. 4 A-C). A magnetic cap extractor, used to remove the dust caps prior to the start of an experiment, was constructed from a larger cylinder shaped neodymium magnet glued to a smaller disk shaped magnet and housed within a standard 5 ml pipette tip (fig. 5).
Fig. 5.
Construction of magnetic cap puller. A. Insert large cylinder shaped magnet snuggly into a 5 ml pipette tip (or similar plastic cylinder). The pipette tip is cut flush with the magnet. B, C, & D. Two ring-shaped magnets are attached to the larger magnet and then glued in place (leaving the surface of the last magnet exposed). Excess glue can be removed using a scalpel blade.
2.5 Magnetic Stereotax Holder
A magnetic holder for the implant was constructed by gluing one or more magnets on the end of a stainless steel rod (fig. 6). In order to ensure that the implant is aligned with the z-axis of the stereotaxic frame, the magnet was placed on a flat surface of the stereotaxic device and the rod was lowered onto it using the stereotaxic arm, and then glued. During surgery, once the implant is in positioned and fixed to the skull, the tip of a scalpel blade was used to separate the implant from the holder while the holder was withdrawn.
Fig. 6.
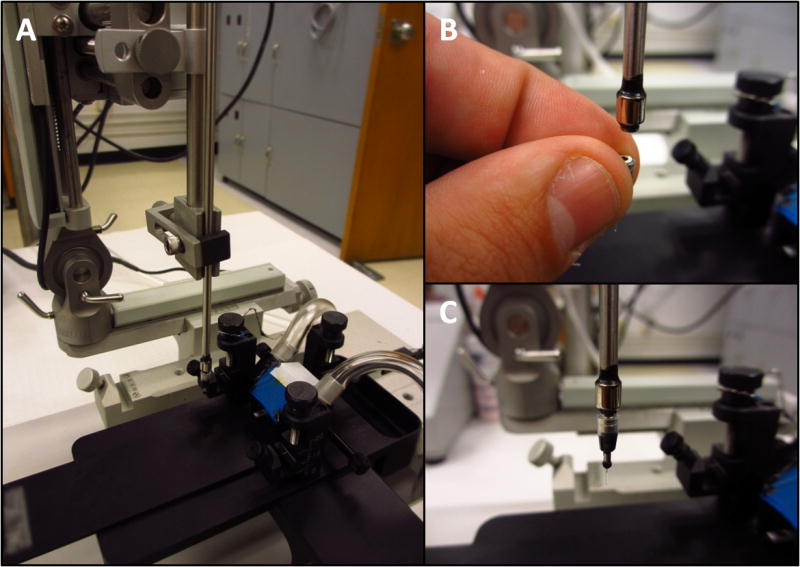
Construction of stereotaxic holder. A simple magnetic holder for stereotaxic placement of the implantable connector.
2.6 Transmission efficiency, rotational variation, and torque measurements
Transmission efficiency and rotational variation were measured using a stable LED light source (< 1% variation over 10 minutes) and a photodiode mounted in an integrating sphere (Part# S140A, Thorlabs, Newton, NJ, USA). Light output was measured from the tip of the implant fiber assembly at 45 degree intervals and divided by the light output from the tip of the unconnected patch cable to obtain the transmission efficiency. Rotational variation is defined as the difference between the highest and lowest transmission efficiency obtained during rotation. Measurements were repeated 3 times per connector and averaged. Transmission efficiency and rotational variability were calculated for each individual connector to obtain the mean ± SEM for each group. In a separate analysis, the arbitrary phase of each trace was shifted to align the peaks prior to obtaining an average trace (fig. 7C).
Torque measurements were obtained by attaching a 2 cm arm to the implanted connector and connecting it to a rotating male (source cable) connector on the end of a motorized spindle and adding weights to the end of the measurement arm until it remained perpendicular to the pull of gravity during rotation (fig. S1). Torque was calculated as
| (1) |
where m is the mass of added weight, g is the acceleration due to gravity (9.81 ms-1), r is the radius of the measurement arm, F is the force required to oppose gravity, and τ is torque. The torque due to the mass of the measurement arm was calculated as
| (2) |
where larm is the length of the measurement arm. In order to explore the relationship between magnet pull strength and torque, 0.1 mm spacers were used to position the connecting magnets at varying distances from each other using a set screw (fig. 7B & S1). Measurements were repeated 3 times per magnet gap (in random order) and averaged. Distance vs. pull strength data is available from the magnet manufacture (K & J Magnetics, Jamison, PA, USA).
2.7 Optogenetic Stimulation in Chronically Implanted Mice
2.7.1 Animal Usage
All animal experiments were approved by the Institutional Animal Care and Use Committee (IACUC) of Wake Forest University and in agreement with National Institutes of Health and United States Department of Agriculture guidelines, including practices to eliminate suffering and reduce animal numbers to the extent possible. Optogenetic stimulation and chronic extracellular recordings were performed in 6 awake and freely moving Thy1-ChR2-YFP (founder line 18) transgenic mice (Arenkiel et al., 2007; Wang et al., 2007) (Stock # 007612, The Jackson Laboratory, Bar Harbor, Maine, USA).
2.7.2 Surgery
Thy1 mice were anesthetized with isoflurane and placed in a stereotaxic device. Metal ground screws were secured to the cranium above cerebellum. Custom microwire arrays were built using 35 μm formvar insulated tungsten micro-wire (California Fine Wire Company, Grover Beach, CA, USA), a custom designed PCB interface, and nano strip connectors (Omnetics, Minneapolis, MN, USA). A total of 8 microwires were implanted in a satellite array in cortical, subcortical, and hippocampal locations (data not shown). A magnetic rotary fiber connector with an attached microwire (optrode) was placed in CA1 (AP: 0.88, L: 2.36, DV: -1.34, from the interaural plane). The optotrode was configured to minimize the photovoltaic effect by cutting the electrode at an angle so that the exposed metal surface was not directly illuminated by the implanted fiber (Cardin et al., 2010). Implanted electrodes and magnetic fiber connector were anchored to ground screws using rubberized cyanoacrylic and dental acrylic.
2.7.3 Light stimulation and recordings
Spikes and local field potentials (LFPs) were recorded using the SciWorks recording system (DataWave Technologies, Loveland, CO, USA), AM-3600 extracellular amplifiers (A-M Systems, Sequim, WA, USA), and T8G100 headstage amplifiers (TBSI, Durham, NC, USA). Spikes and wideband LFPs were acquired using a bandpass filter of 300 Hz - 20 kHz and 0.3 Hz – 20 kHz respectively. The light source was either a diode pumped solid state (DPSS) laser (Beijing Viasho Technology Co, Beijing, China), or a custom mounted LED (Philips Lumileds, Quebec, Canada). LED intensity was controlled using an LED driver with analog modulation (Mightex Systems, Pleasanton, CA, USA). Analog output pulses were generated within SciWorks and used to control the LED driver. Light pulses were continually monitored with a silicon photodiode placed behind a dichroic mirror (for the laser) or near the emitter (for the LED). An op-amp based current-to-voltage converter circuit was used to linearize the photodiode output and resulting signals were recorded along with the neural data. Two estimates of light intensity are provided, the radiant flux (mW) at the tip of the source fiber, as well as the light power density at the recording site (mW/mm2) estimated using the empirically derived model described in (Aravanis et al., 2007 and Yizhar et al., 2011). Recording sessions were video recorded and animal head orientation was manually scored. An infrared LED synchronized to the stimulus onset was placed in view of the video camera for precise temporal alignment between the video and the recordings. Data analysis was performed using SciWorks, NeuroExplorer (Nex Technologies, Madison, AL, USA), and custom software written in MATLAB (MathWorks, Natick, MA, USA). 95% confidence intervals were calculated using a corrected and accelerated bootstrap method in MATLAB (DiCiccio and Efron, 1996).
2.8 Supplies
-
Light Sources
DPSS Laser, 473 nm, 100 mW, Part # VA-II-N-473 (Beijing Viasho Technology Co, Beijing, China)
Light Emitting Diode (LED), Part # LXML-PB01-0030 (Philips Lumileds, Quebec, Canada)
LED Driver w/analog modulation, Part# SLA-1200-2 (Mightex Systems, Pleasanton, CA, USA)
-
Patch Cable
Multimode Optical Fiber, 200 μm core, 0.48 NA, Part# BFH48-200 (Thorlabs, Newton, NJ, USA)
Multimode Ceramic Zirconia Ferrule Assembly, 1.25 mm, 230 μm bore, Part# MM-FER2007CF-2300 (Precision Fiber Products, Milpitas, CA, USA)
Ring-shaped Neodymium Magnet, 1/8 in OD, 1/16 in ID, Part# R211 (K & J Magnetics, Jamison, PA, USA)
Stainless Steel Guide Wire, 0.017 in diameter, Part# GWX-0170-60-05 (Amazon Supply, USA)
SMA Multimode Fiber Connector, 231 um bore, Part# 10230A (Thorlabs, Newton, NJ, USA)
Heat Shrink Tubing, 3/32 in, Part# 70113110, (Allied Electronics, Fort Worth, Texas, USA)
-
Implant Assembly
Multimode Optical Fiber, 200 um core, 0.48 NA, Part# BFH48-200 (Thorlabs, Newton, NJ, USA)
Multimode Ceramic Zirconia Stick Ferrule, 1.25 mm, 230 um bore, Part# MM-FER2007C-2300 (Precision Fiber Products, Milpitas, CA, USA)
304 Stainless Steel Cannula, 17 Gauge Thin Wall, 0.058 in OD, 0.05 in ID, Part# B004WLMT9I (Amazon Supply, USA)
Ring-shaped Neodymium Magnet, 1/8 in OD, 1/16 in IN, Part# R211 (K & J Magnetics, Jamison, PA)
Pipette-Tip, 200 ul, Part# 02-707-504 (Fisher Scientific, Pittsburgh, PA, USA)
-
Caps and Extractor
Disc-shaped Neodymium Magnet (cap), 1/8 in OD, 1/32 in thick, Part# D201 (K & J Magnetics, Jamison, PA, USA)
Disc-shaped Neodymium Magnet (extractor), 1/8 in OD, 1/16 in thick, Part# D21 (K & J Magnetics, Jamison, PA, USA)
Cylinder-shaped Neodymium Magnet, 3/8 in OD, 1/2 in thick, Part# D68 (K & J Magnetics, Jamison, PA, USA)
Pipette-Tip, 5000 ul, Part# 82018-840 (VWR, Radnor, PA, USA)
-
Tools and Supplies
Dremel Rotary Tool with #409 cut-off wheels (Robert Bosch Tool Corporation, USA)
Black Glue (Rubber-Toughened Cyanoacrylate Adhesive), Part# IC-2000 (Bob Smith Industries, Atascadero, CA, USA)
Zip Kicker (Cyanoacrylate Accelerator), 8 oz, Part# PT29 (Zap Glue, Pacer Industrial Products, Rancho Cucamonga, CA, USA)
Feather Double-Edge Blade (for spacing the magnets, also great for use with a vibratome), Part# 121-9, (Ted Pella Inc, Redding, CA, USA)
Fiber Stripping Tool (Clad: 230 um, Coat: 400 um), Part# T12S16 (Thorlabs, Newton, NJ, USA)
Fiber Scribe, Part# S90R (Thorlabs, Newton, NJ, USA)
LC/PC Connector Polishing Disc, Part# D50-LC (Thorlabs, Newton, NJ, USA)
Epoxy for Fiber Optic Connectors, Part# F112 (Thorlabs, Newton, NJ, USA)
Glass Polishing Plate, Part# CTG913 (Thorlabs, Newton, NJ, USA)
Aluminum Oxide Lapping (Polishing) Sheets, 0.3, 1, 3, and 5 um Grits, Part# LFG03P, LFG1P, LFG3P, and LFG5P (Thorlabs, Newton, NJ, USA)
Guide to Connectorization and Polishing of Optical Fibers, Part# FN96A (Thorlabs, Newton, NJ, USA)
Light Meter, Part# PM100 with Integrating Sphere Photodiode, Part# S140A (Thorlabs, Newton, NJ, USA)
3 Results and Discussion
3.1 Overview
Our connectors are designed to meet a specific set of functional requirements. First, efficient fiber optic connections rely on the close and precise alignment of two ends of the mating fibers. In order to allow rotation while maintaining alignment, one half of the connector should cup the other in place and smooth, precisely-formed pieces are required to reduce friction. Second, connections need to be easily attached and detached by the experimenter, but not by the animal, to minimize stress due to excessive handling. Finally, the head-mounted connector must include a cap that is easily removed by the experimenter, but not by the animal, to protect the implanted fiber from damage.
We found that commercially available zirconia ferrules (with one ferrule flipped upside down) provide alignment during rotation with reduced friction compared to other materials. Neodymium magnets were ideal for providing a secure yet easy-to-use connection. Magnets also make effective caps when used with a small plastic cup to prevent the animal from removing them and a magnetic cap extractor permits rapid removal of the caps.
3.2 Transmission efficiencies and rotational variation
Our rotatable connector performs at least as well as expensive commercially available rotary joints, with average transmission efficiencies of 80% and rotational variation 4% (fig. 7C and table 1). By using pre-formed zirconia ferrules, the connector-to-connector variation was kept to a minimum (< 3% SD). Rotational variation could be reduced (at the expense of coupling efficiency) by introducing a small space between the coupled fibers during construction. As the fibers rotate, slight misalignments produce a sinusoidal curve in the transmission efficiency during rotation (fig. 7C). Spacing the fibers slightly helps to reduce this rotational variation because the light spreads out in a cone shape after exiting the source fiber and overfills the receiving fiber core, lessening the impact of misalignment. At a slightly larger fiber spacing that provides a 60% total coupling efficiency, the rotational variation drops to 2%. Too much overfill will result in excessive loss of light so it is important to keep misalignments to a minimum. Alternatively, when using a LED light source, rotational variation can be reduced by using a larger diameter fiber in the patch cable with a smaller fiber in the implant. Large to small diameter coupling produces significant loss at the connection but this is compensated by the fact that larger fibers couple more efficiently with LEDs. Conversely, when precisely focused lasers are used as a light source, smaller diameter (or lower NA) fibers can be used in the source cable with larger diameter (or higher NA) fibers in the implant to both decrease rotational variability and increase transmission efficiency.
3.3 Torque vs. pull strength
We found that the rotational torque increases with the pull strength of the magnets as a result of increased friction between the zirconia ferrules. Magnets are available in a variety of pull strengths allowing for connector customization for species-specific applications. The pull strength of a particular magnet could be further customized by using spacers to separate the magnets during construction (fig. 3 E-J). We found used (and cleaned) vibratome blades at a thickness of 0.1 mm to be ideal, but stainless steel sheeting would work equally well. Another method for reducing pull strength was to de-magnetize one of the magnets by heating it above the Curie temperature, 310 °C (fig. 7B, asymmetric configuration). Temperature controlled ovens or heat-guns worked well for this purpose. Rotational torques given a particular configuration and spacing were estimated using a jig with an adjustable magnet gap. The rotational torque of our connector could be configured to be as low as 4.74 ± 0.71 μN*m (mean ± SEM, n = 3 repeated measurements, asymmetric configuration with 1.046 mm spacing, 9 g pull strength). Commercial systems have reported rotational torques of 7 μN*m (Doric Lenses) and <10 mN*m (Thor Labs). Larger gaps between the magnets can reduce the stability of the connector so we recommend spacing in the range of 0.1 - 0.5 mm (torques of 183.4 ± 38.8 to 57.2 ± 7.9 μN*m for the symmetric magnet configuration and 63.5 ± 6.8 to 13.9 ± 3.1 μN*m for the asymmetric configuration). Mice required lower pull strengths due to their low body mass and therefore low torque connectors can be used. In our experience, torques of up to 150 μN*m are well tolerated in mice. For rats and larger animals, higher torques (>300 μN*m) were tolerated allowing for the higher pull strengths required to maintain secure connections in these animals.
3.4 Weight and Cost
Our connectors are lightweight (0.195 ± 0.008 g) making them ideal for use in small animals, such as mice. Using the current 2013 pricing for the supplies listed in the methods section, we estimate that the implanted fiber assembly costs $6 per implant. A patch cable with a commercially available SMA connector costs $20. This is significantly less than currently available systems ($300-$600).
3.5 Light Dose Response Curves
Although we have defined rotational variability in terms of light output, to our knowledge, no direct measure of the effect of rotational variability on the photo-evoked response has been performed in vivo. First we generated a light dose response curve in a chronically implanted Thy1-ChR2 mouse (fig. 9A) in order define the photo-evoked LFP as a function of light intensity. Using least-squares regression we modelled the relationship between light intensity at the tip of the source fiber to the amplitude of the first peak of the photo-evoked LFP.
| (3) |
Where the constants of best fit are: a = -6874, b = -0.2959, c = 11070, and r2 = 0.9967. Based upon this relationship we estimated that, at an intensity of 2.65 mW, a rotational variability of 4.5% would produce a corresponding change of 1.5% in the photo-evoked LFP. Next, we tested this prediction empirically by delivering light pulses at this intensity while recording photo-evoked LFPs in a freely moving mouse. Head position was then manually scored using time locked video. We found that the average first peak of the photo-evoked LFP varied a maximum of 1.1% with changing head position, in general agreement with the model. It is worth noting that the % variability of the photo-evoked LFP, given a particular rotational variability, changes with the amount of light delivered. The photo-evoked response exhibits a greater dependence on intensity at very low light levels than at higher ones as illustrated by the shape of the fitted curve. This behavior is likely a function of the kinetics of ChR2 as well as the biophysical properties of the expressing cells (Ishizuka et al., 2006; Mattis et al., 2012).
The relationship between light output and the photo-evoked LFP is also expected to depend on variables related to the optogenetic technique (such as the amount and spatial distribution of expression, and placement of the fiber), as well as those related to the LFP (such the geometrical arrangement of the stimulated cells and placement of the recording electrode). The curve that fits these parameters must be experimentally determined for each particular case.
Another important consideration in optimizing optogenetic set-ups is the variability associated with the light source. In general, LEDs produce much more consistent light pulses than lasers (especially inexpensive ones). Unfortunately LEDs are also more difficult to couple efficiently with fiber optics (Hudson, 1974). By eliminating additional connections between the light source and implanted fiber, our rotatable connector allows cheaper and more reliable LED light sources to be used in the place of lasers for many applications.
3.6 Durability and Convenience
Our connectors have been extensively tested in both mice and rats. The stainless steel support wires prevented twisting and coiling of the supply fiber, which maintained fiber integrity by isolating the supply fiber from rotational forces. The fiber tips were protected within the zirconia ferrules, which prevented tip damage. The cap over the implanted cannula protected the implanted fiber from dust and dander in the animal's home cage. The plastic cup not only held the magnetic dust cap in place, but when surrounded by an opaque adhesive (e.g. black glue), it prevented the escape of stray light. The magnetic cap and connector system allows the researcher to remove the cap and plug in the patch cable without fully restraining the animal or exerting excessive force. The cable can be disconnected and the cap replaced just as easily, saving time and reducing stress to the animal. The magnetic connection and tapered tip ensures that the connector is seated properly each time the patch cable is plugged in, which reduces variability and allows for consistent within animal comparisons.
3.7 Construction
Our connectors are constructed from readily available and inexpensive components, which lower the per-animal cost for optogenetics experiments. The design can be easily customized to fit the specific needs of the researcher. Labs that already make their own zirconia fiber implants should be well equipped to produce these devices with a minimum of additional supplies. The design is simple and easy to construct, and the use of standard zirconia ferrules and template based construction allows for a high degree of consistency from implant to implant (i.e., the source fiber or a purpose built template can be used to make an implant, which can serve as a template for additional source fibers). Multiple source fibers could be constructed in this way with nearly the exact same configuration so that animals could be run on multiple stimulation rigs interchangeably, facilitating high throughput experimentation.
3.8 Alternative Solutions
The most popular method for solving the problem of fiber twisting in experimental animals is the rotary joint. Rotary joints provide for smooth, low torque connections, with relatively high coupling efficiency. The most significant drawbacks to using rotary joints are cost and the fact that they introduce an additional break point in the fiber. The combined loss of light at the joint and the head-mounted connector can be sufficient to preclude the use of an LED with a small diameter fiber and require the use of a laser light source. High quality lasers are very expensive and inexpensive ones tend to exhibit unacceptable variability, especially when pulsed. LEDs are inexpensive and allow for extremely reliable pulsing. By combining the rotary joint and the head mounted connector, our device reduces overall loss and allows for a full range of stimulation intensities with an LED (figure 7). Another potential solution is to allow the fiber coupled LED to rotate using an electrical commutator or slip ring. Such a system eliminates the need for an optical rotary joint but depending on the moment of inertia of the LED and heat sink, and the torque of the commutator, such devices may require motorized drive mechanisms which increase cost significantly (e.g. PlexBright Commutator, Plexon Inc., Dallas, Texas, USA).
In addition to tethered set ups, new implantable LEDs and wireless systems are currently being developed (Ameli et al., 2013; Kim et al., 2013; McCall et al., 2013; Stark et al., 2012; Wentz et al., 2011). These devices are perhaps the ideal solution to the problems of optogenetic experiments in awake behaving animals; however they are not widely available and are likely to be very expensive when they do become available. Our device, when combined with inexpensive LEDs, will enable large scale optogenetic experiments in labs that would not otherwise possess the resources to perform them.
3.9 Concluding Remarks
We have devised a unique connector design that allows for high efficiency coupling and free-rotation in a single compact magnetic connector that can be easily incorporated into existing optogenetic set ups.
Supplementary Material
Fig. 8.
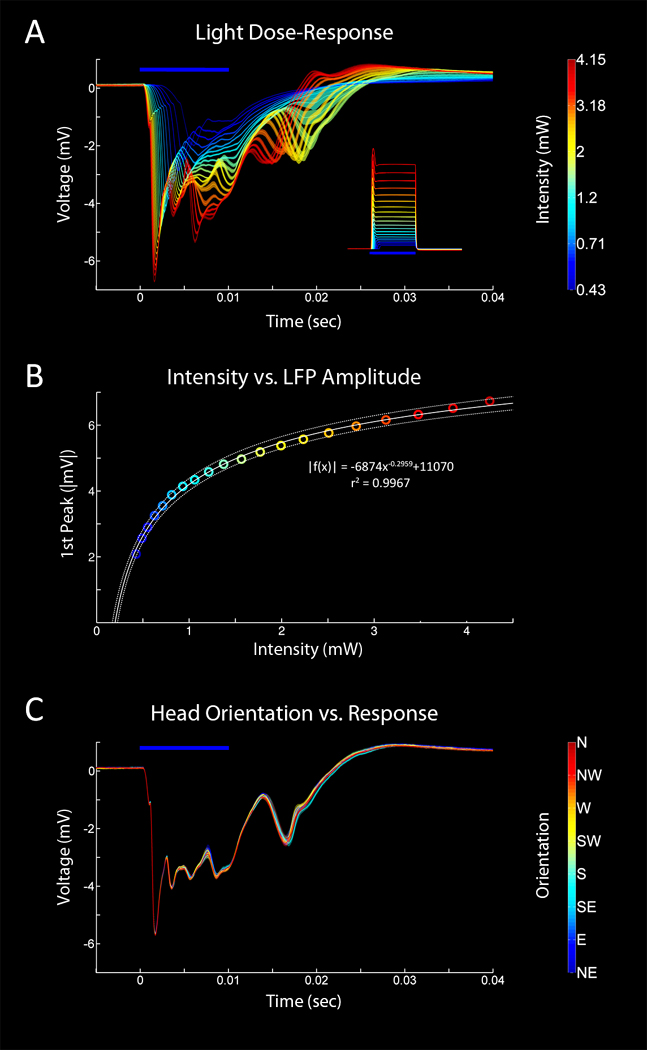
Light Dose Response (LFP) Curves In Vivo. A. Representative evoked LFP responses in a chronically implanted, awake behaving mouse. A range of 20 intensities (0.43–4.15 mW at the supply fiber tip, 0.13–1.27 mW/mm2 at the recording site) was used and the presentation order was randomized. 60 repetitions * 20 intensities = 1200 stimuli. 10 ms pulses, 3 sec interval between each pulse. Inset shows the average pulse waveforms of the stimulus measured with a silicon photodiode and an op-amp based current-to-voltage converter. B. Plot of light intensity vs. response amplitude of the first peak of the photo-evoked LFP. A curve was fit to the data using least squares regression and the best fit equation is displayed. Dotted lines represent the 95% confidence intervals of the fit. C. Manually scored head orientation vs. response. A single intensity (2.65 mW, 0.78 mW/mm2) was presented 643 times (10 ms pulse, 5 s int). Video recording was used to assign a head orientation to each pulse. 42 instances of each orientation were randomly selected from the larger data set and averaged. The coupling efficiency of the connector used in this animal was 81.50 ± 4.49%. 95% bootstrapped confidence intervals are displayed.
Highlights.
We have developed a rotatable fiber optic connector for optogenetic experiments in vivo.
Benchmark tests demonstrate superior performance to currently available solutions.
Our connectors are built from inexpensive materials and are easily constructed.
Experiments were performed in freely moving mice to evaluate the functional impact of rotational variability.
Acknowledgments
Special thanks to Caroline Bass, Evgeny Budygin, Stephen Susalka, Jennifer Stapleton, and Melissa Masicampo for help with experiments and helpful comments on the manuscript.
Aspects of these devices are covered under US patent application no. 13/185,933
Funding: EY018159-02, EY018159-02S1, AA016852 and AA016852-02S1 to DWG.
Footnotes
Publisher's Disclaimer: This is a PDF file of an unedited manuscript that has been accepted for publication. As a service to our customers we are providing this early version of the manuscript. The manuscript will undergo copyediting, typesetting, and review of the resulting proof before it is published in its final citable form. Please note that during the production process errors may be discovered which could affect the content, and all legal disclaimers that apply to the journal pertain.
References
- Ameli R, Mirbozorgi A, Neron JL, Lechasseur Y, Gosselin B. A wireless and batteryless neural headstage with optical stimulation and electrophysiological recording. Conf Proc Annu Int Conf IEEE Eng Med Biol Soc IEEE Eng Med Biol Soc Conf. 2013;2013:5662–5665. doi: 10.1109/EMBC.2013.6610835. [DOI] [PubMed] [Google Scholar]
- Aravanis AM, Wang LP, Zhang F, Meltzer LA, Mogri MZ, Schneider MB, Deisseroth K. An optical neural interface in vivo control of rodent motor cortex with integrated fiberoptic and optogenetic technology. J Neural Eng. 2007;4:S143–S156. doi: 10.1088/1741-2560/4/3/S02. [DOI] [PubMed] [Google Scholar]
- Arenkiel BR, Peca J, Davison IG, Feliciano C, Deisseroth K, Augustine GJ, Ehlers MD, Feng G. In vivo light-induced activation of neural circuitry in transgenic mice expressing channelrhodopsin-2. Neuron. 2007;54:205–218. doi: 10.1016/j.neuron.2007.03.005. [DOI] [PMC free article] [PubMed] [Google Scholar]
- Bass CE, Grinevich VP, Vance ZB, Sullivan RP, Bonin KD, Budygin EA. Optogenetic control of striatal dopamine release in rats. J Neurochem. 2010;114:1344–1352. doi: 10.1111/j.1471-4159.2010.06850.x. [DOI] [PMC free article] [PubMed] [Google Scholar]
- Boyden ES, Zhang F, Bamberg E, Nagel G, Deisseroth K. Millisecond-timescale genetically targeted optical control of neural activity. Nat Neurosci. 2005;8:1263–1268. doi: 10.1038/nn1525. [DOI] [PubMed] [Google Scholar]
- Cardin JA, Carlén M, Meletis K, Knoblich U, Zhang F, Deisseroth K, Tsai LH, Moore CI. Targeted optogenetic stimulation and recording of neurons in vivo using cell-type-specific expression of Channelrhodopsin-2. Nat Protoc. 2010;5:247–254. doi: 10.1038/nprot.2009.228. [DOI] [PMC free article] [PubMed] [Google Scholar]
- DiCiccio TJ, Efron B. Bootstrap confidence intervals. Stat Sci. 1996;11:189–228. [Google Scholar]
- Han X, Boyden ES. Multiple-color optical activation, silencing, and desynchronization of neural activity, with single-spike temporal resolution. PLoS ONE. 2007;2:e299. doi: 10.1371/journal.pone.0000299. [DOI] [PMC free article] [PubMed] [Google Scholar]
- Huber D, Petreanu L, Ghitani N, Ranade S, Hromadka T, Mainen Z, Svoboda K. Sparse optical microstimulation in barrel cortex drives learned behaviour in freely moving mice. Nature. 2008;451:61–64. doi: 10.1038/nature06445. [DOI] [PMC free article] [PubMed] [Google Scholar]
- Hudson MC. Calculation of the Maximum Optical Coupling Efficiency into Multimode Optical Waveguides. Appl Opt. 1974;13:1029–1033. doi: 10.1364/AO.13.001029. [DOI] [PubMed] [Google Scholar]
- Ishizuka T, Kakuda M, Araki R, Yawo H. Kinetic evaluation of photosensitivity in genetically engineered neurons expressing green algae light-gated channels. Neurosci Res. 2006;54:85–94. doi: 10.1016/j.neures.2005.10.009. [DOI] [PubMed] [Google Scholar]
- Kim T, McCall JG, Jung YH, Huang X, Siuda ER, Li Y, Song J, Song YM, Pao HA, Kim RH, et al. Injectable, Cellular-Scale Optoelectronics with Applications for Wireless Optogenetics. Science. 2013;340:211–216. doi: 10.1126/science.1232437. [DOI] [PMC free article] [PubMed] [Google Scholar]
- Mattis J, Tye KM, Ferenczi EA, Ramakrishnan C, O'Shea DJ, Prakash R, Gunaydin LA, Hyun M, Fenno LE, Gradinaru V, et al. Principles for applying optogenetic tools derived from direct comparative analysis of microbial opsins. Nat Methods. 2012;9:159–172. doi: 10.1038/nmeth.1808. [DOI] [PMC free article] [PubMed] [Google Scholar]
- McCall JG, Kim TI, Shin G, Huang X, Jung YH, Al-Hasani R, Omenetto FG, Bruchas MR, Rogers JA. Fabrication and application of flexible, multimodal light-emitting devices for wireless optogenetics. Nat Protoc. 2013;8:2413–2428. doi: 10.1038/nprot.2013.158. [DOI] [PMC free article] [PubMed] [Google Scholar]
- Ramirez S, Liu X, Lin PA, Suh J, Pignatelli M, Redondo RL, Ryan TJ, Tonegawa S. Creating a False Memory in the Hippocampus. Science. 2013;341:387–391. doi: 10.1126/science.1239073. [DOI] [PubMed] [Google Scholar]
- Sparta DR, Stamatakis AM, Phillips JL, Hovelsø N, Zessen R van, Stuber GD. Construction of implantable optical fibers for long-term optogenetic manipulation of neural circuits. Nat Protoc. 2012;7:12–23. doi: 10.1038/nprot.2011.413. [DOI] [PMC free article] [PubMed] [Google Scholar]
- Stark E, Koos T, Buzsáki G. Diode probes for spatiotemporal optical control of multiple neurons in freely moving animals. J Neurophysiol. 2012;108:349–363. doi: 10.1152/jn.00153.2012. [DOI] [PMC free article] [PubMed] [Google Scholar]
- Tsai HC, Zhang F, Adamantidis A, Stuber GD, Bonci A, de Lecea L, Deisseroth K. Phasic firing in dopaminergic neurons is sufficient for behavioral conditioning. Science. 2009;324:1080–1084. doi: 10.1126/science.1168878. [DOI] [PMC free article] [PubMed] [Google Scholar]
- Ung K, Arenkiel BR. Fiber-optic Implantation for Chronic Optogenetic Stimulation of Brain Tissue. J Vis Exp. 2012 doi: 10.3791/50004. [DOI] [PMC free article] [PubMed] [Google Scholar]
- Wang H, Peca J, Matsuzaki M, Matsuzaki K, Noguchi J, Qiu L, Wang D, Zhang F, Boyden E, Deisseroth K, et al. High-speed mapping of synaptic connectivity using photostimulation in Channelrhodopsin-2 transgenic mice. ProcNatl AcadSciUSA. 2007;104:8143–8148. doi: 10.1073/pnas.0700384104. [DOI] [PMC free article] [PubMed] [Google Scholar]
- Wentz CT, Bernstein JG, Monahan P, Guerra A, Rodriguez A, Boyden ES. A wirelessly powered and controlled device for optical neural control of freely-behaving animals. J Neural Eng. 2011;8:046021. doi: 10.1088/1741-2560/8/4/046021. [DOI] [PMC free article] [PubMed] [Google Scholar]
- Yizhar O, Fenno LE, Davidson TJ, Mogri M, Deisseroth K. Optogenetics in neural systems. Neuron. 2011;71:9–34. doi: 10.1016/j.neuron.2011.06.004. [DOI] [PubMed] [Google Scholar]
- Van Zessen R, Phillips JL, Budygin EA, Stuber GD. Activation of VTA GABA neurons disrupts reward consumption. Neuron. 2012;73:1184–1194. doi: 10.1016/j.neuron.2012.02.016. [DOI] [PMC free article] [PubMed] [Google Scholar]
- Zhang F, Wang LP, Brauner M, Liewald JF, Kay K, Watzke N, Wood PG, Bamberg E, Nagel G, Gottschalk A, et al. Multimodal fast optical interrogation of neural circuitry. Nature. 2007;446:633–639. doi: 10.1038/nature05744. [DOI] [PubMed] [Google Scholar]
Associated Data
This section collects any data citations, data availability statements, or supplementary materials included in this article.