

One of the major abiotic stresses affecting agriculture is soil salinity, which reduces crop yield. A way of improving yield in conditions of salinity stress is to breed for improved salt tolerance. In this study, we analysed physiological and genetic parameters of 23 tomato accessions in order to identify possible traits to be used by plant breeders to develop more tolerant tomato varieties. Our results suggest that, in tomato, for a particular level of tolerance to salinity, a complex relationship between Na+ concentration in the cells and tissue tolerance defines the salinity tolerance of individual tomato accessions.
Keywords: Genetic and physiological parameters, salinity stress, tomato accessions.
Abstract
One of the major abiotic stresses affecting agriculture is soil salinity, which reduces crop yield and, consequently, revenue for farmers. Although tomato is an important agricultural species, elite varieties are poor at withstanding salinity stress. Thus, a feasible way of improving yield under conditions of salinity stress is to breed for improved salt tolerance. In this study, we analysed the physiological and genetic parameters of 23 tomato accessions in order to identify possible traits to be used by plant breeders to develop more tolerant tomato varieties. Although we observed a wide range of Na+ concentrations within the leaves, stems and roots, the maintenance of growth in the presence of 100 mM NaCl did not correlate with the exclusion or accumulation of Na+. Nor could we correlate the growth with accumulation of sugars and proline or with the expression of any gene involved in the homoeostasis of Na+ in the plant. However, several significant correlations between gene expression and Na+ accumulation were observed. For instance, Na+ concentrations both in the leaves and stems were positively correlated with HKT1;2 expression in the roots, and Na+ concentration measured in the roots was positively correlated with HKT1;1 expression also in the roots. Higher and lower Na+ accumulation in the roots and leaves were significantly correlated with higher NHX3 and NHX1 expression in the roots, respectively. These results suggest that, in tomato, for a particular level of tolerance to salinity, a complex relationship between Na+ concentration in the cells and tissue tolerance defines the salinity tolerance of individual tomato accessions. In tomato it is likely that tissue and salinity tolerance work independently, making tolerance to salinity depend on their relative effects rather than on one of these mechanisms alone.
Introduction
One of the major abiotic stresses that agriculture faces is salinity (Munns and Tester 2008; Food and Agriculture Organization (FAO) 2009). An excessive amount of salt in the soil negatively affects plant germination, growth, development and productivity (Manaa et al. 2011). A very important mechanism of salinity tolerance is the ability to minimize the amount of Na+ entering the plant via the roots (Laurie et al. 2002; Tester and Davenport 2003; Munns and Tester 2008). The control of Na+ transport at the cellular level by secreting and sequestering it in tissues, cells or organelles, where Na+ causes less harm, is also critical to the achievement of salinity tolerance (Munns and James 2003; Parida and Das 2005). In fact, a great contributor to salinity stress is the accumulation of high concentrations of Na+ in the leaf cell cytoplasm (Jha et al. 2010).
In some species, however, Cl− is the main stressful ion (Prior et al. 2007). This does not mean that Cl− has a higher metabolic toxicity than Na+, but that these species are better at excluding Na+ than Cl− (Munns and Tester 2008). Interestingly, several studies show that, besides Na+ exclusion, tissue tolerance to high Na+ concentrations also plays an important role in salinity tolerance (El-Hendawy et al. 2004; Genc et al. 2007; Jha et al. 2010). For instance, it was shown that in wheat and Arabidopsis no clear relationship between Na+ exclusion and salinity tolerance exists (Rus et al. 2006; Genc et al. 2010; Jha et al. 2010). In fact, two Arabidopsis thaliana ecotypes—Tsu1 and Ts—accumulated more Na+ in the shoots than several other Arabidopsis ecotypes studied (Rus et al. 2006). Nevertheless, the Tsu1 and Ts ecotypes were more salt tolerant than those accumulating less Na+ in the shoots. The understanding of the mechanisms involved in the uptake and movement of Na+ throughout the plant as well as the genes involved in Na+ homoeostasis in planta is crucial (Jha et al. 2010) in the improvement of the salinity tolerance of current crop varieties.
Several genes have been shown to play a role in the control of Na+ movement throughout the plant. For example, HKT (Berthomieu et al. 2003; Ren et al. 2005; Davenport et al. 2007; Moller et al. 2009; Jha et al. 2010; Ali et al. 2012), SOS (Qiu et al. 2002; Shi et al. 2002), NHX (Gaxiola et al. 1999), AVP (Gaxiola et al. 2001; Zhao et al. 2006) and AHA (Apse et al. 1999) gene families encompass such genes. Studies carried out with Arabidopsis (Uozumi et al. 2000; Berthomieu et al. 2003; Davenport et al. 2007; Moller et al. 2009), rice (Ren et al. 2005; Jabnoune et al. 2009; Yao et al. 2010), Eucalyptus (Fairbairn et al. 2000), barley (Mian et al. 2011) and Thellungiella (Ali et al. 2012) show that HKT genes are involved in the control of the Na+ movement throughout the plant. The HKT gene family encodes proteins that are responsible for the influx of Na+ into cells (Uozumi et al. 2000; Moller et al. 2009). This family is divided into two subfamilies depending on the nucleic acid sequences and protein structure of their members (Platten et al. 2006). Members of Subfamily 1 have an important role in salinity tolerance (Uozumi et al. 2000; Ren et al. 2005). Athkt1;1 mutants and the Arabidopsis ecotypes Tsu1 and Ts1 (Rus et al. 2006) have no AtHKT1;1 expression in the roots. This is related with hyperaccumulation of Na+ in the shoots and reduced accumulation in the roots (Rus et al. 2006). Cell-type specific over-expression of AtHKT1;1 in the root stele of Arabidopsis plants (Moller et al. 2009), and in the root cortex of rice plants (Plett et al. 2010), results in a significant decrease of Na+ accumulation in the shoots and in the increase of tolerance to salinity in these plants.
The plasma membrane Na+/H+ antiporters SOS1 family encompasses members that have been implicated in reducing the quantity of Na+ translocated to the shoots via the transpiration stream (Qiu et al. 2002; Shi et al. 2002). AtSOS1 is expressed in the epidermal cells of the root tissue (Shabala and Cuin 2008), where it pumps Na+ into the external medium, and it is expressed in cells along the vascular tissue (Shi et al. 2000), where it pumps Na+ into the transpiration stream (Shi et al. 2000, 2002). Shi et al. (2003) show that over-expression of AtSOS1 in Arabidopsis improves its salt tolerance through the limitation of Na+ accumulation in plant cells.
Another ion transport protein, with a very important role in salinity tolerance, is the vacuolar Na+, K+/H+ antiporter AtNHX1 (Venema et al. 2003). This transporter is responsible for the detoxification of the cytoplasm by pumping Na+ into the vacuole (Gaxiola et al. 1999). Several studies show that over-expression of AtNHX or its homologues from other species improves the salt tolerance of plants (Apse et al. 1999; Zhang and Blumwald 2001; Xue et al. 2004; He et al. 2005; Chen et al. 2007). Many transport processes that occur in plants are directly or indirectly energized by the proton gradient across membranes produced by H+-pumping ATPases (Maathuis et al. 2003). At the plasma membrane, the AHA gene family encodes P-type ATPases that create an H+ gradient used to energize, among other processes, the extrusion of Na+ (Apse et al. 1999) via SOS1. High AHA expression levels are always observed in cells where intense active transport takes place (Palmgren and Harper 1999; Palmgren and Nissen 2011). One of the causes for intense active transport is the excess of Na+ ions entering the root. AtAVP1 encodes a vacuolar H+-translocating pyrophosphatase (H+-PPase) that transports H+ across the tonoplast (Munns and James 2003). This gradient results in the energization of the movement of Na+ into the vacuoles through Na+, K+/H+ antiporters like AtNHX1 (Gaxiola et al. 2001). When AtAVP1 is over-expressed in Arabidopsis, an increase in salinity tolerance has been observed caused by a better sequestration of Na+ in the vacuole (Gaxiola et al. 2001).
In plants suffering from salinity stress, the production of compatible solutes has also shown to be an effective mechanism to protect plants. Both amino acids and sugars are non-toxic compounds that accumulate preferentially in the cytoplasm, helping not only to maintain the turgor and osmotic balance but also to protect the cell structure (Conde et al. 2011). Salinity stress causes the accumulation of proline in several plant species including tomato (Fujita et al. 1998). Proline functions both as an osmolyte and as an osmoprotectant (Conde et al. 2011). It can be synthesized via two different pathways from either glutamate or ornithine (Hmida-Sayari et al. 2005); however, the glutamate pathway seems to be the predominant pathway in conditions of osmotic stress (Silva-Ortega et al. 2008). The first two steps of proline biosynthesis from glutamate are catalysed by the enzyme Δ1-pyrroline-5-carboxylate synthetase (P5CS) (Hu et al. 1992). The P5CS gene was isolated in several species, such as rice (Yoshiba et al. 1995), Arabidopsis (Igarashi et al. 1997) and tomato (Fujita et al. 1998). Its induction and the accumulation of proline correlated in rice and Arabidopsis (Yoshiba et al. 1995; Igarashi et al. 1997). Several studies showed that salt-tolerant plants had higher accumulation of proline in response to salinity treatments than salt-sensitive ones (Jain et al. 1991; Kirti et al. 1991). However, some studies showed the opposite. Working with tomato, Aziz et al. (1998) reported a negative correlation between salt tolerance and proline accumulation. Similar results were reported by Tal et al. (1979).
Salinity stress also causes the accumulation of sucrose (Juan et al. 2005). Sucrose is not toxic in the cytoplasm where it allows the maintenance of turgor and protects the structure of molecules against the deleterious effects of water scarcity (Popp and Smirnoff 1995; Murakeozy et al. 2003; Juan et al. 2005).
Tomato is one of the most important horticultural crops (Villalta et al. 2008). Unfortunately, elite varieties can withstand salinity stress poorly. This is a result of the usual breeding strategies, which have as target yield increments under optimal conditions (Villalta et al. 2008). Because of this, only 10 % of all genetic variability among all tomato species is present in elite tomato varieties (Miller and Tanksley 1990). The enormous genetic variation present in wild tomato species can be very important in the development of new salinity-tolerant cultivars. The introduction of genes from wild species of tomato can be achieved by crossing S. lycopersicum with other Solanum species of the S. lycopersicum complex: Solanum pimpinellifolium, S. neorickii, S. chmielewskii and S. pennellii. Tolerance means adaptation and wild Solanum species are adapted to marginal environments. For this reason, modern breeding programmes can take advantage of adaptations present in wild Solanum species (Villalta et al. 2008). These adaptations in tomato are studied independently in a number of other papers (Tal et al. 1979; Bolarin et al. 1995; Aziz et al. 1998; Fujita et al. 1998; Juan et al. 2005; Villalta et al. 2008; Galvez et al. 2012; Huertas et al. 2012); however, to our knowledge our study is the first to investigate a high number of salt-tolerance-associated traits in one single experiment.
The present study tried to define these adaptations to salt tolerance in 23 tomato accessions. We evaluated the role of Na+, K+, Cl−, proline and sucrose concentrations in determining salinity tolerance, and correlated these traits with the expression of genes involved in Na+ homoeostasis.
Methods
Plant material
Seeds of 23 different tomato accessions: Solanum chilense LA 1938 and LA 1959; S. chmielewskii LA 1325 and LA 2695; S. corneliomuelleri GI 568 and PI 126443; S. galapagense LA 0532 and LA 0317; S. habrochaites G1560 and LA 2167; S. habrochaites glabratum LA 2860 and PI 126449; S. lycopersicum Abigail F1, LA 3320, LA 2711 and Arbasson F1; S. neorickii LA 2194; S. pennellii LA 1340 and LA 1522; S. pennellii puberulum LA 1302; S. peruvianum LA 2548; and S. pimpinellifolium OT 2209 and LA 1245 were surface sterilized by soaking in 1 % (V/V) commercial sodium hypochlorite solution for 15 min and rinsing with sterile water three times. After sterilization, seeds were sown in rock wool plugs soaked with half-strength Hoagland's solution (one seed per rock wool plug). Plugs were covered with dry vermiculite to avoid dehydration. We used a randomized design consisting of two NaCl treatments with three biological replicas for each of the 23 accessions. Each biological replica consisted of a pool of 7–10 plants. On alternate days, plants were irrigated with half-strength Hoagland's solution. Plants were kept in a climate chamber under a 14/10 hours photoperiod and a 20/18 °C day/night temperature. Salt treatment started 2 weeks after sowing. Salt-treated plants were irrigated with half-strength Hoagland's solution supplemented with 50 mM NaCl, the excess solution was allowed to drain. Two days later, salt-treated plants were irrigated with half-strength Hoagland's solution supplemented with 100 mM NaCl. Control plants were irrigated with half-strength Hoagland's solution only. Plants were irrigated every 2 days over 3 weeks. Plants were harvested after 3 weeks of treatment. Root, stem and leaf tissue of each biological replica of each accession was harvested in tubes, snap-frozen in liquid nitrogen and transferred to an ultra-freezer, where they were stored at −80 °C. Before snap-freezing root samples were rinsed with demineralized water to remove Na+ from the medium present on the roots. Frozen samples were dried using a freeze dryer (Christ Alpha 1-4 LD plus, Germany) for 1 week. When completely dry, samples were ground into a fine powder and stored in closed tubes at room temperature.
Na+, K+ and Cl− measurements
For the quantification of Na+ and K+, between 50 and 100 mg of dried material was weighed in 2 mL tubes. One millilitre of ultrapure water (Fluka Analytical, Sigma-Aldrich, USA) was added and the tubes were boiled for 10 min at 100 °C. Samples were then filtered in a 96-wells filter plate (Thermo Scientific, Rochester, NY, USA) through centrifugation at 3000 rpm for 3 min. For Na+ and K+ measurements, 6 µL of the filtrate was diluted in 6 mL of ultrapure water (Fluka Analytical, Sigma-Aldrich), and the resulting solution was analysed for Na+ and K+ concentrations using an atomic absorption spectrometer (AAnalyst 200; PerkinElmer AAS). The AAS was calibrated using sodium and potassium atomic spectroscopy standard concentrate (Fluka Analytic, Sigma-Aldrich), and the average of three technical replicas was used for the ion concentration calculations. Cl− ions were measured directly on the filtered samples, also used for Na+ and K+ measurements, on a chloride counter (MKII Chloride Analyzer 926; Sheerwood, UK). The chloride counter was calibrated with 500 μL of Chloride Meter Standard (Sheerwood).
Sucrose and proline measurements
Ten milligrams of dried leaf material was weighed and inserted in 2 mL tubes. One millilitre of 80 % ethanol was added to each sample and the tubes were incubated for 90 min at 70 °C in a water bath. Samples were regularly vortexed to assure an efficient ethanol extraction of the sugars. After incubation, samples were centrifuged at full speed (14 000 RPM) for 10 min at room temperature. About 800 μL of the supernatant was transferred into a new 2 mL tube and 800 μL of Milli-Q water was added. Ten microlitres of this solution was used with the Sucrose/D-Glucose/D-Fructose-UV test Kit (R-Biopharm, Germany) to quantify sugars according to the manufacturer's protocol. For the calibration, 250 mg of glucose, sucrose and fructose were dissolved in a 250 mL volumetric flask containing 40 % ethanol. A dilution series was made (0, 2, 4, 8, 16 times dilution) and used for the standard curve. For the quantification of proline, between 20 and 30 mg dry leaf material from control and salt-treated plants were used. Extraction and quantification were made according to the method of Bates et al. (1973).
RNA extraction, complementary DNA synthesis and quantitative PCR
For the extraction of RNA, 30 mg of frozen material (root and leaf) was used. A NucleoSpin 96 RNA Kit (Macherey-Nagel) was used and RNA was extracted according to the manufacturer's protocol. After extraction, 5 μL of RNA was incubated at 37 °C for 10 min and tested in an agarose gel to check for the quality. The concentration was measured using a NanoDrop (ThermoScientific). First-strand cDNA was synthesized using 1 μg of total RNA, 200 Units of SuperScript II Reverse Transcriptase (Invitrogen Life Technologies), 1 mM dNTPs, 100 mM DTT, 5× first-strand buffer and 10 μM oligo dT primer, at 37 °C for 50 min. cDNA was used as a template for quantitative real-time PCR (qRT–PCR). Expression values were calculated according to the method of Livak and Schmittgen (2001) with SlElfα as an internal reference. Efficiencies between 95 and 105 % were regarded as acceptable. Amplification efficiencies were checked to ensure they were within the same range as the target genes. Cycle thresholds (Ct) values were determined in the automatic mode. Only slope values with an R2 > 0.990 were taken into account. The specificities of all primers were checked by running a melting curve. Primers used in this experiment can be seen in Supporting Information.
Statistical analysis
To assess the effect of salt treatment on Na+, K+, Na+/K+ and Cl− levels per accession, we used the Student's t-test. If the values were not normally distributed or if the assumption of homogeneity of variance was violated, we transformed the data. Gene expression data were transformed either logarithmically or ranked transformed. We performed Pearson's correlations between the different accessions or in the case of rank transformed data, we performed Spearman's rank correlations. All analyses were conducted using SPSS 17.0.
Results
Plant tolerance index and Na+, proline and sucrose concentrations
Almost all salt-stressed plants showed a significant reduction in shoot fresh weight (FW) over the 2-week period of salt treatment [see Supporting Information]. Accessions GI 568, LA 1325, PI 126443, LA 1245, Abigail, LA 1340 and LA 1522 showed no significant reduction in shoot FW when treated with NaCl. With the exception of Abigail F1, accessions without a significant reduction in shoot FW showed the highest scores according to the plant tolerance index (PTI) (see Jha et al. 2010) [see Supporting Information]. In this study, we defined PTI as the ratio between the FW of salt-treated shoots divided by FW of control shoots. We did not use total plant FW, because it was not possible to harvest the total amount of roots produced by each individual plant. Based on the PTI, the most salt-sensitive accession was LA 1938 (PTI = 0.37) and the most salt-tolerant accessions was LA 1245 (PTI = 0.98).
Variation could also be observed in the concentrations of Na+, K+ and Cl− and the Na+/K+ ratio measured in the three tissues analysed of all accessions [see Supporting Information]. All accessions showed significant increases in Na+ and Cl− concentrations and Na+/K+ ratios, in all tissues, when treated with 100 mM NaCl. Interestingly, these results showed no correlation with the PTI values (Fig. 1). In salt-treated plants, not all accessions showed a significant reduction in K+ concentrations.
Figure 1.

Relationship between PTI and Na+ accumulation in the (A) leaves, (B) stems and (C) roots of tomato plants treated with 100 mM NaCl for 2 weeks before being harvested. Black symbols represent the five accessions with higher PTI values: LA 1325 (square), PI 126443 (rhombus), LA 1522 (up-pointing triangle), LA 1340 (down-pointing triangle) and LA 1245 (filled circle). Grey symbols represent the five accessions with lower PTI values: LA 1938 (square), LA 3320 (rhombus), LA 2711 (up-pointing triangle), LA 2548 (down-pointing triangle) and OT 2209 (filled circle). Values indicate the means ± SE of three biological replicas. No statistically significant correlation was found for any of the three correlations. PTI vs. [Na+] leaves and PTI vs. [Na+] roots were tested using the Pearson correlation coefficient, whereas PTI vs. [Na+] stems was tested using the Spearman correlation coefficient.
Proline and sucrose concentrations of both control and salt-treated plants were measured in the leaves. All tomato plants treated with 100 mM NaCl for 3 weeks showed a significant increase in the concentration of both proline and sucrose (data not shown). In salt-treated plants, no correlation between proline or sucrose concentrations and PTI scores was observed (data not shown).
P5CS expression, proline and sucrose content in the leaves
We analysed the P5CS gene expression and compared it to both Na+ (Fig. 2A) and proline (Fig. 2B) accumulation in the leaves. In the leaves there was a clear link between P5CS gene expression, accumulation of proline and accumulation of Na+. The higher the P5CS expression, the higher the accumulation of proline, and the lower the accumulation of Na+. This correlation, however, was not observed in the roots (data not shown).
Figure 2.
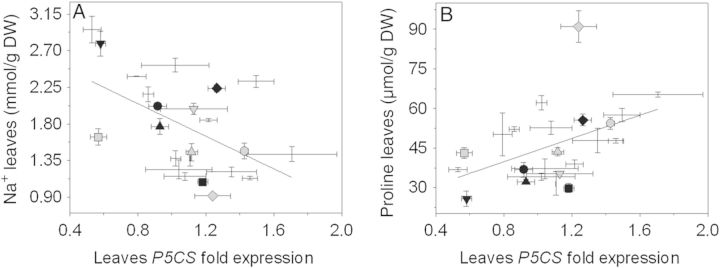
Relationship between (A) Na+ concentration and (B) proline concentration and P5CS gene expression in the leaves. Black symbols represent the five accessions with higher PTI values: LA 1325 (square), PI 126443 (rhombus), LA 1522 (up-pointing triangle), LA 1340 (down-pointing triangle) and LA 1245 (filled circle). Grey symbols represent the five accessions with lower PTI values: LA 1938 (square), LA 3320 (rhombus), LA 2711 (up-pointing triangle), LA 2548 (down-pointing triangle) and OT 2209 (filled circle). Values indicate the means ± SE of three biological replicas. Both correlations tested using the Pearson correlation coefficient. Both correlations are statistically significant.
Gene expression analysis of transporters involved in Na+ homoeostasis, Na+ accumulation, and NHXs and AVPs expression
Salt-treated accessions showed a correlation between Na+ accumulation and NHX expression (Fig. 3). Lower Na+ accumulation in the leaves was correlated with higher NHX1 expression in the roots (Fig. 3A). In the roots, higher NHX3 expression was significantly and positively correlated with higher accumulation of Na+ (Fig. 3B).
Figure 3.
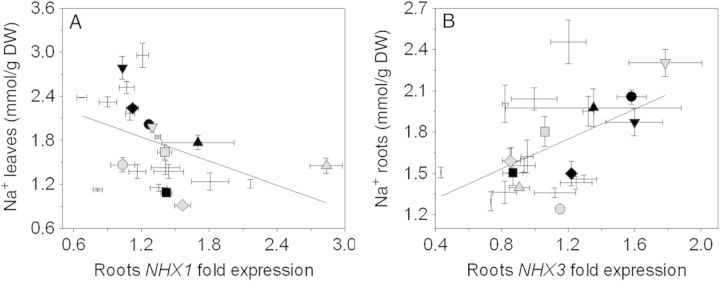
Correlations between (A) Na+ accumulation in the leaves and NHX1 expression in the roots and (B) Na+ accumulation in the roots and NHX3 expression in the roots. Black symbols represent the five accessions with higher PTI values: LA 1325 (square), PI 126443 (rhombus), LA 1522 (up-pointing triangle), LA 1340 (down-pointing triangle) and LA 1245 (filled circle). Grey symbols represent the five accessions with lower PTI values: LA 1938 (square), LA 3320 (rhombus), LA 2711 (up-pointing triangle), LA 2548 (down-pointing triangle) and OT 2209 (filled circle). Values indicate the means ± SE of three biological replicas. Values indicate the means ± SE of three biological replicas. Correlations (A) tested using the Spearman correlation coefficient. Correlations (B) tested using the Pearson correlation coefficient. Both correlations are statistically significant.
The analysis of the gene expression of NHX and AVP genes showed some statistically significant correlations (Fig. 4). Both NHX1 (Fig. 4A) and NHX2 (Fig. 4B) expressions positively correlated with AVP3 expression in the leaves. In the roots, NHX2 (Fig. 4C), NHX3 (Fig. 4D) and NHX4 (Fig. 4E) expressions were also positively correlated with AVP3 expression. Interestingly, no clear trend in these correlations was observed regarding accessions with high and low PTI scores.
Figure 4.

Correlations between expression of (A) NHX1 and AVP3 in the leaves; (B) NHX2 and AVP3 in the leaves; (C) NHX2 and AVP3 in the roots; (D) NHX3 and AVP3 in the roots; and (E) NHX4 and AVP3 in the roots. Black symbols represent the five accessions with higher PTI values: LA 1325 (square), PI 126443 (rhombus), LA 1522 (up-pointing triangle), LA 1340 (down-pointing triangle) and LA 1245 (filled circle). Grey symbols represent the five accessions with lower PTI values: LA 1938 (square), LA 3320 (rhombus), LA 2711 (up-pointing triangle), LA 2548 (down-pointing triangle) and OT 2209 (filled circle). Values indicate the means ± SE of three biological replicas. Values indicate the means ± SE of three biological replicas. All correlations tested using the Pearson correlation coefficient. All correlations are statistically significant.
Na+ accumulation and HKT, SOS and AHA gene expression
Na+ accumulation correlated with expression of several genes involved in the Na+ homoeostasis in planta (Fig. 5). Both Na+ concentrations measured in leaves (Fig. 5A) and stems (Fig. 5B) correlated with HKT1;2 expression in roots. From the 23 accessions studied, only LA 2695, LA 2860, Abigail F1 and LA 2711 showed a reduction in the root HKT1;2 expression when treated with NaCl. In roots, Na+ concentration correlated with HKT1;1 (Fig. 5C), SOS1 (Fig. 5D) and AHA2 (Fig. 5F) expression in the roots. Also in the roots, a positive significant correlation between SOS1 and AHA7 expressions was observed (Fig. 5E).
Figure 5.

Na+ accumulation in the (A) leaves and (B) in the stems and its correlation with HKT1;2 and (C) HKT1;1 expression in the roots, (D) Na+ accumulation in the roots and its correlation with SOS1 expression in the roots, (E) LHA7 and SOS1 expression in the roots, (F) Na+ accumulation and LHA2 expression in the roots. Black symbols represent the five accessions with higher PTI values: LA 1325 (square), PI 126443 (rhombus), LA 1522 (up-pointing triangle), LA 1340 (down-pointing triangle) and LA 1245 (filled circle). Grey symbols represent the five accessions with lower PTI values: LA 1938 (square), LA 3320 (rhombus), LA 2711 (up-pointing triangle), LA 2548 (down-pointing triangle) and OT 2209 (filled circle). Values indicate the means ± SE of three biological replicas. The Pearson correlation coefficient was used in (C) and (D) and the Spearman correlation coefficient was used in (A), (B) and (E). All correlations are statistically significant.
Correlation analysis and PCA
Due to the great variation in the parameters between the accessions, and because of the statistically significant correlations observed among some of these parameters (Table 1) we decided to perform a principal component analysis (PCA), (Fig. 6). With this analysis we aimed to reveal the contribution of the correlations to the differences in salinity tolerance observed in Table 1.
Table 1.
Linear correlation coefficients between ion concentrations measured in leaf, stem and root tissue of salt-treated plants; proline concentration measured in the leaves of salt-treated plants; and gene expression of several genes involved in the transport of Na+. Ion and proline concentrations used in these correlations were measured only in salt-treated samples. Proline was only measured in leaf tissue. The asterisks show statistically significant correlations, P< 0.05.
| Leaves Na+ | Stems Na+ | Roots Na+ | Proline | Roots AHA7 | Leaves AVP4 | Leaves AVP3 | Roots AVP3 | |
|---|---|---|---|---|---|---|---|---|
| Leaves Cl− | 0.419* | |||||||
| Stems Cl− | 0.493* | |||||||
| Roots HKT1;2 | 0.414* | 0.188* | ||||||
| Roots HKT1;1 | 0.308* | |||||||
| Roots SOS1 | 0.230* | |||||||
| Roots AHA2 | 0.363* | |||||||
| Roots NHX1 | 0.1887* | |||||||
| Roots NHX3 | 0.259* | 0.181* | ||||||
| Roots NHX2 | 0.200* | |||||||
| Roots NHX4 | 0.363* | |||||||
| Leaves NHX1 | 0.313* | |||||||
| Leaves NHX2 | 0.163* | |||||||
| Leaves P5CS | 0.271* | 0.205* |
Figure 6.

Two axes of a principal component (PC1 and PC2) analysis showing the position of several physiological parameters. Arrows indicate eigenvectors representing the strength and direction of the trait correlation relative to the first two principal components (PC1 and PC2). Dots indicate the PTI values of the accessions analysed in this study.
The patterns of the variables co-variation are shown by PCA, and eigenvectors represent the strength, indicated by the length of the vector, and direction of the trait correlation in relation to the first two principal components (PCs) (Fig. 6). Both PCs accounted for 39 % of the total variance. Both Na+ and Cl− accumulation in the stem and in the leaf were explained by the major PC1. In PC1 Na+ accumulation in the stems and in the leaves, Cl− accumulation in the stems and in the leaves and HKT1;2 expression in the roots were strongly associated. Na+ accumulation in the roots and LHA2, NHX3 and AVP3 expressions in the roots were explained by the PC2 as they did not significantly contribute to other PCs.
Discussion
Salinity tolerance does not correlate with shoot Na+ concentrations
For several crop species salinity tolerance has been linked to an effective Na+ exclusion from the shoots (Gorham et al. 1990; Schachtman and Munns 1992; Forster 2001; Zhu et al. 2001; Munns and James 2003; Garthwaite et al. 2005). Accumulation or exclusion of Na+ from the shoots under saline conditions is based on the capacity of the plant to reduce the uptake of Na+ (Koval and Koval 1996). In tomato, controlled Na+ accumulation in the shoot may be an important factor in enhancing salt tolerance (Perez-Alfocea et al. 1996; Cuartero and Fernandez-Munoz 1999). Nevertheless, some studies show that the link between Na+ exclusion from the shoots and salinity tolerance is not as clear as previously assumed (Rus et al. 2006; Genc et al. 2010; Jha et al. 2010). Similarly, in this study, no correlation was observed between Na+ accumulation in any of the tissues analysed and tolerance to salinity. For example, both LA 1325 (tolerant) and LA 3320 (sensitive) showed similar Na+ accumulations in the leaves [see Supporting Information]. Regarding K+, tomato accessions with high and low PTI scores—LA 1325, LA 3320 and OT 2209—were able to maintain constant concentrations of K+ in all tissues analysed when treated with NaCl.
In a study with Arabidopsis ecotypes, slower growth rates correlated with increased salinity tolerance (Jha et al. 2010). In this way, accessions with slower growth in control conditions showed higher salinity tolerance when growing under salinity stress conditions (Jha et al. 2010). In this study, we observed this only for some of the accessions. Slow growth means reduced transpiration and reduced water uptake and, consequently, reduced Na+ uptake via the roots, which might allow more time and better Na+ partitioning in the shoots. This suggests that for the results observed in our study, except Na+ exclusion, other mechanisms involved in Na+ tissue tolerance might play an important role in salinity tolerance.
P5CS expression is related to Na+, proline and sucrose accumulation in the leaves
In this study, a positive correlation between the expression of P5CS and the accumulation of proline in the leaves was observed (Fig. 2B). When accessions were analysed individually, it was possible to see that accessions with high and low PTI scores had the same proline accumulation in the leaves. This agrees with studies reporting high accumulation of proline in tolerant (Jain et al. 1991; Kirti et al. 1991; Juan et al. 2005) and sensitive (Tal et al. 1979) tomato accessions. It has been suggested that proline accumulation is related to lower concentrations of Na+ in the leaves. However, Juan et al. (2005) reported that proline accumulation and biomass production are unrelated. The same result was observed in our study. Despite the significant increase in proline accumulation due to the salinity treatment shown by all accessions, no correlation between proline and PTI was observed. This suggests that, although proline accumulation is a common response to salinity stress, it is not, per se, the driving force for salinity tolerance in tomato.
There is also some controversy about the role of sugars in salinity tolerance (Juan et al. 2005). Despite a reduction in net CO2 assimilation during salinity stress (Murakeozy et al. 2003; Ashraf and Harris 2004), a higher accumulation of soluble sugars in stressed plants has widely been reported. Nevertheless, in a study by Ashraf (1997), this hypothesis was not confirmed. Juan et al. (2005) showed that the highest and lowest accumulations of sucrose were observed in the most and in the least tolerant cultivars, respectively. The same authors reported that Na+ and Cl− concentrations, as well as biomass, correlated with the concentration of sucrose (Juan et al. 2005). In our study, despite the significant increases in sucrose accumulation observed in all accessions, no correlation between sucrose and PTI or Na+ or Cl− was observed.
Role of NHXs and AVPs in Na+, K+ and Cl− homoeostasis
In this study, we observed that high expression in the roots of NHX1 and NHX3 correlated with low accumulation of Na+ in the leaves and high accumulation of Na+ in the roots, respectively (Fig. 3A and B). This agreed with previously published results, since NHX1 is involved in Na+ and K+ sequestration in the vacuole (Apse et al. 1999; Venema et al. 2003), and NHX3 was predominantly expressed in root tissue (Maathuis et al. 2003). However, these results were opposed to those obtained by Villalta et al. (2008) who map SlNHX3 to a QTL related to Na+ accumulation in the leaves. Although Villalta et al. (2007) reported that SlNHX1 is associated with a QTL for Cl− concentration in young leaves, we did not find a clear correlation between SlNHX1 expression and Cl− accumulation in the leaves. Interestingly, SlNHX2 expression did not correlate with K+ concentrations in any of the tissues analysed in this study, albeit its ubiquitous expression pattern (Venema et al. 2003). NHXs expression levels were positively correlated with AVPs expression (Fig. 4). Although AVP has no direct role in Na+ homoeostasis, its ability to create a proton gradient between the vacuole and the cytosol (Munns and Tester 2008) can energize the activity of NHX (Gaxiola et al. 2001; Maathuis et al. 2003; Jha et al. 2010).
Role of HKT1;1, HKT1;2, SOS1 and AHA in Na+ homoeostasis
In this study, a positive correlation between root HKT1;2 expression and the concentrations of Na+ measured in the leaves and in the stems, but not in the roots was observed. In the roots, the expression of HKT1;1 and the accumulation of Na+ were correlated. These results can be considered surprising as the tomato HKT1;2 sequence is more similar to AtHKT1;1 than tomato HKT1;1 (Asins et al. 2012), and because AtHKT1;1 expression in the roots is associated with lower Na+ accumulation in the shoots (Berthomieu et al. 2003; Sunarpi et al. 2005; Davenport et al. 2007; Moller et al. 2009; Jha et al. 2010; Plett et al. 2010). Interestingly, both accessions with the highest and lowest PTI scores, LA 1245 and OT 2209, respectively, showed similar HKT1;2 expression in their roots, but different Na+ accumulations in their shoots. In the case of HKT1;1, both accessions with the highest PTI values showed reduced HKT1;1 expression in the roots when treated with salt. Nevertheless, these two accessions showed different behaviours in terms of Na+ accumulation in the roots; hence, LA 1245 accumulated more Na+ than PI 126443. In a work by Rus et al. (2006), the correlation between weak AtHKT1;1 alleles of two Arabidopsis thaliana ecotypes and high Na+ accumulation in the shoots is described, this is in contrast with the tomato ecotypes from this study, which showed low Na+ accumulation. Nevertheless, the results we obtained with HKT1;1 should be treated with caution. When expressed in Xenopus laevis oocytes, SlHKT1;1 did not produce any measurable currents (P.A., unpubl. res.), in contrast with the results reported by Asins et al. (2012). This group reported that, when expressed in yeast cells, SlHKT1;1, but not SlHKT1;2, depleted the Na+ present in the growing medium (Asins et al. 2012). This can result from a deficient translation of the protein, when expressed in heterologous systems (Haro et al. 2005).
In this study, high SOS1 expression correlated with high Na+ accumulation in the roots. This might be explained by the need of stressed plants to pump more Na+ out of the cell, either via loading of Na+ into the xylem or via extrusion of Na+ back to the growth medium. Here, we could observe a positive correlation between SOS1 and AHA7 expression as well as a positive correlation between AHA2 and Na+ accumulation, both in the roots. This suggests that SOS1 is energized by AHA7, but not AHA2. This is interesting, as Maathuis et al. (2003) reported that the energization of Na+/H+ extrusion at the root soil boundary is likely to be driven by AHA2. Nevertheless, AHA2 is also involved in the Na+ homoeostasis in the root, possibly via an indirect mechanism, shown by the positive correlation between AHA2 and Na+ accumulation.
Conclusions
In conclusion, several correlations were observed among the different genes analysed, and between different genes and ions or proline concentrations. For instance, Na+ concentrations in both the leaves and stems were positively correlated with HKT1;2 expression in the roots, and Na+ concentration measured in the roots was positively correlated with HKT1;1 expression also in the roots. Higher and lower Na+ accumulation in the roots and leaves were significantly correlated with higher NHX3 and NHX1 expression in the roots, respectively. However, accessions with high and low PTI scores had similar concentrations of ions, proline and sucrose and gene expression levels, showing that the maintenance of growth in the presence of 100 mM NaCl did not correlate with the exclusion or accumulation of Na+. This suggests that in tomato, for a particular level of salinity tolerance, a complex ratio between Na+ exclusion and tissue tolerance defines the salinity tolerance of individual tomato accessions. In tomato it is likely that the mechanisms of tissue and salinity tolerance work independently, making salinity tolerance depend on their relative effects rather than on one of these mechanisms alone.
Sources of Funding
This work was carried out within the PhD project of P.A. ‘Mayas: making Solanum lycopersicum more salt tolerant’ and was supported by Enza Zaden, Enkhuizen, the Netherlands.
Contributions by the Authors
P.A., A.H.d.B. and G.-J.d.B. conceived and designed the experiments. P.A. and R.F. performed the experiments. P.A. analysed the data. P.A. and A.H.d.B. wrote the paper.
Conflicts of Interest Statement
None declared.
Supporting Information
The following Supporting Information is available in the online version of this article:
File 1. Table. Primers used in the qRT–PCR studies.
File 2. Table. Tolerance to salinity of 23 tomato accessions grown in rockwool plugs soaked with Hoagland's solution and treated with either 0 or 100 mM NaCl for 2 weeks. Values indicate the means ± SE of three biological replicates. The asterisks indicate significant differences according to Student's t-test (*P < 0.05).
File 3. Table. List of Na+, K+, Cl− and Na+/K+ and concentrations in the (A) roots, (B) stems and (C) leaves of 23 tomato accessions grown in rockwool plugs soaked with Hoagland's solution for 3 weeks before treated to either 0 or 100 mM NaCl for 2 weeks. Values indicate the means ± SE of three biological replicas. The asterisks indicate significant differences according to one-way ANOVA (*P < 0.05).
Literature Cited
- Ali Z, Park HC, Ali A, Oh DH, Aman R, Kropornicka A, Hong H, Choi W, Chung WS, Kim WY, Bressan RA, Bohnert HJ, Lee SY, Yun DJ. TsHKT1;2, a HKT1 homolog from the extremophile Arabidopsis relative Thellungiella salsuginea, shows K+ specificity in the presence of NaCl. Plant Physiology. 2012;158:1463–1474. doi: 10.1104/pp.111.193110. [DOI] [PMC free article] [PubMed] [Google Scholar]
- Apse MP, Aharon GS, Snedden A, Blumwald E. Salt tolerance conferred by overexpression of a vacuolar Na+/H+ antiport in Arabidopsis. Science. 1999;285:1256–1258. doi: 10.1126/science.285.5431.1256. [DOI] [PubMed] [Google Scholar]
- Ashraf M. Changes in soluble carbohydrates and soluble proteins in three arid-zone grass species under salt stress. Tropical Agriculture. 1997;74:234–237. [Google Scholar]
- Ashraf M, Harris PJ. Potential biochemical indicators of salinity tolerance in plants. Plant Science. 2004;166:3–16. [Google Scholar]
- Asins JM, Villalta I, Aly MM, Olias R, Alvarez MP, Huertas R, Li J, Jaime-Perez N, Haro R, Raga V, Carbonell EA, Belver A. Two closely linked tomato HKT coding genes are positional candidates for the major tomato QTL involved in Na+/K+ homeostasis. Plant, Cell and Environment. 2012;36:1171–1191. doi: 10.1111/pce.12051. [DOI] [PubMed] [Google Scholar]
- Aziz A, Martin-Tanguy J, Larher F. Stress-induced changes in polyamine and tyramine levels can regulate proline accumulation in tomato leaf discs treated with sodium chloride. Physiologia Plantarum. 1998;104:195–202. [Google Scholar]
- Bates LS, Waldren RP, Teare ID. Rapid determination of free proline for water stress studies. Plant and Soil. 1973;39:205–207. [Google Scholar]
- Berthomieu P, Conejero G, Nublat A, Brackenbury WJ, Lambert C, Savio C, Uozumi N, Oiki S, Yamada K, Cellier F, Gosti F, Simonneau T, Essa PA, Tester M, Very AA, Sentenac H, Casse F. Functional analysis of AtHKT1 in Arabidopsis shows that Na+ recirculation by the phloem is crucial for salt tolerance. EMBO Journal. 2003;22:2004–2014. doi: 10.1093/emboj/cdg207. [DOI] [PMC free article] [PubMed] [Google Scholar]
- Bolarin MC, Santa-Cruz A, Cayuela E, Perez-Alfocea F. Short-term solute changes in leaves and roots of cultivated and wild tomato seedling under salinity. Journal of Plant Physiology. 1995;147:463–468. [Google Scholar]
- Chen H, An R, Tang JH, Cui XH, Hao FS, Chen J, Wang XC. Over-expression of a vacuolar Na+/H+ antiporter gene improves salt tolerance in an upland rice. Molecular Breeding. 2007;19:215–225. [Google Scholar]
- Conde A, Chaves MM, Geros H. Membrane transport, sensing and signaling in plant adaptation to environmental stress. Plant and Cell Physiology. 2011;52:1583–1602. doi: 10.1093/pcp/pcr107. [DOI] [PubMed] [Google Scholar]
- Cuartero J, Fernandez-Munoz R. Tomato and salinity. Scientia Horticulturae. 1999;78:83–125. [Google Scholar]
- Davenport RJ, Munoz-Mayor A, Jha D, Essah PA, Rus A, Tester M. The Na+ transporter AtHKT1;1 controls retrieval of Na+ from the xylem in Arabidopsis. Plant, Cell and Environment. 2007;30:497–507. doi: 10.1111/j.1365-3040.2007.01637.x. [DOI] [PubMed] [Google Scholar]
- El-Hendawy SE, Hu Y, Schmidhalter U. Growth, ion content, gas exchange, and water relations of wheat genotypes differing in salt tolerances. Australian Journal of Agricultural Research. 2004;56:123–134. [Google Scholar]
- Fairbairn DJ, Liu WH, Schachtman DP, Gomez-Gallego S, Day SR, Teasdale RD. Characterisation of two distinct HKT1-like potassium transporters from Eucalyptus camaldulensis. Plant Molecular Biology. 2000;43:515–525. doi: 10.1023/a:1006496402463. [DOI] [PubMed] [Google Scholar]
- Food and Agriculture Organization (FAO) 2009. FAO land and plant nutrition management service http://www.fao.org/ag/agl/agll/spush/ . [PubMed]
- Forster B. Mutation genetics of salt tolerance in barley: an assessment of Golden Promise and other semi-dwarf mutants. Euphytica. 2001;120:317–328. [Google Scholar]
- Fujita T, Maggio A, Garcia-Rios M, Bressan RA, Csonka LN. Comparative analysis of the regulation of expression and structures of two evolutionary divergent genes for Delta1-pyrroline-5-carboxylate synthetase from tomato. Plant Physiology. 1998;118:661–674. doi: 10.1104/pp.118.2.661. [DOI] [PMC free article] [PubMed] [Google Scholar]
- Galvez FJ, Baghour M, Hao G, Cagnac O, Rodriguez-Rosales MP, Venema K. Expression of LeNHX isoforms in response to salt stress in salt sensitive and salt tolerant tomato species. Plant Physiology and Biochemistry. 2012;51:109–115. doi: 10.1016/j.plaphy.2011.10.012. [DOI] [PubMed] [Google Scholar]
- Garthwaite AJ, von Bothmer R, Colmer T. Salt tolerance in wild Hordeum species is associated with restricted entry of Na+ and Cl− into the shoots. Journal of Experimental Botany. 2005;56:2365–2378. doi: 10.1093/jxb/eri229. [DOI] [PubMed] [Google Scholar]
- Gaxiola R, Rao R, Sherman A, Grisafi P, Alper SL, Fink GR. The Arabidopsis thaliana proton transporters, AtNHX1 and AVP1, can function in cation detoxification in yeast. Proceedings of the National Academy of Sciences of the USA. 1999;96:1480–1485. doi: 10.1073/pnas.96.4.1480. [DOI] [PMC free article] [PubMed] [Google Scholar]
- Gaxiola R, Li J, Undurraga S, Dang LM, Allen GJ, Alper SL, Fink GR. Drought- and salt-tolerant plants result from overexpression of the AVP1 H+-pump. Proceedings of the National Academy of Sciences of the USA. 2001;98:11444–11449. doi: 10.1073/pnas.191389398. [DOI] [PMC free article] [PubMed] [Google Scholar]
- Genc Y, Mcdonald GK, Tester M. Reassessment of tissue Na+ concentration as a criterion for salinity tolerance in bread wheat. Plant, Cell and Environment. 2007;30:1486–1498. doi: 10.1111/j.1365-3040.2007.01726.x. [DOI] [PubMed] [Google Scholar]
- Genc Y, Oldach K, Verbyla AP, Lott G, Hassan M, Tester M, Wallwork H, McDonald GK. Sodium exclusion QTL associated with improved seedling growth in bread wheat under salinity stress. Theoretical and Applied Genetics. 2010;121:877–894. doi: 10.1007/s00122-010-1357-y. [DOI] [PubMed] [Google Scholar]
- Gorham J, Bristol A, Young EM, Jonesh RGW, Kashour G. Salt tolerance in the Triticeae – K+/Na+ discrimination in barley. Journal of Experimental Botany. 1990;41:1095–1101. [Google Scholar]
- Haro R, Banuelos MA, Senn ME, Barrero-Gil J, Rodriguez-Navarro A. HKT1 mediates sodium uniport in roots. Pitfalls in the expression of HKT1 in yeast. Plant Physiology. 2005;139:1495–1506. doi: 10.1104/pp.105.067553. [DOI] [PMC free article] [PubMed] [Google Scholar]
- He C, Yan J, Shen G, Fu L, Holaday AS, Auld D, Blumwald E, Zhang H. Expression of an Arabidopsis vacuolar sodium/proton antiporter gene in cotton improves photosynthetic performance under salt conditions and increases fiber yield in the field. Plant and Cell Physiology. 2005;46:1848–1854. doi: 10.1093/pcp/pci201. [DOI] [PubMed] [Google Scholar]
- Hmida-Sayari A, Gargouri-Bouzid R, Bidani A, Jaoua L, Savoure A, Jaoua S. Overexpression of delta1-pyrroline-5-carboxylate synthetase increases proline production and confers salt tolerance in transgenic potato plants. Plant Science. 2005;169:746–752. [Google Scholar]
- Hu CA, Delaunew AJ, Verma DP. A bifunctional enzyme (delta1-pyrroline-5-carboxylate synthetase) catalyzes the first two steps in proline biosynthesis in plants. Proceedings of the National Academy of Sciences of the USA. 1992;89:9354–9358. doi: 10.1073/pnas.89.19.9354. [DOI] [PMC free article] [PubMed] [Google Scholar]
- Huertas R, Olias R, Eljakaoui Z, Galvez FJ, Li J, De Morales PA, Belver A, Rodriguez-Rosales MP. Overexpression of SlSOS2 (SlCIPK24) confers salt tolerance to transgenic tomato. Plant, Cell and Environment. 2012;35:1467–1482. doi: 10.1111/j.1365-3040.2012.02504.x. [DOI] [PubMed] [Google Scholar]
- Igarashi Y, Yoshiba Y, Sanada Y, Yamaguchi-Shinozaki K, Wada K, Shinozaki K. Characterization of the gene for delta1-pyrroline-5-carboxylate synthetase and correlation between the expression of the gene and salt tolerance in Oryza sativa L. Plant Molecular Biology. 1997;33:857–865. doi: 10.1023/a:1005702408601. [DOI] [PubMed] [Google Scholar]
- Jabnoune M, Espeout S, Mieulet D, Fizames C, Verdeil JL, Conejero G, Rodriguez-Navarro A, Sentenac H, Guiderdoni E, Abdelly C, Very AA. Diversity in expression patterns and functional properties in the rice HKT transporter family. Plant Physiology. 2009;150:1955–1971. doi: 10.1104/pp.109.138008. [DOI] [PMC free article] [PubMed] [Google Scholar]
- Jain S, Nainawatee HS, Jain RK, Chowdhury JB. Proline status of genetically stable salt-tolerant Brassica juncea L. somaclones and their parent cv. ‘Parkash. Plant Cell Reports. 1991;9:684–687. doi: 10.1007/BF00235357. [DOI] [PubMed] [Google Scholar]
- Jha D, Shirley N, Tester M, Roy SJ. Variation in salinity tolerance and shoot sodium accumulation in Arabidopsis ecotypes linked to differences in the natural expression levels of transporters involved in sodium transport. Plant, Cell and Environment. 2010;33:793–804. doi: 10.1111/j.1365-3040.2009.02105.x. [DOI] [PubMed] [Google Scholar]
- Juan M, Rivero RM, Romero L, Ruiz JM. Evaluation of some nutritional and biochemical indicators in selecting salt-tolerant tomato cultivars. Environmental and Experimental Botany. 2005;54:193–201. [Google Scholar]
- Kirti PB, Hadi S, Chopra VL. Seed transmission of salt tolerance in regenerants of Brassica juncea selected in vitro. Cruciferae Newsletter. 1991;85:14–15. [Google Scholar]
- Koval VS, Koval SF. Genetic analysis of salt tolerance in barley-identification of number of genes. Genetica. 1996;32:1098–1103. [Google Scholar]
- Laurie S, Feeney KA, Maathuis FJ, Heard PJ, Brown SJ, Leigh RA. A role for HKT1 in sodium uptake by wheat roots. The Plant Journal. 2002;32:139–149. doi: 10.1046/j.1365-313x.2002.01410.x. [DOI] [PubMed] [Google Scholar]
- Livak KJ, Schmittgen TD. Analysis of relative gene expression data using real-time quantitative PCR and the 2-delta delta CT method. Methods. 2001;25:402–408. doi: 10.1006/meth.2001.1262. [DOI] [PubMed] [Google Scholar]
- Maathuis FJ, Filatov V, Herzyk P, Krijger GC, Axelsen KB, Chen S, Green BJ, Li Y, Madagan KL, Sanchez-Fernandez R, Forde BG, Palmgren MG, Rea PA, Williams LE, Sanders D, Amtmann A. Transcriptome analysis of root transporters reveals participation of multiple gene families in the response to cation stress. The Plant Journal. 2003;35:675–692. doi: 10.1046/j.1365-313x.2003.01839.x. [DOI] [PubMed] [Google Scholar]
- Manaa A, Ahmed HB, Valot B, Bouchet JP, Aschi-Smiti S, Causse M, Faurobert M. Salt and genotype impact on plant physiology and root proteome variations in tomato. Journal of Experimental Botany. 2011;62:2797–2813. doi: 10.1093/jxb/erq460. [DOI] [PubMed] [Google Scholar]
- Mian A, Oomen RJ, Isayenkov S, Sentenac H, Maathuis FJ, Very AA. Overexpression of a Na+ and K+-permeable HKT transporter in barley improves salt tolerance. The Plant Journal. 2011;68:468–479. doi: 10.1111/j.1365-313X.2011.04701.x. [DOI] [PubMed] [Google Scholar]
- Miller JC, Tanksley SD. RFLP analysis of phylogenetic relationships and genetic variation in the genus Lycopersicon. Theoretical and Applied Genetics. 1990;80:437–448. doi: 10.1007/BF00226743. [DOI] [PubMed] [Google Scholar]
- Moller IS, Gilliham M, Jha D, Mayo G, Roy SJ, Coates JC, Haseloff J, Tester M. Shoot Na+ exclusion and increased salinity tolerance engineered by cell type-specific alteration of Na+ transport in Arabidopsis. The Plant Cell. 2009;21:2163–2178. doi: 10.1105/tpc.108.064568. [DOI] [PMC free article] [PubMed] [Google Scholar]
- Munns R, James RA. Screening methods for salinity tolerance: a case study with tetraploid wheat. Plant and Soil. 2003;253:201–218. [Google Scholar]
- Munns R, Tester M. Mechanisms of salinity tolerance. Annual Review of Plant Biology. 2008;59:651–681. doi: 10.1146/annurev.arplant.59.032607.092911. [DOI] [PubMed] [Google Scholar]
- Murakeozy EP, Nagy Z, Bouchereau A, Tuba Z. Seasonal changes in the levels of compatible osmolytes in three halophytic species of inland saline vegetation in Hungary. Journal of Plant Physiology. 2003;160:395–401. doi: 10.1078/0176-1617-00790. [DOI] [PubMed] [Google Scholar]
- Palmgren MG, Harper JF. Pumping with plant P-type ATPases. Journal of Experimental Botany. 1999;50:883–893. [Google Scholar]
- Palmgren MG, Nissen P. P-type ATPases. Annual Review of Biophysics. 2011;40:243–266. doi: 10.1146/annurev.biophys.093008.131331. [DOI] [PubMed] [Google Scholar]
- Parida AK, Das AB. Salt tolerance and salinity effects on plants: a review. Ecotoxicology and Environmental Safety. 2005;60:324–349. doi: 10.1016/j.ecoenv.2004.06.010. [DOI] [PubMed] [Google Scholar]
- Perez-Alfocea F, Balibrea ME, Cruz AS, Estan MT. Agronomical and physiological characterization of salinity tolerance in a commercial tomato hybrid. Plant and Soil. 1996;180:251–257. [Google Scholar]
- Platten JD, Cotsaftis O, Berthomieu P, Bohnert H, Davenport RJ, Fairbairn DJ, Horie T, Leigh RA, Lin HX, Luan S, Maser P, Pantoja O, Rodriguez-Navarro A, Schachtman DP, Schroeder JI, Sentenac H, Uozumi N, Very AA, Zhu JK, Dennis ES, Tester M. Nomenclature for HKT transporters, key determinants of plant salinity tolerance. Trends in Plant Science. 2006;11:372–374. doi: 10.1016/j.tplants.2006.06.001. [DOI] [PubMed] [Google Scholar]
- Plett D, Safwat G, Gilliham M, Moller IS, Roy S, Shirley N, Jacobs A, Johnson A, Tester M. Improved salinity tolerance of rice through cell type-specific expression of AtHKT1;1. PLoS ONE. 2010;5:e12571. doi: 10.1371/journal.pone.0012571. [DOI] [PMC free article] [PubMed] [Google Scholar]
- Popp M, Smirnoff N. Polyol accumulation and metabolism during water deficit. In: Smirnoff N, editor. Environment and plant metabolism: flexibility and acclimation. Oxford: Bios Scientific; 1995. pp. 199–215. [Google Scholar]
- Prior LD, Grieve AM, Bevington KB, Slavich PG. Long-term effects of saline irrigation water on ‘Valencia’ orange trees: relationships between growth and yield, and salt levels in soil and leaves. Australian Journal of Agricultural Research. 2007;58:349–358. [Google Scholar]
- Qiu QS, Guo Y, Dietrich MA, Schumaker KS, Zhu JK. Regulation of SOS1, a plasma membrane Na+/H+ exchanger in Arabidopsis thaliana, by SOS2 and SOS3. Proceedings of the National Academy of Sciences of the USA. 2002;99:8436–8441. doi: 10.1073/pnas.122224699. [DOI] [PMC free article] [PubMed] [Google Scholar]
- Ren ZH, Gao JP, Gao JP, Li LG, Cai XL, Huang W, Chao DY, Zhu MZ, Wang ZY, Luan S, Lin HX. A rice quantitative trait locus for salt tolerance encodes a sodium transporter. Nature Genetics. 2005;37:1141–1146. doi: 10.1038/ng1643. [DOI] [PubMed] [Google Scholar]
- Rus A, Baxter I, Muthukumar B, Gustin J, Lahner B, Yakubova E, Salt DE. Natural variants of AtHKT1 enhance Na+ accumulation in two wild populations of Arabidopsis. PLoS Genetics. 2006;2:1964–1973. doi: 10.1371/journal.pgen.0020210. [DOI] [PMC free article] [PubMed] [Google Scholar]
- Schachtman DP, Munns R. Sodium accumulation in leaves of Triticum species that differ in salt tolerance. Functional Plant Biology. 1992;19:331–340. [Google Scholar]
- Shabala S, Cuin TA. Potassium transport and plant salt tolerance. Physiologia Plantarum. 2008;133:651–669. doi: 10.1111/j.1399-3054.2007.01008.x. [DOI] [PubMed] [Google Scholar]
- Shi H, Ishitani M, Kim C, Zhu JK. The Arabidopsis thaliana salt tolerance gene SOS1 encodes a putative Na+/H+ antiporter. Proceedings of the National Academy of Sciences of the USA. 2000;97:6896–6901. doi: 10.1073/pnas.120170197. [DOI] [PMC free article] [PubMed] [Google Scholar]
- Shi H, Quintero FJ, Pardo JM, Zhu JK. The putative plasma membrane Na+/H+ antiporter SOS1 controls long-distance Na+ transport in plants. The Plant Cell. 2002;14:465–477. doi: 10.1105/tpc.010371. [DOI] [PMC free article] [PubMed] [Google Scholar]
- Shi HZ, Lee BH, Wu SJ, Zhu JK. Overexpression of a plasma membrane Na+/H+ antiporter gene improves salt tolerance in Arabidopsis thaliana. Nature Biotechnology. 2003;21:81–85. doi: 10.1038/nbt766. [DOI] [PubMed] [Google Scholar]
- Silva-Ortega CO, Ochoa-Alfaro AE, Reyes-Aguero JA, Aguado-Santacruz GA, Jimenez-Bremont JF. Salt increases the expression of p5cs gene and induces proline accumulation in cactus pear. Plant Physiology and Biochemistry. 2008;46:82–92. doi: 10.1016/j.plaphy.2007.10.011. [DOI] [PubMed] [Google Scholar]
- Sunarpi, Horie T, Motoda J, Kubo M, Yang H, Yoda K, Horie R, Chan WY, Leung HY, Hattori K, Konomi M, Osumi M, Yamagami M, Schroeder JI, Uozumi N. Enhanced salt tolerance mediated by AtHKT1 transporter-induced Na+ unloading from xylem vessels to xylem parenchyma cells. The Plant Journal. 2005;44:928–938. doi: 10.1111/j.1365-313X.2005.02595.x. [DOI] [PubMed] [Google Scholar]
- Tal M, Katz A, Heikin H, Dehan K. Salt tolerance in the wild relatives of the cultivated tomato: proline accumulation in Lycopersicon esculentum Mill., L. peruvianum Mill., and Solanum pennellii Cor. treated with NaCl and polyethyleneglycol. New Phytologist. 1979;82:349–360. [Google Scholar]
- Tester M, Davenport R. Na+ tolerance and Na+ transport in higher plants. Annals of Botany. 2003;91:503–527. doi: 10.1093/aob/mcg058. [DOI] [PMC free article] [PubMed] [Google Scholar]
- Uozumi N, Kim EJ, Rubio F, Yamaguchi T, Muto S, Tsuboi A, Bakker EP, Nakamura T, Schroeder JI. The Arabidopsis HKT1 gene homolog mediates inward Na+ currents in Xenopus laevis oocytes and Na+ uptake in Saccharomyces cerevisiae. Plant Physiology. 2000;122:1249–1259. doi: 10.1104/pp.122.4.1249. [DOI] [PMC free article] [PubMed] [Google Scholar]
- Venema K, Belver A, Marin-Manzano MC, Rodriguez-Rosales MP, Donaire JP. A novel intracellular K+/H+ antiporter related to Na+/H+ antiporters is important for K+ ion homeostasis in plants. The Journal of Biological Chemistry. 2003;278:22453–22459. doi: 10.1074/jbc.M210794200. [DOI] [PubMed] [Google Scholar]
- Villalta I, Bernet GP, Carbonell EA, Asins MJ. Comparative QTL analysis of salinity tolerance in terms of fruit yield using two Solanum populations of F7 lines. Theoretical and Applied Genetics. 2007;114:1001–1017. doi: 10.1007/s00122-006-0494-9. [DOI] [PubMed] [Google Scholar]
- Villalta I, Reina-Sanchez A, Bolarin MC, Cuartero J, Belver A, Venema K, Carbonell EA, Asins MJ. Genetic analysis of Na+ and K+ concentrations in leaf and stem as physiological components of salt tolerance in tomato. Theoretical and Applied Genetics. 2008;116:869–880. doi: 10.1007/s00122-008-0720-8. [DOI] [PubMed] [Google Scholar]
- Xue ZY, Zhi DY, Xue GP, Zhang H, Zhao YX, Xia GM. Enhanced salt tolerance of transgenic wheat (Triticum aestivum L.) expressing a vacuolar Na+/H+ antiporter gene with improved grain yields in saline soils in the field and a reduced level of leaf Na+ Plant Science. 2004;167:849–859. [Google Scholar]
- Yao X, Horie T, Xue S, Leung HY, Katsuhara M, Brodsky DE, Wu Y, Schroeder JI. Differential sodium and potassium transport selectivities of the rice OsHKT2;1 and OsHKT2;2 transporters in plant cells. Plant Physiology. 2010;152:341–355. doi: 10.1104/pp.109.145722. [DOI] [PMC free article] [PubMed] [Google Scholar]
- Yoshiba Y, Kiyosue T, Katagiri T, Ueda H, Mizoguchi T, Yamaguchi-Shinozaki K, Wada K, Harada Y, Shinozaki K. Correlation between the induction of a gene for delta 1-pyrroline-5-carboxylate synthetase and the accumulation of proline in Arabidopsis thaliana under osmotic stress. The Plant Journal. 1995;7:751–760. doi: 10.1046/j.1365-313x.1995.07050751.x. [DOI] [PubMed] [Google Scholar]
- Zhang HX, Blumwald E. Transgenic salt-tolerant tomato plants accumulate salt in foliage but not in fruit. Nature Biotechnology. 2001;19:765–768. doi: 10.1038/90824. [DOI] [PubMed] [Google Scholar]
- Zhao FY, Zhang XJ, Li PH, Zhao YX, Zhang H. Co-expression of the Sueda salsa SsNHX1 and Arabidopsis AVP1 confer greater salt tolerance to transgenic rice than the single SsNHX1. Molecular Breeding. 2006;17:341–353. [Google Scholar]
- Zhu GY, Kinet JM, Lutts S. Characterization of rice (Oryza sativa L.) F3 populations selected for salt resistance. I. Physiological behaviour during vegetative growth. Euphytica. 2001;121:251–263. [Google Scholar]
Associated Data
This section collects any data citations, data availability statements, or supplementary materials included in this article.