Abstract
Non-mutational inactivation of p53 is frequent in acute myeloid leukemia (AML) via overexpression of MDM2. We report that treatment with MI-63, a novel inhibitor of MDM2, activates p53 signaling to induce apoptosis in AML cell lines and primary samples. Cell lines naturally devoid of p53 or expressing shRNA targeting p53 are refractory to apoptosis induction by MI-63, indicating that the effects of MI-63 require p53 expression. MI-63 induced G1 phase arrest and increased p21 expression. MI-63 induced pronounced apoptosis in all primary AML samples tested, and most importantly, was effective in inducing cell death of leukemia `stem' cells. In addition, MI-63 showed synergy with both doxorubicin and AraC. Interestingly, treatment with MI-63 also led to reduction in levels of MDM4 protein, a repressor of p53 mediated transcription, in AML cells. Our results warrant investigation of MI-63 or its analogs as anti-leukemic agents, alone or in combination with traditional chemotherapeutic agents.
Keywords: MDM2, MI-63, Acute Myelogenous Leukemia, p53
INTRODUCTION
P53 is a tumor suppressor whose transcriptional targets regulate cell cycle, DNA repair and apoptosis[1]. In unstressed cells p53 protein levels are low, and cellular stress or damage activates p53 signaling. The ensuing cell cycle arrest allowing DNA repair or programmed cell death of damaged cells, protect against tumor development. Considering the central tumor suppressor activity of p53, it is not surprising that its function is lost in ~50% of human tumors through mutations[2]. In the remainder, the p53 pathway can be inactivated through interaction with mouse double minute 2 (MDM2), MDM4 (a homolog of MDM2) and p14ARF proteins[3–6]. The importance of MDM2 in controlling p53 function is illustrated by the fact that a polymorphism in the promoter region for MDM2 that slightly perturbs MDM2 levels, increases susceptibility to tumor development in humans[7].
MDM2 is a key regulator of cellular levels and activity of p53. MDM2 represses p53 signaling by various mechanisms, including, proteolytic degradation through its ubiquitin E3 ligase activity[8], interfering with transactivation activity of p53[9] and facilitating its nuclear export[10]. Since MDM2 itself is a transcriptional target of p53, the regulation of p53 by MDM2 is subject to a feedback loop[11].
p53 mutations in de novo acute myeloid leukemias (AML) are rare[12]. On the other hand MDM2 overexpression is common in AML and correlates with shorter complete remission (CR) duration, event free survival (EFS)[13] and unfavorable chromosomal abnormalities[14,15]. Thus targeting the p53-MDM-2 interaction may have a therapeutic advantage in this disease setting. In support of this notion, Kojima et al. reported that one small molecule inhibitor of the MDM-2-p53 interaction, Nutlin 3a, activates apoptosis in acute myelogenous and chronic lymphocytic leukemias[16,17]. More recently, a spiro-oxiindole derivative, MI-63 and its analogs, have been reported to be cytotoxic to chronic lymphocytic leukemia cells[18] and colon cancer cells[19]. MI-63 binds to MDM-2 with a 12-fold higher affinity than Nutlin 3a, and is 5-times more potent in growth inhibition assays[20].
Here we demonstrate that MI-63 is a potent inducer of apoptosis in AML cell lines and primary samples, and most importantly, provide evidence that this agent targets the leukemic stem cell compartment. Interestingly, we also observed that MI-63 induced decrease in the protein levels of the MDM-2 homolog MDM-4. Our results warrant the clinical evaluation of MI-63 in acute myelogenous leukemia, alone or in combination with traditional chemotherapeutic strategies.
MATERIALS AND METHODS
Reagents
MI-63 and its inactive enantiomer MI-61 were kindly provided by Ascenta Therapeutics, Malvern, PA. A stock solution of 5mM MI-63 and MI-61 in dimethyl sulfoxide (DMSO) was stored at −20°C. The final DMSO concentration in the medium did not exceed 0.1% (vol/vol). At this concentration, DMSO itself had no effect up to 72 hours on cell growth or viability of the AML cells used in this study. DMSO treated cells were used as controls. In some experiments, cells were cultured with 1 μg/mL PSC (MDR-inhibitor) or 50 μM Z-VAD-FMK (pan caspase inhibitor) (Alexis, San Diego, CA). PSC and Z-VAD-FMK were added to the cells 1 hour before MDM2 inhibitor administration.
Cell Lines, Primary Samples and Cell Cultures
Three AML cell lines were cultured in RPMI 1640 medium containing 10% heat-inactivated fetal calf serum (FCS). OCI-AML3 and MOLM-13 cells have wild-type p53, whereas p53 is disabled in HL-60 by deletion of the p53 gene. OCI-AML3 cells stably transfected with shRNA targeting p53 and vector control were kind gifts from Dr. Paul Corn (Genitourinary Oncology, MD Anderson Cancer Center). Bone marrow and/or peripheral blood samples were obtained from patients with AML (> 60% blasts) after informed consent, according to institutional guidelines and the Declaration of Helsinki. Mononuclear cells were purified by Ficoll-Hypaque (Sigma Chemical, St. Louis, MO) density-gradient centrifugation. Cell lines were harvested in log-phase growth, seeded at a density of 2.5 × 10⁵ cells/mL (for apoptosis studies and at 5 × 10⁵/mL for Western Blots), and exposed to the MDM2 inhibitor MI-63, or to a matched concentration of MI-61. Primary AML mononuclear cells, seeded at 5 × 10⁵ cells/mL in RPMI 1640 medium supplemented with 10% FCS, were also exposed to MI-63. In experiments involving combination of MI-63 and cytosine arabinoside (AraC), the 2 agents (0, 0.5, 1, 2.5, or 5 μM) were added simultaneously to OCI-AML3 cells and cultured for 48 hours. In combination experiments of MI-63 and doxorubicin (DOX), OCI-AML3 and primary AML were treated with DOX at 0, 10, 25, 50, or 100 nM. The concentration ratio of DOX to MI-63 was 1:50 in OCI-AML3 and primary AML cells. Cells were pre-treated with DOX for 24hrs before treatment with MI-63 for an additional 48hrs. At these concentrations of DOX, 72 hours of exposure is needed to demonstrate cytotxic effect while 48 hours of ecposure to MI63 was sufficient. In all experiments, cell viability was evaluated by triplicate counts of trypan blue dye–excluding cells.
Flow Cytometry
For cell-cycle analysis, cells were fixed in ice-cold 70% ethanol and then stained with propidium iodide (PI) solution (25 μg/mL PI, 180 U/mL RNase, 0.1% Triton X-100, and 30 mg/mL polyethylene glycol in 4 mM citrate buffer, pH 7.8; Sigma Chemical). The DNA content was determined using a FACS Calibur flow cytometer (Becton Dickinson Immunocytometry Systems). Cell debris were defined as events in the lowest 10% range of fluorescence and eliminated from analysis. For Annexin V binding studies, cells were washed twice with Annexin V binding buffer (10mM HEPES [N-2-hydroxyethylpiperazine- N_-2-ethanesulfonic acid], 140 mM NaCl, and 5 mM CaCl2 at pH 7.4; Sigma Chemical Co.) and incubated with a 1:500 solution of FITC–conjugated Annexin V (Roche Diagnostics) for 15 minutes at room temperature. Induction of apoptosis in AML stem cells was determined by a multi-parametric flow cytometry assay using CD34-APC, CD38-PE Cy7, CD123-PE (all from BD Biosciences), and AnnexinV-FITC (Roche Diagnostics). Cells were stained in Annexin V binding buffer and analyzed by flow cytometry[21] as previously described. Briefly, one million total cells were measured per sample using a 4-laser 12-parameter LSRII flow cytometer (Becton Dickinson Immunocytometry Systems), and the frequency of CD34+/CD38−/CD123+ cells was determined by analysis in DiVa v6.0 software. For cell-cycle and Annxin V binding, cells were incubated with 10ug/mL Hoechst 33342 at 37°C for 30 minutes prior to Annexin V staining as described above, and analyzed with a solid-state 355nm equipped LSRII and analyzed using FlowJo v7.4 (Treestar, Inc) All experiments were conducted in triplicate.
Western Blot Analysis
Cells were lysed in protein lysis buffer. After protein quantitation, equal amount of protein lysate was placed on 12% sodium dodecyl sulfate–polyacrylamide gel electrophoresis (SDS-PAGE) for 2 hours at 90V, followed by transfer of the protein to a Hybond-P membrane (Amersham Biosciences). Membranes were probed with rabbit polyclonal anti-p53 (FL-393; 1:1000; Santa Cruz Biotechnology), mouse monoclonal anti-MDM2 (sc-5304, Santa Cruz Biotechnology), rabbit anti-MDM4 antibody (Bethyl Laboratories Inc.), rabbit polyclonal anti-Bax (1:1000; BD Biosciences), rabbit polyclonal anti-Puma (Ab-1; 1:500; EMD Biosciences), rabbit polyclonal anti–caspase-3 (1:1000; Cell Signaling Technologies), rabbit polyclonal anti–caspase-9 (1:1000; Cell Signaling Technologies), and mouse monoclonal anti–β-actin (AC-74;1:3000; Sigma Chemical). The membranes were washed 3 times with phosphate-buffered saline (PBS) containing 1% Tween-20, and probed with secondary antibody. Blots were reacted with enhanced chemiluminescence (ECL) reagent (Amersham Biosciences) and signals were detected by phosphoimager Storm 860 (Molecular Dynamics).
Quantitative Real Time PCR
OCI-AML3 cells treated with 5μM MI-63 over a time course were lysed in Trizol and total RNA was isolated using the phenol-chloroform method. First-strand cDNA synthesis was performed with oligo (dT) as primer. Real-time PCR was done using an ABI Prism 7700 instrument. As primer and probe sets to detect MDM4, p21 and MDM2 and housekeeping gene Abl-1, we used TaqMan Gene Expression Assays Hs00159092_m1 and Hs00245445_m1. The abundance of each transcript relative to that of Abl-1 was calculated as ΔCt where ΔCt is the mean Ct of the transcript of interest less the mean Ct of the transcript for Abl-1. The relative expression of MDM4 transcript in MI-63 treated cells was calculated as RE = 2 exp (−ΔΔCt) where ΔΔCt is ΔCtt-ΔCtc (ΔCtt is the ΔCt value for treated sample and ΔCtc is the ΔCt value for control cells). The results are expressed as fold-change with respect to control (which is normalized to 1). All PCR reactions were done in triplicate.
Statistical Analysis
The statistical analysis was performed using the 2-tailed Student t test and the Pearson correlation coefficient. Statistical significance was considered when P was less than .05. Unless otherwise indicated, average values were expressed as mean plus or minus the standard error of the mean (SEM). Synergism, additive effects, and antagonism were assessed using the Chou-Talalay method[22] and Calcusyn software (Biosoft, Ferguson, MO). The effect on cell viability was expressed as fraction of cells killed by the individual drugs or the combination in drug-treated versus untreated cells. The extent of apoptosis was quantified as percentage of annexin V–positive cells, and the extent of drug-specific apoptosis was assessed by the formula: % specific apoptosis = (test − control) × 100 / (100 − control). The dose-effect curve for each drug alone was determined based on the experimental observations using the median-effect principle; the combination index (CI) for each experimental combination was then calculated according to the following equation: CI = (D)1 / (Dx)1 + (D)2 / (Dx)2 + (D)1(D)2 /(Dx)1(Dx)2, where (D)1 and (D)2 are the doses of drug 1 and drug 2 that have x effect when used in combination and (Dx)1 and (Dx)2 are the doses of drug 1 and drug 2 that have the same x effect when used alone. The CI was calculated using the more stringent statistical assumption of mutually nonexclusive modes of action. The CI provides a numerical description of combination effects. When CI equals 1, this equation represents the conservation isobologram and indicates additive effects. CI values less than 1.0 indicate a more-than-expected additive effect (synergism), whereas CI values more than 1.0 indicate antagonism between the 2 drugs.
RESULTS
MI-63 Inhibits the Growth of AML Cell Lines by Inducing Apoptosis and G1 Arrest
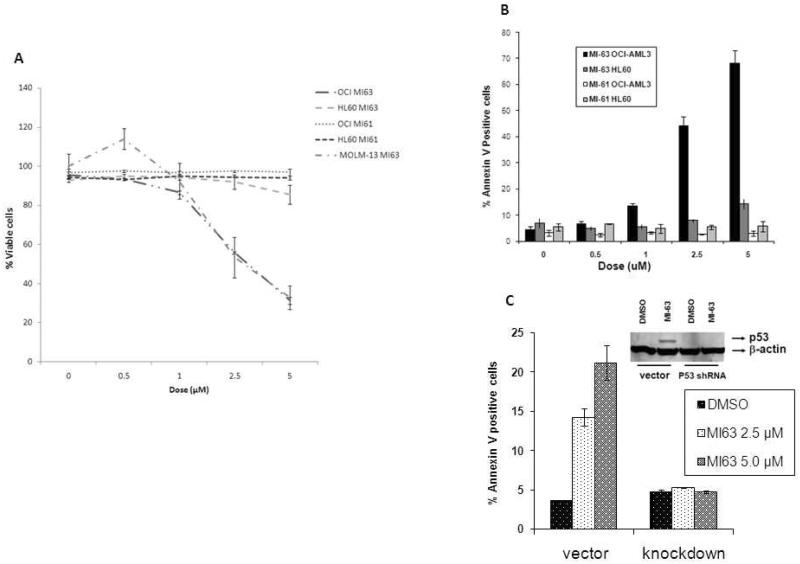
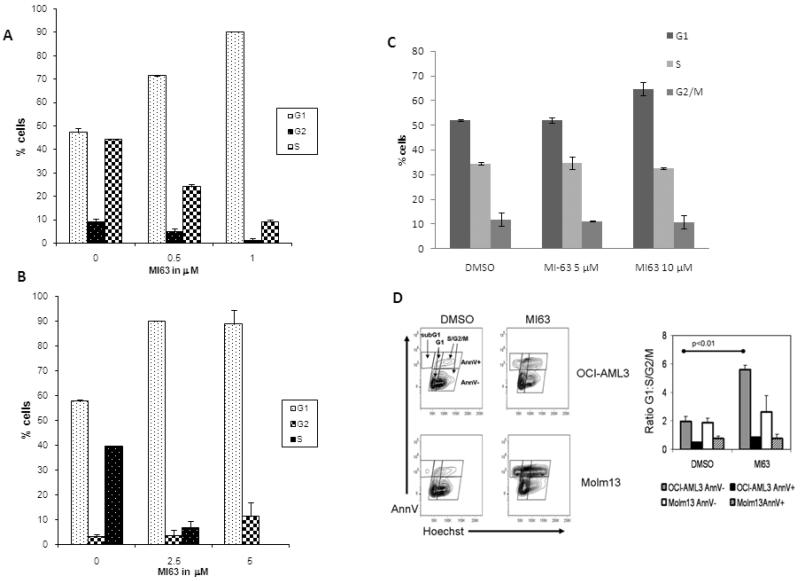
We first examined the effect of MI-63 and its inactive enantiomer MI61 on the growth and viability of cultured AML cell lines. The results demonstrate that MI-63 decreases the viability of OCI-AML3 and MOLM-13 (wild type p53) cells in a dose-dependent manner, whereas HL-60 cells (p53 −/−) were not affected (Figure 1A). Flow cytometric analysis revealed that the decreased viability was accompanied by AnnexinV binding suggesting that apoptosis contributes to the anti-proliferative effects of MI-63 (Figure 1B). In contrast, MI61 did not decrease the viability or activate apoptosis in OCI-AML3 or HL-60 cells (Figure 1A). OCI-AML3 cells that express a shRNA targeting p53 were resistant to the apoptotic effects of MI-63 (Figure 1C), suggesting that the observed cytotoxic effects depend on the expression of this tumor suppressor protein. Additional flow cytometric analysis of cell cycle distribution also revealed that MI-63 (48 hours at IC50 or lower dose) induced a pronounced accumulation of OCI-AML3 and MOLM-13 cells in the G1 phase of the cell cycle providing evidence that growth arrest cooperates with apoptosis induction to decrease the viability of cells treated with MI-63 (Figure 2A and B). On the other hand, MI-63 had no significant effect on cell cycle in HL 60 cells at a concentration of up to 10μM (Figure 2C). These results suggest that MI-63 stereospecifically causes growth arrest and apoptosis in cells with an intact p53 pathway. While both OCI-AML3 and MOLM-13 cell lines showed arrest in G1 phase, most of OCI-AML3 cells in G1 arrest did not undergo apoptosis (Figure 2D).
Figure 1.
MI-63 requires a functional p53 for its cytotoxic effect.
OCI-AML3, HL-60 and MOLM-13 cells were treated with varying range of concentration of MI-63 and/or its inactive enantiomer MI61 for 48 hrs. Viability was assessed by Trypan Blue exclusion (Figure 1A). Results are expressed as the percentage of the viable cell number in an untreated group, and represent the average of triplicate cultures. Apoptosis was measured by annexin V binding assay (Figure 1B). Treatment with MI-63 impaired viability and/or induced apoptosis in OCI-AML3, MOLM-13 but not in HL-60 cells. p53 was knocked down in OCI-AML3 cells by shRNA and apoptosis of these and control cells (untreated and vector transfected) after treatment with MI-63 was measured by annexin V binding (Figure 1C). Apoptotic effect of MI-63 was limited to OCI-AML3 cells with wild-type p53.
Figure 2.
MI-63 induces G1 cell cycle arrest.
MOLM-13 (A), OCI-AML3 (B) and HL-60 (C) cells were treated with MI-63 for 48 hours and stained for DNA content. Cell-cycle distribution was analyzed using ModFit LT software. Results are representative of 3 independent experiments. MI-63 induced cell cycle arrest in G1 phase in both OCI-AML3 and MOLM-13 cells but not in HL-60 cells. Larger proportion of OCI-AML3 cells arrested in G1phase remained negative for Annexin V binding at that time point (D).
Treatment with MI-63 Causes Induction of p53 target Proteins
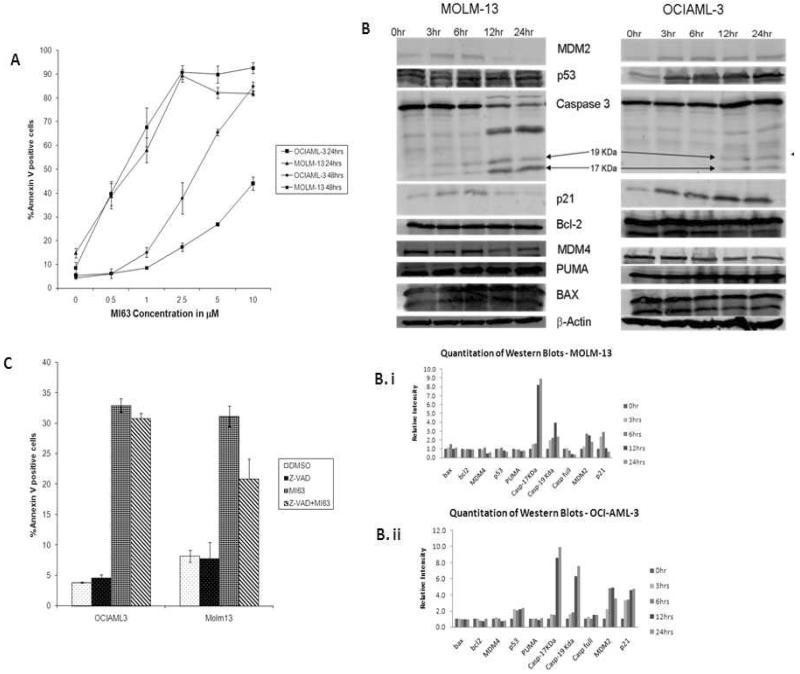
MI-63 induced apoptosis in both OCI-AML3 and MOLM-13 cells, albeit at a faster kinetic inMOLM-13 cells (Figure3A). Treatment of OCI-AML3 andMOLM-13 cells with MI-63 at their respective IC50 caused induction of MDM2 and p21 but the levels of Bcl-2, BAX and PUMA were unchanged (Figure 3B, 3B.i, 3B.ii). MI-63 caused robust induction of p21in OCI-AM3 as early as 3 hr whereas induction of p21 was less robust in MOLM-13 cells. Western blot analysis also revealed that in MOLM-13 cells caspase 3 was activated earlier, and to a greater extent than in OCI-AML3 cells after treatment with 5 μM MI-63 (Figure 3B). The pan-caspase inhibitor z-VAD-fmk partially rescued MOLM-13, but not OCI-AML3 cells from MI-63 induced phosphatidyl serine externalization (Figure 3C). These results suggest that though apoptosis induction by MI-63 is p53 dependent, cell context may determine kinetics and pathways involved.
Figure 3.
Kinetics of MI-63 effects vary among cell lines.
OCI-AML3 and MOLM-13 cells were treated with varying range of concentration of MI-63 for 24 and 48 hours and annexin V positive fraction was measured by flow cytometry (Figure 3A). Semi-quantitative Western blot analysis of apoptosis- and cell-cycle–associated proteins in OCI-AML3 and MOLM-13 cells, treated with MI-63 (at their respective IC50) for the indicated times were carried out (Figure 3B, 3Bi, 3Bii). MI-63 induced increases in MDM2, p53 and p21 in OCIAML-3 and MOLM-13, but Bcl-2, BAX and PUMA levels were not significantly altered. There was a time dependent decrease in MDM4 levels in both cell types. Significant caspase 3 activation (arrows indicate cleaved caspage) was observed in MOLM-13 cells but not in OCI-AML3 (Figure 3B). Z-VAD-fmk, a pancaspase inhibitor was able to partially rescue MOLM-13 cells from undergoing apoptosis, but did not have a significant effect on OCI-AML3 (Figure 3C).
MI-63 Decreases MDM4 Protein Expression
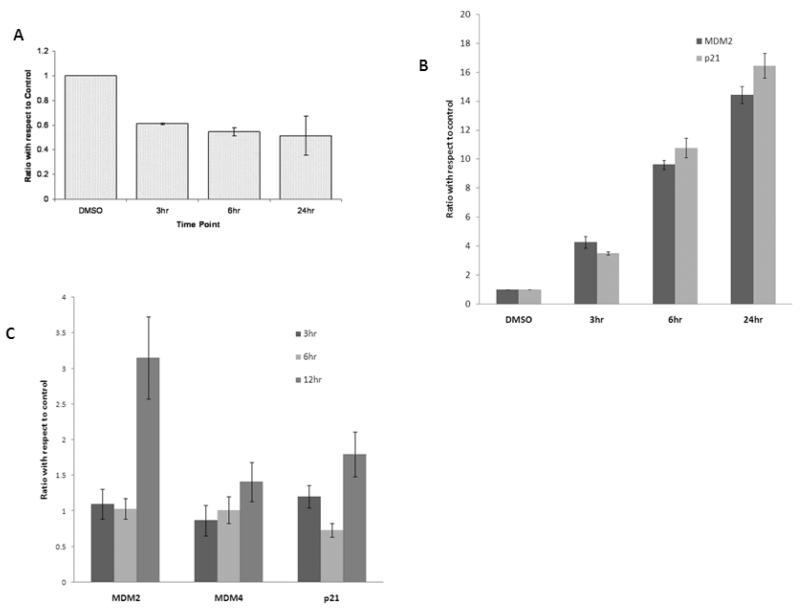
MI-63 treatment caused decrease in MDM4 levels in OCI-AML3 and MOLM-13 cells (Figure 3B). MI-63 caused a significant decrease in the levels of MDM4 mRNA in OCI-AML3 (Figure 4A) but not in MOLM-13 cells (Figure 4C). In contrast m-RNA levels of both MDM2 and p21, transcription targets of p53, increased in both OCI-AML3 and MOLM-13 cells after treatment with MI-63 (Figure 4B and 4C).
Figure 4.
Effect of MI-63 on MDM4 m-RNA and protein levels.
MDM4 m-RNA levels are reduced (Figure 4A) with MI-63 treatment in OCI-AML3 cells while MDM4 mRNA levels are unchanged in MOLM-13 cells (Fig.4C). p21 and MDM2 mRNA levels are increased in OCI-AML3 (Fig.4B) and MOLM-13 (Fig.4C) cell lines. OCI-AML3 and MOLM-13 cells were treated with MI-63 for indicated time periods and quantitative RT-PCR was performed. Results are expressed as a ratio of control.
MI-63 Synergizes with Chemotherapy to Induce Apoptosis in the Leukemia Stem Cell Compartment
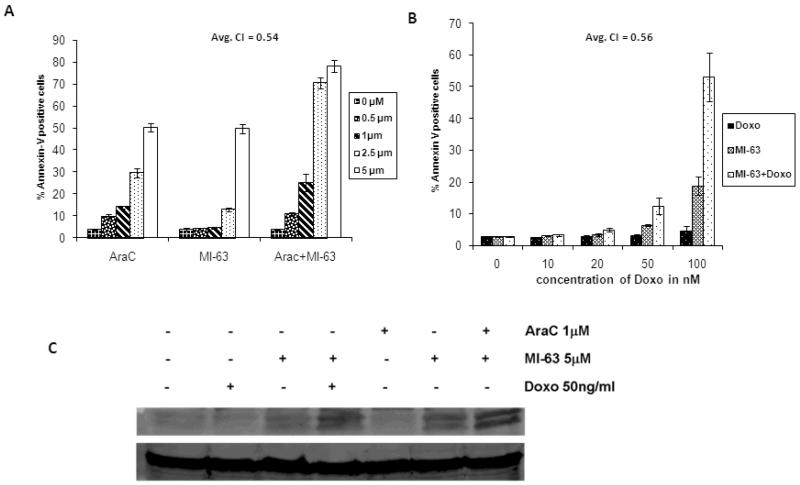
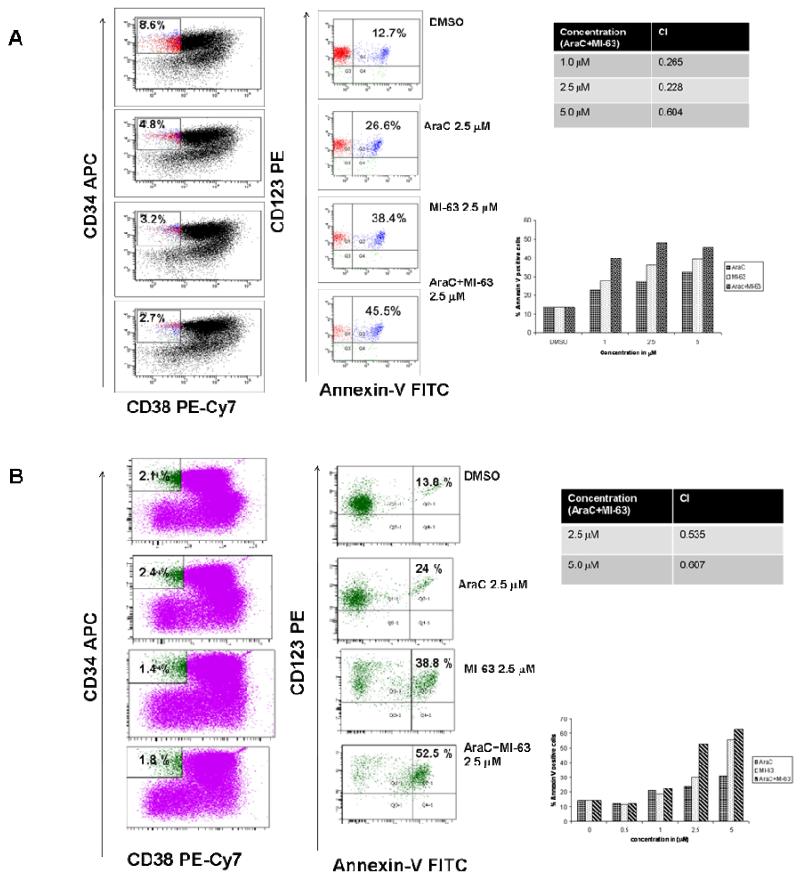
MI-63 synergizes with both Ara-C and Doxorubicin to induce apoptosis in OCI-AML3 cells (Figure 5A and 5B), and this effect was associated with increased p53 levels (Figure 5C). We treated PBMCs isolated from bone marrow or peripheral blood of 9 patients with AML (blast percentage >60%) with MI-63 at a concentration of 5 μM for 48 hours and the percent drug specific apoptosis in these primary samples ranged from 36.5 to 74.6 (median= 57.2). We then tested the potential synergy between MI-63 and front-line chemotherapeutic agents used in the treatment of AML, in primary samples from patients with AML, and in the AML `stem cell' (CD34+/CD38−/CD123+) compartment. These results demonstrate that MI-63 in combination with AraC synergistically induces apoptosis in total PBMC as well as in the CD34+/CD38−/CD123+ compartment of primary AML samples (Fig 6A and B), providing support for further clinical evaluation of MI-63 treatment.
Figure 5.
MI-63 synergizes the apoptotic effects of Cytosine Arabinoside (AraC) and Doxorubicin. OCI-AML3 cells were treated with indicated concentrations of AraC or MI-63 or combination for 48 hours (Figure 5A). Same range of MI-63 concentrations (0–5 μm) were used in the combination experiments with Doxorubicin (at indicated concentrations)(Fig.5B). MI-63 has synergy with Ara-C and Doxorubicin when administered in combination. Average combination indices (CI) are indicated (Fig.5A andB)
Addition of AraC and Doxorubicin to MI-63 further increases p53 protein levels compared to MI-63 alone in OCI-AML3 cells (Figure 5C).
Figure 6.
Annexin V positive fraction in leukemia progenitor cells (from patients with AML) treated with AraC and/or MI-63. Cells isolated from patients with AML, were treated with AraC and/or MI-63 at indicated concentrations and Annexin V positive fraction was estimated after 48 hours in CD34+CD38−CD123+ (stem cell) compartment (Figure 6A and B). Combination indices (CI) of MI-63 with AraC at the indicated concentrations were calculated.
DISCUSSION
Our report demonstrates that MI-63 is a potent activator of p53-dependent cytotoxicity in AML cell lines and AML samples. Disruption of p53-MDM2 interaction by MI-63 increases levels of p53 and its transcriptional targets including MDM2 and p21. This is accompanied by G1 cell cycle arrest and apoptosis induction. Treatment with MI-63 also caused a decrease in MDM4 protein levels. Nutlin, a MDM2 inhibitor, is also reported to reduce MDM4 protein levels in fibroblasts and transformed cells[23,24]. The mechanism for this is thought to be MDM2 mediated proteasomal degradation of MDM4[24,25]. Our report suggests that mechanism underlying the downregulation of MDM4 may also include reduced transcription. The path to apoptosis induction may again depend on cell context. While in OCI-AML3 cells MI-63 treatment caused robust cell cycle arrest, in MOLM-13 cells it induced early caspase activation. Both these early events eventually lead to apoptosis as evidenced by annexin V binding. Recent reports have linked the expression of p21, 14-3-3 sigma and mir-34a genes after treatment with Nutlin-3a to cellular fate of cell cycle arrest versus apoptosis[26].
Traditional chemotherapeutic agents used for treatment of AML are known to stabilize p53 and the synergy of MI-63 with these agents is mechanistically expected. The synergistic activity of the combination of MI-63 with chemotherapeutic agents at the level of the putative leukemia `stem/progenitor cell' in patient derived samples argue strongly towards testing such combinations in the clinical setting.
ACKNOWLEDGEMENTS
MI-63 and its inactive enantiomer MI-61 were kindly provided by: Ascenta Therapeutics 101 Lindenwood Drive, Suite 405 Malvern, PA 19355
References list
- 1.Vogelstein B, Lane D, Levine AJ. Surfing the p53 network. Nature. 2000;408:307–10. doi: 10.1038/35042675. [DOI] [PubMed] [Google Scholar]
- 2.Levine AJ. p53, the cellular gatekeeper for growth and division. Cell. 1997;88:323–31. doi: 10.1016/s0092-8674(00)81871-1. [DOI] [PubMed] [Google Scholar]
- 3.Momand J, Jung D, Wilczynski S, Niland J. The MDM2 gene amplification database. Nucleic Acids Res. 1998;26:3453–9. doi: 10.1093/nar/26.15.3453. [DOI] [PMC free article] [PubMed] [Google Scholar]
- 4.Pinyol M, Hernandez L, Martinez A, Cobo F, Hernandez S, Bea S, Lopez-Guillermo A, Nayach I, Palacin A, Nadal A, et al. INK4a/ARF locus alterations in human non-Hodgkin's lymphomas mainly occur in tumors with wild-type p53 gene. Am J Pathol. 2000;156:1987–96. doi: 10.1016/S0002-9440(10)65071-7. [DOI] [PMC free article] [PubMed] [Google Scholar]
- 5.Marine JC, Francoz S, Maetens M, Wahl G, Toledo F, Lozano G. Keeping p53 in check: essential and synergistic functions of Mdm2 and Mdm4. Cell Death Differ. 2006;13:927–34. doi: 10.1038/sj.cdd.4401912. [DOI] [PubMed] [Google Scholar]
- 6.Oliner JD, Kinzler KW, Meltzer PS, George DL, Vogelstein B. Amplification of a gene encoding a p53-associated protein in human sarcomas. Nature. 1992;358:80–3. doi: 10.1038/358080a0. [DOI] [PubMed] [Google Scholar]
- 7.Bond GL, Hu W, Bond EE, Robins H, Lutzker SG, Arva NC, Bargonetti J, Bartel F, Taubert H, Wuerl P, et al. A single nucleotide polymorphism in the MDM2 promoter attenuates the p53 tumor suppressor pathway and accelerates tumor formation in humans. Cell. 2004;119:591–602. doi: 10.1016/j.cell.2004.11.022. [DOI] [PubMed] [Google Scholar]
- 8.Kubbutat MH, Jones SN, Vousden KH. Regulation of p53 stability by Mdm2. Nature. 1997;387:299–303. doi: 10.1038/387299a0. [DOI] [PubMed] [Google Scholar]
- 9.Kubbutat MH, Ludwig RL, Levine AJ, Vousden KH. Analysis of the degradation function of Mdm2. Cell Growth Differ. 1999;10:87–92. [PubMed] [Google Scholar]
- 10.Nie L, Sasaki M, Maki CG. Regulation of p53 nuclear export through sequential changes in conformation and ubiquitination. J Biol Chem. 2007;282:14616–25. doi: 10.1074/jbc.M610515200. [DOI] [PubMed] [Google Scholar]
- 11.Wu X, Bayle JH, Olson D, Levine AJ. The p53-mdm-2 autoregulatory feedback loop. Genes Dev. 1993;7:1126–32. doi: 10.1101/gad.7.7a.1126. [DOI] [PubMed] [Google Scholar]
- 12.Herzog G, Lu-Hesselmann J, Zimmermann Y, Haferlach T, Hiddemann W, Dreyling M. Microsatellite instability and p53 mutations are characteristic of subgroups of acute myeloid leukemia but independent events. Haematologica. 2005;90:693–5. [PubMed] [Google Scholar]
- 13.Faderl S, Kantarjian HM, Estey E, Manshouri T, Chan CY, Rahman Elsaied A, Kornblau SM, Cortes J, Thomas DA, Pierce S, et al. The prognostic significance of p16(INK4a)/p14(ARF) locus deletion and MDM-2 protein expression in adult acute myelogenous leukemia. Cancer. 2000;89:1976–82. doi: 10.1002/1097-0142(20001101)89:9<1976::aid-cncr14>3.3.co;2-e. [DOI] [PubMed] [Google Scholar]
- 14.Bueso-Ramos CE, Manshouri T, Haidar MA, Huh YO, Keating MJ, Albitar M. Multiple patterns of MDM-2 deregulation in human leukemias: implications in leukemogenesis and prognosis. Leuk Lymphoma. 1995;17:13–8. doi: 10.3109/10428199509051698. [DOI] [PubMed] [Google Scholar]
- 15.Bueso-Ramos CE, Yang Y, deLeon E, McCown P, Stass SA, Albitar M. The human MDM-2 oncogene is overexpressed in leukemias. Blood. 1993;82:2617–23. [PubMed] [Google Scholar]
- 16.Kojima K, Konopleva M, McQueen T, O'Brien S, Plunkett W, Andreeff M. Mdm2 inhibitor Nutlin-3a induces p53-mediated apoptosis by transcription-dependent and transcription-independent mechanisms and may overcome Atm-mediated resistance to fludarabine in chronic lymphocytic leukemia. Blood. 2006;108:993–1000. doi: 10.1182/blood-2005-12-5148. [DOI] [PMC free article] [PubMed] [Google Scholar]
- 17.Kojima K, Konopleva M, Samudio IJ, Shikami M, Cabreira-Hansen M, McQueen T, Ruvolo V, Tsao T, Zeng Z, Vassilev LT, et al. MDM2 antagonists induce p53-dependent apoptosis in AML: implications for leukemia therapy. Blood. 2005;106:3150–9. doi: 10.1182/blood-2005-02-0553. [DOI] [PMC free article] [PubMed] [Google Scholar]
- 18.Saddler C, Ouillette P, Kujawski L, Shangary S, Talpaz M, Kaminski M, Erba H, Shedden K, Wang S, Malek SN. Comprehensive biomarker and genomic analysis identifies p53 status as the major determinant of response to MDM2 inhibitors in chronic lymphocytic leukemia. Blood. 2008;111:1584–93. doi: 10.1182/blood-2007-09-112698. [DOI] [PubMed] [Google Scholar]
- 19.Shangary S, Ding K, Qiu S, Nikolovska-Coleska Z, Bauer JA, Liu M, Wang G, Lu Y, McEachern D, Bernard D, et al. Reactivation of p53 by a specific MDM2 antagonist (MI-43) leads to p21-mediated cell cycle arrest and selective cell death in colon cancer. Mol Cancer Ther. 2008;7:1533–42. doi: 10.1158/1535-7163.MCT-08-0140. [DOI] [PMC free article] [PubMed] [Google Scholar]
- 20.Ding K, Lu Y, Nikolovska-Coleska Z, Wang G, Qiu S, Shangary S, Gao W, Qin D, Stuckey J, Krajewski K, et al. Structure-based design of spiro-oxindoles as potent, specific small-molecule inhibitors of the MDM2-p53 interaction. J Med Chem. 2006;49:3432–5. doi: 10.1021/jm051122a. [DOI] [PubMed] [Google Scholar]
- 21.Rasola A, Geuna M. A flow cytometry assay simultaneously detects independent apoptotic parameters. Cytometry. 2001;45:151–7. doi: 10.1002/1097-0320(20011001)45:2<151::aid-cyto1157>3.0.co;2-i. [DOI] [PubMed] [Google Scholar]
- 22.Chou TC, Talalay P. Quantitative analysis of dose-effect relationships: the combined effects of multiple drugs or enzyme inhibitors. Adv Enzyme Regul. 1984;22:27–55. doi: 10.1016/0065-2571(84)90007-4. [DOI] [PubMed] [Google Scholar]
- 23.Patton JT, Mayo LD, Singhi AD, Gudkov AV, Stark GR, Jackson MW. Levels of HdmX expression dictate the sensitivity of normal and transformed cells to Nutlin-3. Cancer Res. 2006;66:3169–76. doi: 10.1158/0008-5472.CAN-05-3832. [DOI] [PubMed] [Google Scholar]
- 24.Xia M, Knezevic D, Tovar C, Huang B, Heimbrook DC, Vassilev LT. Elevated MDM2 boosts the apoptotic activity of p53-MDM2 binding inhibitors by facilitating MDMX degradation. Cell Cycle. 2008;7:1604–12. doi: 10.4161/cc.7.11.5929. [DOI] [PubMed] [Google Scholar]
- 25.Shangary S, Qin D, McEachern D, Liu M, Miller RS, Qiu S, Nikolovska-Coleska Z, Ding K, Wang G, Chen J, et al. Temporal activation of p53 by a specific MDM2 inhibitor is selectively toxic to tumors and leads to complete tumor growth inhibition. Proc Natl Acad Sci U S A. 2008;105:3933–8. doi: 10.1073/pnas.0708917105. [DOI] [PMC free article] [PubMed] [Google Scholar]
- 26.Paris R, Henry RE, Stephens SJ, McBryde M, Espinosa JM. Multiple p53-independent gene silencing mechanisms define the cellular response to p53 activation. Cell Cycle. 2008;7:2427–33. doi: 10.4161/cc.6420. [DOI] [PMC free article] [PubMed] [Google Scholar]


