Abstract
New vibration pulses are developed for shear wave generation in a tissue region with preferred spectral distributions for ultrasound vibrometry applications. The primary objective of this work is to increase the frequency range of detectable harmonics of the shear wave. The secondary objective is to reduce the required peak intensity of transmitted pulses that induce the vibrations and shear waves. Unlike the periodic binary vibration pulses, the new vibration pulses have multiple pulses in one fundamental period of the vibration. The pulses are generated from an orthogonal-frequency wave composed of several sinusoidal signals of which the amplitudes increase with frequency to compensate for higher loss at higher frequency in tissues. The new method has been evaluated by studying the shear wave propagation in in vitro chicken and swine liver. The experimental results show that the new vibration pulses significantly increase tissue vibration with a reduced peak ultrasound intensity, compared with the binary vibration pulses.
Keywords: Shear wave, ultrasound vibrometry, harmonic motion, elasticity, viscosity, viscoelasticity, SDUV, ultrasound radiation force, pulse echo ultrasound, orthogonal frequency
I. Introduction
Noninvasive and quantitative measurements of tissue shear moduli have received great attentions in recent years because the shear moduli vary by several orders of magnitude for various biological tissues [1]. Shearwave Dispersion Ultrasound Vibrometry (SDUV) has been developed to noninvasively and quantitatively measure tissue shear moduli [2–5]. The basic idea of the SDUV method is to numerically solve for material properties from measured shear wave phase velocities at several frequencies, based on a solution of the wave equation for the shear wave in isotropic and viscoelastic medium using the Voigt dispersion model [6]:
| (1) |
where v(ω) is the shear wave phase velocity at angular frequency ω, μ1 and μ2 are the shear elasticity and shear viscosity of the medium, respectively, and ρ is the density of the medium.
SDUV induces shear waves using ultrasound radiation force [7–9] and estimates the shear moduli using shear wave phase velocities at several frequencies by measuring the phase shifts of the propagating shear wave over a short distance using pulse echo ultrasound [4,5,10–13]. Applications of SDUV were conducted for characterizing the viscoelasticity of liver [3, 14], bovine and porcine striated muscle [15, 16], blood vessels [11, 17–20], heart [21], prostate [22], and kidney [23]. A recent in vivo liver study shows that the SDUV can be implemented on a clinical ultrasound scanner of using an array transducer [24]. Many studies of ultrasound vibrometry are reviewed in an article by Urban, et al [25].
As shown in Fig. 1, SDUV applies periodic binary vibration pulses to induce shear waves in a tissue region and transmits multiple detection pulses between the vibration pulses to detect the induced vibration. The induced shear wave includes the fundamental frequency of the periodic pulses, fv, and its harmonics, nfv. The binary vibration pulses and detection pulses can be interleaved and transmitted by an array transducer.
Fig. 1.
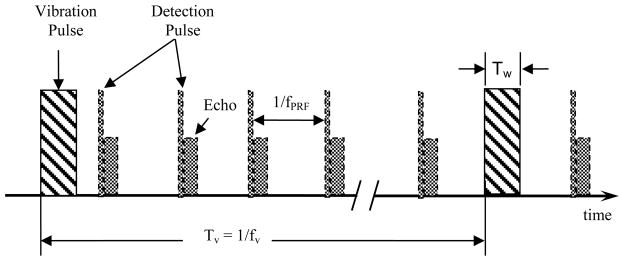
Binary vibration pulses and detection pulses for SDUV. fv is pulse repetition frequency (PRF) of vibration pulses, fPRF is the PRF of detection pulses, Tw is the pulse width of the vibration pulses. The vibration pulse and detection pulses are interleaved in time.
As shown in Fig. 2, while the vibration beam applies ultrasound radiation force at one location, the detection pulses are transmitted to several other locations in a tissue region to measure the phase shifts of shear wave along a short distance Δd [2, 4, 5, 10]. The phases of several harmonics are estimated at several locations and the phase velocity of each harmonic is calculated with the estimated phase shift Δϕ over a distance Δd [10]:
| (2) |
Fig. 2.
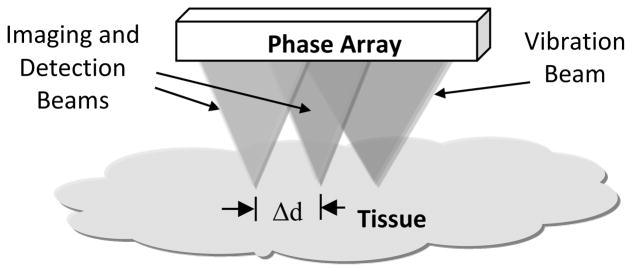
A general diagram to show the foci of vibration and detection beams using an array transducer. The phase shifts of harmonics over a distance Δd are used to determine phase velocities.
As shown in the previous reports, curve fitting has been used for estimating the shear elasticity, μ1, and shear viscosity, μ2 [10]. In those reports, phase velocity v(ω) of four harmonics from 100 Hz to 400 Hz were calculated based on the measured phase shift Δϕ of each harmonic of the induced shear wave. Then, curve fitting was used to estimate elasticity μ1 and viscosity μ2 using the four velocities and equation (1).
Shear wave velocities at higher frequencies are important for robustly estimating μ1 and μ2. However, the amplitude of the shear wave decreases as the frequency increases. The attenuation coefficient of the shear wave in isotropic and viscoelastic medium modeled by the Voigt dispersion model is [6, 26]:
| (3) |
The equation indicates that the amplitude of the shear wave decreases as frequency increases at a rate of e−α(ω)d [6], where d is the distance from the center of the radiation force application to the measurement location.
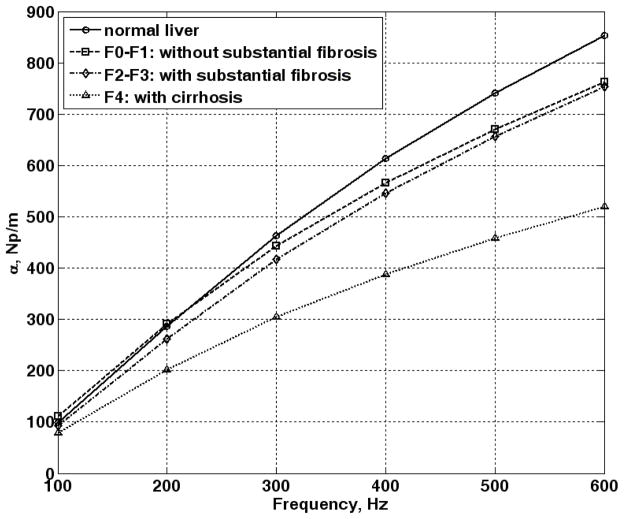
As an example of the attenuation, Fig. 3 shows the shear wave attenuation coefficients using μ1 and μ2 values of livers at different stages of fibrosis [27]. The figure shows that the attenuation coefficient of cirrhotic liver is substantially different from livers without cirrhosis at higher frequencies. The figure is generated by using equation (3) with μ1 and μ2 values reported in [27]. The μ1 values were 2.06, 2.24, 2.56, and 4.68 kPa for livers of normal healthy volunteers, patients without substantial fibrosis (F0–F1), patients with substantial fibrosis (F2–F3), and patients with cirrhosis (F4), respectively. The μ2 values were 1.72, 2.39, 2.27, and 5.19 Pa·s for normal, F0–F1, F2–F3, and F4, respectively. The density was assumed to be 1000 kg/m3. Note that the attenuation coefficients at 600 Hz are about 6.5 to 8.5 times higher than those at 100 Hz. Using the attenuation coefficient for cirrhotic livers, shear waves would be attenuated by 32.6% and 92.6% over a distance of 5mm at 100 Hz and 600 Hz, respectively. Using the attenuation coefficients of the normal livers, shear waves would be attenuated by 38.9% and 98.6% over a distance of 5 mm at 100 Hz and 600 Hz, respectively.
Fig. 3.
Attenuation coefficient of liver in different stages of fibrosis increases with frequency
The substantial attenuation makes it difficult to obtain reliable data at higher frequencies as the distance increases for the binary vibration pulses. The powers of the harmonics of the binary vibration pulses monotonically decrease as the harmonic frequency increases, while the higher frequency shear waves suffer larger attenuation in propagation. On the other hand, the amplitude of the vibration pulse is limited by FDA regulatory limits for diagnostic ultrasound and the duration Tw of the vibration pulse is limited by the fPRF of the detection pulses unless a special treatment is applied for nonuniform sampling [13]. Three main weaknesses of the binary vibration pulses are that: 1) the vibration power is limited by limited peak pulse amplitude and pulse width, 2) the vibration powers of higher harmonics of interest are low compared to the total vibration power, and 3) the vibration power slowly decreases as frequency increases, including those beyond the Nyquist rate. The primary goal of this work is to develop new vibration pulses to increase the vibration intensity of interested harmonics with limited pulse amplitude and pulse durations.
II. Method
A method is developed to increase the power of the ultrasound radiation force at higher harmonics with a given peak amplitude. The method transmits multiple pulses in one fundamental vibration period Tv, while the method using the binary vibration pulse only transmits one vibration pulse in period Tv. The multiple pulses are selected according to a preferred spectral distribution using the approach introduced below.
Multiple pulses in one vibration period are composed by sparsely sampling an Orthogonal Frequency Ultrasound Vibration (OFUV) wave that is a summation of several sinusoidal signals that are orthogonal to each other:
| (4) |
where G(t/T) is a gate function that has a unit value with a time duration of T and is zero outside of the T. The period T is selected so that the length of each sinusoidal signal is a multiple integer of period Tv, fv=1/Tv is the lowest frequency or fundamental frequency, and An and θn are the amplitude and phase associated with the nth orthogonal frequency component. The value of An increases as n increases to compensate higher loss at higher frequency in the tissues.
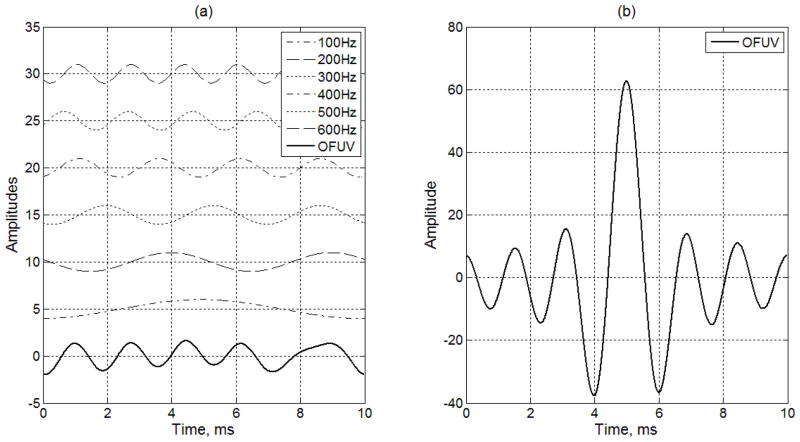
In the example shown in Fig. 4(a), the signal for orthogonal frequency ultrasound vibration (OFUV) is an weighted addition of one period of a 100 Hz sinusoidal signal, two periods of a 200 Hz sinusoidal signal, three periods of a 300 Hz sinusoidal signal, four periods of a 400 Hz sinusoidal signal, five periods of a 500 Hz sinusoidal signal, and six periods of a 600 Hz sinusoidal signal. The bottom plot of Fig. 4(a) shows the generated OFUV wave, which is a sum of the weighted sinusoidal signals with An = 1, fn = 100n Hz and T=10 ms. In Fig. 4(a), all six harmonics have the same amplitudes with zero DC values, they are displayed in one plot to illustrate the generation of the OFUV wave.
Fig. 4.
(a) Example of constructing an orthogonal frequency ultrasound vibration signal composed of frequency components at 100, 200, 300, 400, 500 and 600 Hz. Each of the vibration signals are offset for visualization purposes. The OFUV wave shown in the bottom is a sum of six harmonics shown in top six plots. (b) Another OFUV signal using alternating (π, 0) phases for different harmonics.
The orthogonality is achieved by ensuring that the length of each sinusoidal signal is a multiple integer of its period. The selection of the orthogonal frequencies is flexible but all harmonics are multiple integers of the fundamental frequency. In this work, the fundamental frequency is 100 Hz that gives a reasonable frequency range of the harmonics and is a good number for the interleaving scheme shown in Fig. 1 if the pulse repetition frequency of detection pulses is 2 kHz or 4 kHz.
In our application, the amplitude of harmonics increases as the frequency increases and the variations between harmonic amplitudes depend on the shape of a desired spectral distribution. An = n is used for figures 4(b) and 5 to illustrate the concept of enhancing the high harmonics using the graphic display. An = n2 was used in our experiments to increase the portion of the higher harmonics in the transmitted power.
The phase of each sinusoidal wave can be adjusted to obtain different shapes of the OFUV waves. A large number of random phases were randomly generated in a selection process that selects an OFUV wave for a desired dynamic range, which is a ratio between a peak value and a standard deviation. In Fig. 4(a), the phases of the six sinusoidal waves are 183°, 74°, 148°, −161°, −116°, and 130°, respectively. Those phases are chosen so that the dynamic range is relatively small. If the phases of the orthogonal frequencies are changed to π, 0, π, 0, π, and 0 and the amplitude of each harmonic linearly increases as the frequency increases, we obtain the wave shown in Fig. 4(b). Note that the OFUV wave in Fig. 4(b) has a dynamic range higher than that in Fig. 4(a), which may be useful to produce vibrations with a large dynamic range. On the other hand, to transmit the same total power, the OFUV wave in Fig. 4(a) requires a peak amplitude lower than that in Fig. 4(b), which may be useful when the peak intensity of ultrasound is required to stay below the FDA regulatory limits.
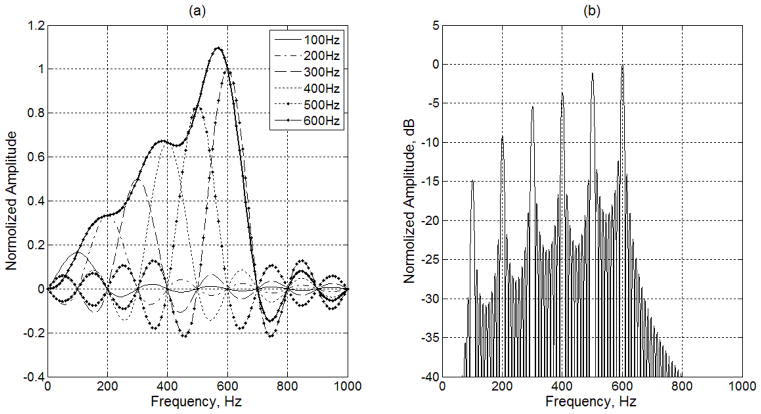
The shortest duration of the OFUV wave is one period of Tv, as shown in Fig. 4. The OFUV wave used in our experiment has ten periods to increase the resolution of the harmonics. The spectral distributions of six harmonics and the final OFUV signal in Fig. 4(b) are shown Fig. 5(a). Note that the interference from other harmonics is zero at the center of each harmonic, which show the orthogonal property of the signal, and the amplitude of the higher harmonics increases with its frequency (n=1 for 100 Hz, n=2 for 200 Hz, etc). The frequency components of OFUV signal (dot solid line in Fig. 5(a)) are highly concentrated from 100 Hz to 600 Hz which are the frequency range of interest in this example.
Fig. 5.
Spectral distributions of OFUV signals. (a) Spectral distributions of six harmonics and the OFUV signal having one period is shown on the left. (b) The spectral distributions of OFUV having ten periods are shown on the right.
The OFUV wave having a long-time duration is used to achieve steady vibration and improve the spectral distribution. If we extend the OFUV wave by repeating the signal in Fig. 4(b) ten consecutive times (T=100 ms), we obtain the spectral distribution shown in Fig. 5(b). As was expected, the frequency resolution of Fourier transform is increased as the periods of the OFUV signal increases. As shown in Fig. 5(b), the power of this vibration signal is highly concentrated in a few harmonics of interest, with increased power in the higher frequencies.
The OFUV RF signal is obtained by modulating the baseband OFUV signal with large-carrier amplitude modulation (LC-AM):
| (5) |
where Am is a constant so that the quantity Am + OFUV(t) is positive for all t, ωc is the angular RF frequency of an ultrasound transducer. It is important to note that the ultrasound radiation force is proportional to ultrasound intensity or the square of the pressure [6]. Thus, if the spectral distribution shown in Fig. 5(b) is the desired spectral distribution of the ultrasound intensity, the square root must be applied to the sum of Am and the OFUV signal in Fig. 4(b) to prepare the RF signal that is applied to the transducer.
Due to the viscoelastic property of tissues, the dynamic range of induced vibration would be small using the continuous OFUV signal, because a recovery time is needed to allow a large dynamic response to the temporal changes of the excitation. Thus, the OFUV signal is sparsely sampled and the sample amplitudes are converted to the Pulse-Width Modulation (PWM) pulses. The separations between the samples allow tissue motion to be recovered before the next excitation pulse. The PWM uses pulse widths to represent the sample values, while Pulse Amplitude Modulation (PAM) uses pulse amplitudes to represent the sample values. PWM pulses have the same amplitude and different width, while the PAM pulses have the same width and different amplitude, as defined in a communication textbook [30]. The OFUV signal can be sparsely sampled and quantized as either PAM or PWM pulses. The PWM is easy for the implementation because all PWM pulses have the same amplitude.
The procedure of sparsely sampling to obtain the PWM pulses consists of:
The OFUV signal (used in our experiment I) is generated from (4).
Determine how many samples per period. In Fig. 6(e), there are seven pulses per period for OFUV pulses and one pulse per period for the binary pulses.
Sample wave (Fig. 6(c)) at different locations with a predefined pulse number and examine the spectral distribution of the samples. The process can be automated using a computer program that searches for a desirable spectral distribution. During the search, the sample positions are selected to avoid interference with detection pulses. The samples obtained in above steps are PAM pulses.
Convert the amplitudes of above PAM pulses to pulse widths. The results are PWM pulses or OFUV_PWM in this work. The starting location of a PWM pulse is the same as the location of the PAM pulses. The pulse width in Fig. 6(e) is proportional to the amplitude of the wave in Fig. 6(c) at the sample positions.
Fig. 6.
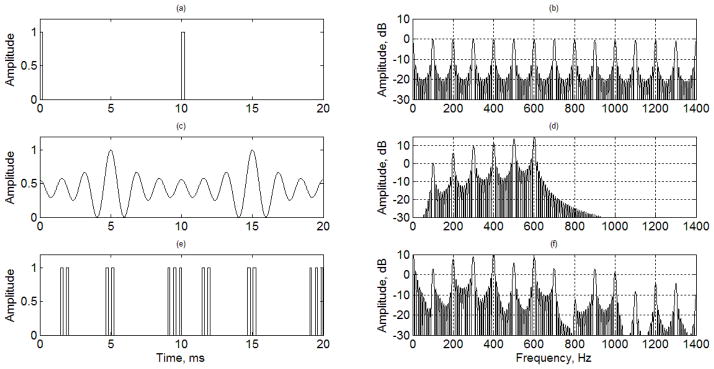
Examples of vibration pulses and their spectral distributions. (a) Binary vibration pulses of two periods, (b) spectral distribution of binary pulses of ten periods, (c) OFUV signal of two periods, (d) spectral distribution of OFUV signal of ten periods, (e) OFUV-PWM vibration pulses of two periods, (f) spectral distribution of OFUV-PWM pulses of ten periods.
The maximum width of the OFUV-PWM pulses is predetermined to control the total transmitted energy and also limited by the fPRF of the detection pulses so that the vibration pulses and detection pulses can be interleaved using an array transducer.
Only two periods of the signals are shown in the left plots of Fig. 6. The OFUV signal shown in Fig. 6(c) is generated from (4) with N = 6, fv = 100Hz, An= n2 and θn={π, 0, π, 0, π, 0}. It is sampled and converted to the PWM pulses shown in Fig. 6(e). There are also some minor adjustments of amplitudes and positions for the OFUV-PWM pulses shown in the Fig. 6(e) to meet the requirement of the interleaving scheme with the detection pulses and a preferred spectral distribution.
The spectral distributions of the vibration waves and pulses with ten periods are shown on the right of Fig. 6. They are obtained by taking Fourier transforms of binary pulses shown in Fig. 6(a), OFUV wave shown in Fig. 6(c), and the OFUV-PWM pulses shown in Fig. 6(e) with ten periods, respectively. As shown in figures 6(d) and 6(f), the powers of the OFUV wave and the OFUV-PWM vibration pulses are highly concentrated in the first six harmonics, which are the harmonics of interest for our SDUV applications, while the power of the binary pulses is almost uniformly distributed to all harmonics shown in Fig. 6(b) and significantly large beyond the Nyquist rate if the PRF is 2 kHz. This indicates that the OFUV pulses are more efficient than that of the binary pulse in term of inducing the interested vibration harmonics with limited radiation force intensity.
III. Experiments and Results
Two in vitro experiments were conducted to validate the method. In the first experiment, the maximum amplitudes of binary pulses and OFUV-PWM pulses were the same. In the second experiment, the total energies of the binary pulses and OFUV-PWM pulses were the same so that the amplitudes of the OFUV pulses were lower than that of the binary pulses. In the second experiment, the elasticity and viscosity of the tissue were estimated for different methods using more advanced devices.
A. Experiment 1
In the first experiment, the binary vibration pulses and OFUV-PWM pulses shown in Fig. 6(e) were applied to chicken liver tissue immersed in a water tank. Each vibration sequence consisted of 10 periods. Each period was 10 ms so that the fundamental frequency was 100 Hz and each pulse had a width of 0.2 ms or less. The OFUV pulses were modulated with a RF frequency of 3.37 MHz to induce vibrations in the tissue region. The detection transducer having a center frequency of 7.5 MHz was driven by broadband detection pulses. The detecting pulses had a PRF of 2.5 kHz and the echoes were sampled at 125 MHz with 14-bit resolution. The peak amplitude of the applied signals was the same for both binary and OFUV-PWM vibration pulses.
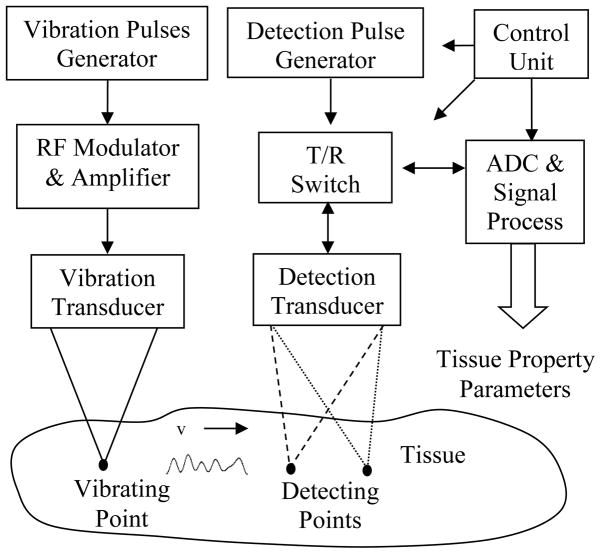
The block diagram of the experiment system at St. Cloud State University used for this experiment is shown in Fig. 7. The system was similar to the set up described in our previous studies [3, 9, 12], except the vibration pulses were different. Both vibration and detection transducers were single element transducers. The vibration transducer had a diameter of 1.75″ with a focus at 2.75″ (CTS Valpey Corporation, Hopkinton, MA, USA) and the detection transducer had a diameter of 0.5” and focus at 2” (Olympus, 48 Woerd Avenue Waltham, MA, USA). Initially, both transducers were focused at the same location and there was a small angle of 15 degrees between two beam axes [5]. The angle was included to estimate the shear speeds [5]. A motion control device was used to move the detection transducer away from the center of the radiation force application and measurements were taken at various positions with the repeated vibration pulses for each measurement. The tissue vibrations over a small distance were estimated by processing the sampled echoes [4, 5]. The displacements of the vibrations were estimated using the method described in [4] and the velocities of the vibration were estimated using the method described in [5]. Note that the velocity of the vibration is perpendicular to the shear wave velocity.
Fig. 7.
Block diagram of experiment system.
Three plots on the left side of Fig. 8 shows the displacements and spectral distributions of the vibration induced by the binary pulses at 1 mm away from the center where the radiation force applied. As shown in Fig. 8(a), the maximum displacement is about 2 μm. As shown in Fig. 8(b), the peak amplitudes of the displacement gradually decrease in frequency. Note that the amplitude at 500 Hz is about 10 dB less than that at 100 Hz, which may illustrate the reason that the most SDUV applications were limited to 400 Hz in previous reports. As shown in Fig. 8(c), the spectral amplitudes of the vibration velocity are about the same for all harmonics, which may be problematic because the harmonics near PRF/2 Hz are significantly high compared to those in the lower frequencies. It is anticipated that spectral components of the velocity beyond RPF/2 Hz are significant. If the velocity components are used for the phase shift estimation [5], the aliasing will be severe.
Fig. 8.
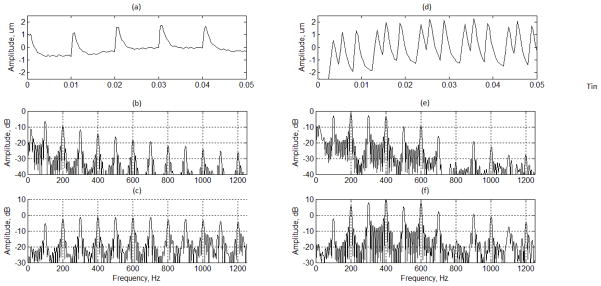
Vibration induced by the binary pulses. (a) and (d) shows the displacements of the detected motions induced by binary pulses and OFUV-PWD pulses, respectively. The label of x axis is the sample number which represents 100 ms. (b) and (e) shows the spectral distributions of the detected displacements. (c) and (f) shows the spectral distributions of the detected motion velocity.
Three plots on the right side of Fig. 8 show the displacements and spectral distributions of the vibration induced by the OFUV pulses at 1 mm away from the center where the radiation force applied. As shown in Fig. 8(d), the maximum displacement is about 4 μm. As shown in Fig. 8(e), the peak amplitudes of the displacement gradually decrease in frequency. Note that the amplitudes from 200 Hz to 600 Hz of Fig. 8(e) are about 10 dB higher those of the same frequencies in Fig. 8(b). As shown in Fig. 8(f), the spectral amplitudes of the vibration velocity near PRF/2 Hz are much lower than those in the lower frequencies. It is anticipated that spectral components of the velocity beyond RPF/2 Hz are not significant compared with the six harmonics of interest.
Note that the spectrum of the detected vibration velocity shown in Fig. 8(f) is remarkably similar to the theoretical spectrum of OFUV-PWM pulses shown in Fig. 6(f). It shows that the vibration velocity is directly proportional to the radiation force or the vibration pulses. While the discussion of this cause is beyond this work, we think it may be caused by the viscosity that becomes more prominent at the higher frequency, as the OFUV pulses increase high frequency harmonics to show the derivative relationship between the strain and stress in the tissue model.
The amplitude of 600 Hz of Fig. 8(e) is about the same as that of 200 Hz of Fig. 8(b). It is anticipated that all six harmonics of the vibration induced by the OFUV pulses can be used in the phase velocity estimations for viscoelasticity estimation. If these velocity components induced by the OFUV pulses are used for the phase shift estimation [5], the aliasing is relatively smaller than that of the binary pulses.
B. Experiment 2
In the experiment describe above, the peak excitation amplitudes of the binary pulses and the OFUV pulses were the same, and the OFUV method used a higher vibration energy than that of the binary pulses [28, 29]. In this experiment, we adjusted the amplitudes of different vibration sequences so that the total transmitted energies are the same but the amplitudes of OFUV pulses are lower than that of the binary pulses to illustrate the usefulness and effectiveness of the OFUV method. The second objective is to compare the viscoelasticity estimates using the two different methods.
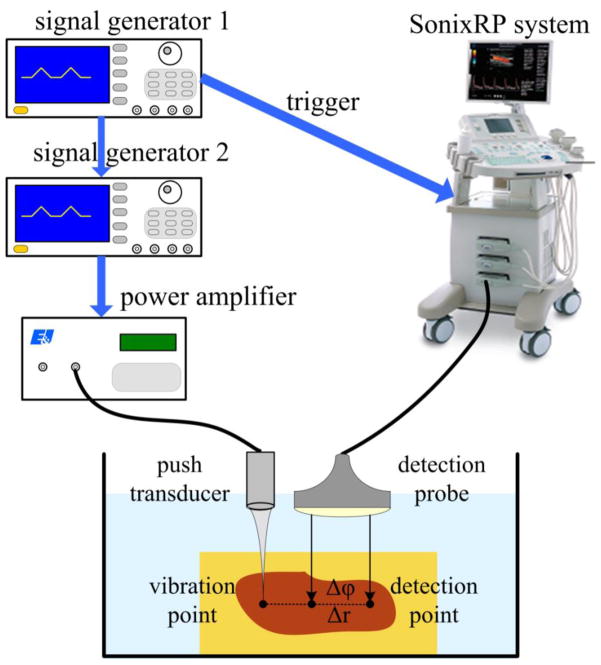
The experiment system shown in Fig. 9 was used for this experiment at Shenzhen University. This system primarily consisted of an excitation unit and a SonixRP system (Ultrasonix Medical Corp., Richmond, BC, Canada) for detection. Two arbitrary signal generators (Tektronix AFG3102) were utilized to generate the system timing and excitation waveform for inducing tissue vibration. The excitation wave modulated at 1 MHz was amplified by a power amplifier (A150; Electronics & Innovation Ltd., Rochester, NY, USA) that drove the excitation transducer. The SonixRP system was used to detect the vibrations using a linear array probe (L14–5W; Ultrasonix Medical Corp.). The linear array probe had 128 elements and bandwidth of 65%. The central frequency of the linear array probe was 5 MHz and the sampling frequency of the SonixRP was 40 MHz with a PRF of 2 kHz. The excitation transducer and detection probe were fixed on multi-degree adjustable brackets and were controlled by 3-axis motion stages. The excitation transducer was placed near the depth-lateral plane of the detection probe with a distance of about 2 cm between their edges. They were aligned confocally with a pulse-echo technique using a small sphere as a point target. The swine liver was embedded in gel phantom and placed in a water tank. The liver had an average thickness of about 4.5 cm with a size of about 10 cm × 6 cm. The vibration and detection were in a relatively uniform region that was 9 mm in depth from the surface of the phantom.
Fig. 9.
Experiment system for OFUV applications. Signal generator I produces trigger signals to synchronize the vibration pulses and detection pulses. Signal generator II produces the modulated vibration pulses amplified and applied to the vibration transducer.
The vibration sequences used in this experiment include the binary pulses and OFUV-PWM pulses. The OFUV-PWM pulses were designed to include nine harmonics, which were different from the pulses used in Experiment I. Each sequence has ten periods with a time period of 10 ms. The amplitudes of the OFUV were reduced so that the total vibration energy (A2Tp/2) was the same for both binary pulses and OFUV pulses, while A is the amplitude and Tp is the total pulse width. The vibration pulses sequences generated by the signal generator were:
Binary pulse sequence having one pulse per period with a pulse width of 100 μs and amplitude of 600 mV. The binary pulse and its spectrum are shown in Fig. 10(a) and Fig. 10(b), respectively.
OFUV_PWM pulses sequence having six pulses per period with a total pulse width of 532 μs (95+76+66+95+100+100 =532) and amplitudes of 260 mV. The original OFUV wave of two periods was constructed with nine harmonics from 100 to 900 Hz with An=n2. The OFUV_PWM pulses are shown in Fig. 10(c) and its spectral distribution is shown in Fig. 10(d).
Fig. 10.
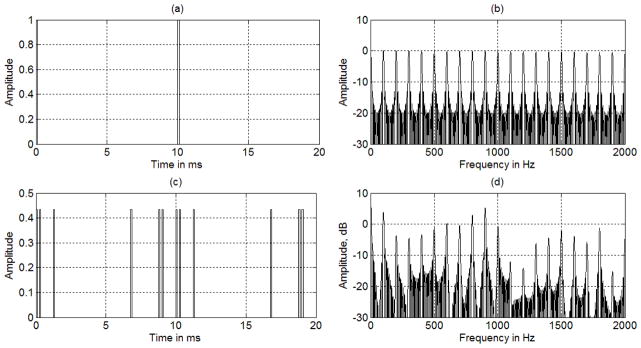
OFUV_PWM pulses and spectral distribution including nine harmonics. (a) Two periods of the OFUV pulses, (b) the spectral distribution of ten periods of the OFUV pulses. The amplitudes shown in (a) and (c) are normalized with the peak value of the binary pulses. The amplitude of the OFUV is more than half lower than that of the binary pulses.
The radiation force is applied to the liver phantom immersed in a water tank. The tissue vibrations and phase shifts were estimated at several locations in the lateral direction away from the center where the radiation force was applied. Each location was separated by 0.475 mm. Vibrations from 0.475 mm to 2.85 mm away from the center were estimated. The vibrations at 0.95 mm away from the center of the radiation force applied are shown in Fig. 11.
Fig. 11.
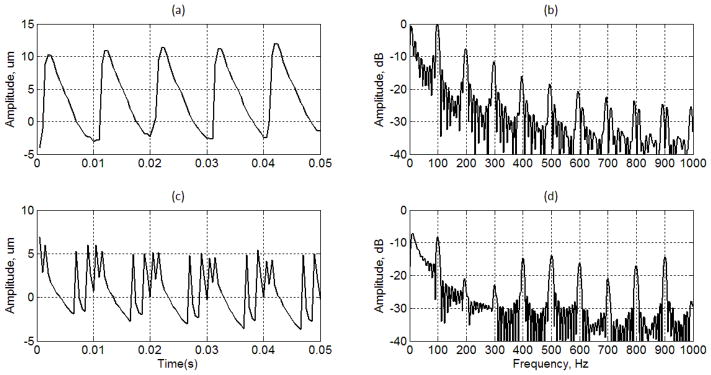
(a) Tissue motion induced by binary pulses, (b) spectral distribution of tissue motion induced by binary pulses, (c) tissue motion induced by the OFUV-PWM pulses, (b) spectral distribution of tissue motion induced by OFUV-PWM pulses.
The overall dynamic ranges of the vibration induced by the binary pulses are about twice higher than that of the OFUV pulses. The amplitude of the displacement induced by the binary pulses is more than 10 dB higher than that of the OFUV pulses for the first three harmonics, but the harmonics of 500 Hz to 900 Hz of the OFUV pulses are higher than that of the binary pulses by about 5 dB. There are four peaks in the detected displacements induced by the OFUV-PWM pulses, which play important role to enhance the higher harmonics. We found that the results of comparisons depend on locations. In this particular work, the OFUV_PWM pulses induced strong harmonics at high frequencies.
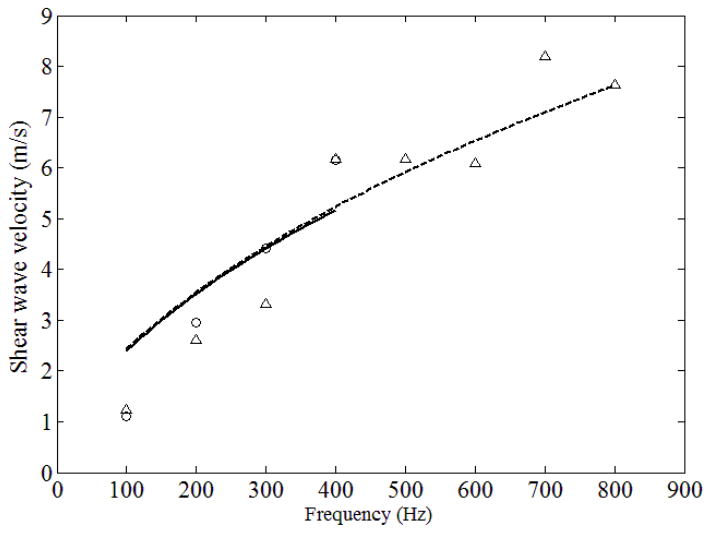
The shear elasticity and viscosity were estimated by using vibrations velocities calculated from six locations (0.475 mm to 2.85 mm). The velocities were calculated for four harmonics: 100, 200, 300, and 400 Hz for the binary pulses while that of the OFUV_PWM were calculated for eight harmonics from 100 to 800 Hz. The velocities beyond 400 Hz with the binary pulses were obviously not usable. The detected velocities using binary and OFUV pulses were fit to estimate the shear elasticity and viscosity of the Voigt model as shown in Fig 12(a) and (b), respectively.
Fig. 12.
Measured phase velocities and Voigt Model fit. The solid line represents the Voigt model fit using the phase velocities of shear wave induced by the binary pulse. The dotted line represents the Voigt model fit using the phase velocities of shear wave induced by the OFUV pulses.
Estimated shear elasticity and viscosity were 1.72 kPa and 5.89 Pa·s with SDUV binary pulses, 2.33 kPa and 6.19 Pa·s with OFUV pulses, respectively. The goodness of fit are 0.79 and 0.85 for the binary and OFUV pulses, respectively. The goodness of fit is a difference between one and a ratio of root-mean-squared (rms) values of the fitting error and the measurements, and its ideal value is 1.0.
If we only used the first four velocities (100 Hz to 400 Hz) of the motion induced by the OFUV pulses for the fitting, the estimated shear elasticity and viscosity were 1.58 kPa and 4.94 Pa·s, respectively. If we used the first four phase velocities (100 Hz to 400 Hz) of the binary pulses and the last four phase velocities (500 Hz to 800 Hz) of the OFUV pulses for the fit, the estimated shear elasticity and viscosity were 2.05 kPa and 6.39 Pa·s, respectively. Those results indicate that the measurements at the high harmonics have significant impact on elasticity and viscosity estimates.
IV. Discussion
The theoretical derivation and experimental results demonstrate that the orthogonal frequency ultrasound vibration pulses induce tissue vibrations with preferred spectral distributions. It increases the power of harmonics of interest of induced vibrations for robust estimations of ultrasound vibrometry. It maintains the advantage of the binary vibration pulses that can be interleaved with the detection pulses for applications using an array transducer, which has potential to be easily translated to clinical scanners for implementation. It is valuable for applications when the peak ultrasound intensity is limited and the tissue attenuation is large.
Because the tissue needs recovery time, we found that the continuous orthogonal wave does not induce tissue vibrations with a large dynamic range which is needed for phase velocity estimation. Therefore, the wave is sparsely sampled to provide a recovery time for tissue between pulses. As shown in the Fig. 8(d), there are three noticeable peaks in one period of the detected vibration, which correspond to three groups of seven PWM pulses in one period. The vibrations due to the two adjacent pulses in one group cannot be separated, but they enhance each other for a larger displacement.
The OFUV pulses can be implemented in many different ways, PAM, PWM, and other modulation techniques. The pulse amplitudes, pulse width, pulse positions, and number of pulses per period can be designed and adjusted for preferred spectral distributions. We reported the vibration results induced by the OFUV-PAM pulses in earlier studies [25, 26]. We found that the OFUV-PAM and OFUV-PWM produced similar results while the OFUV-PWM pulses are easier to implement because the PWM pulses have the same amplitudes.
If the amplitude of the OFUV_PWM pulses is the same as that of the binary pulses, the OFUV-PWM pulses produces more total acoustic energy than that of the binary pulses because of the multiple pulses per period with the same peak amplitude. In experiment I, the total acoustic energy of the OFUV-PWM is about 5.8 times higher than that of the binary pulses with the same peak intensity. As shown in Fig. 8, the amplitudes of the harmonics from 200 Hz to 600 Hz of the induced vibration using the OFUV-PWM pulses are higher than that of the binary pulses by 10 dB. If the peak intensity is a major limitation factor, OFUV_PWM pulses are useful to increase vibrations with improved strength in high harmonics of interest.
As shown in experiment II, when the total acoustic energies of both methods are the same, the transmitted amplitude of the OFUV_PWM is significantly lower than that of binary pulses, by a factor of 56.67% (1–260/600). This reduction is important for the transmitter circuit designs that are often power limited. It may be significant for implementing ultrasound vibrometry in some existing ultrasound scanners that have limited transmission powers. The experiment result shows that the OFUV pulses significantly enhance the harmonics beyond 400 Hz, which is often a cut-off frequency for the useable harmonics in many previous reports of ultrasound vibrometry.
Using the OFUV pulses, the detectable harmonics are expanded in the frequency domain from 400 Hz to 800 Hz, which may be important for improving the estimation accuracy of viscoelasticity of dispersive tissue. As shown in experiment II, the estimated elasticity using OFUV pulses is higher than that of binary pulses by about 35%. For tissue that is dispersive in frequency, the impact of viscosity becomes prominent at higher frequencies. The accurate estimation of the viscosity requires information in an extended frequency range. The accuracy of viscosity estimates plays an important role for the accuracy of elasticity estimates for dispersive tissue. Nevertheless, this point requires additional extensive study, which is beyond the scope of this work.
One interesting phenomenon is that the spectral distribution of the vibration velocity is remarkably similar to that of the theoretical spectral distribution of the vibration pulses. Considering the integration and derivative relations between the displacement and velocity, the design of the spectral distribution of the OFUV pulses may be benefitted by considering what will be originally measured in the applications.
V. CONCLUSION
The orthogonal frequency ultrasound vibration (OFUV) pulses generate strong shear waves with a preferred spectral distribution when the peak ultrasound intensity is the same as that of the binary pulses. It enhances higher frequency shear waves and extends the shear wave propagation distance for robust estimations of shear wave velocity in the ultrasound vibrometry applications. On the other hand, when the total transmission energy is the same as that of the binary pulses, the amplitude of OFUV pulses is significantly lower than that of the binary pulses to achieve the comparable or better results than that of the binary pulses. The OFUV vibration pulses and the motion detection pulses can be interleaved and transmitted using an array transducer for SDUV applications.
Acknowledgments
We thank Mr. Gary Hillukka, Ms. Yu Liu, Mr. Xin Chen, and Mr. Carlos Cuevas for their contributions to develop the ultrasound vibrometry experiment system at St. Cloud State University. This research was supported in part by NIH grant EB002167 and the Natural Science Foundation of China (61031003, 81271651).
Footnotes
Disclosure: Authors, Yi Zheng, Aiping Yao, Shigao Chen, Matthew W. Urban have filed patent applications in the technology being presented in this paper through Mayo Clinic.
References
- 1.Sarvazyan AP, Rudenko OV, Swanson SD, Fowlkes JB, Emelianov SY. Shear wave elasticity imaging: a new ultrasonic technology of medical diagnostics. Ultrason Med Biol. 1998;24:1419–1435. doi: 10.1016/s0301-5629(98)00110-0. [DOI] [PubMed] [Google Scholar]
- 2.Chen S, Urban M, Zheng Y, Yao A, Greenleaf JF. Quantification of Liver Stiffness and Viscosity with SDUV: In Vivo Animal Study. IEEE International Ultrasonics Symposium Proceedings; November, 2008; pp. 654–657. [Google Scholar]
- 3.Chen S, Kinnick RR, Pislaru C, Zheng Y, Yao A, Greenleaf JF. Shearwave dispersion ultrasound vibrometry (SDUV) for measuring tissue elasticity and viscosity. IEEE Transaction on Ultrasonics, Ferroelectric, and Frequency Control. 2009;56(1):55–62. doi: 10.1109/TUFFC.2009.1005. [DOI] [PMC free article] [PubMed] [Google Scholar]
- 4.Zheng Y, Chen S, Tan W, Greenleaf JF. Kalman filter motion detection for vibro-acoustography using pulse echo ultrasound. Proceedings of 2003 IEEE Ultrasunics Symposium; 2003. pp. 1812–1815. [Google Scholar]
- 5.Zheng Y, Chen S, Tan W, Kinter R, Greenleaf JF. Detection of tissue harmonic motion induced by ultrasonic radiation force using pulse echo ultrasound and Kalman filter. IEEE Transaction on Ultrasound, Ferroelectrics, and Frequency Control. 2007 Feb;54(2):290–300. doi: 10.1109/tuffc.2007.243. [DOI] [PubMed] [Google Scholar]
- 6.Oestreicher HL. Field and impedance of an oscillating sphere in a viscoelastic medium with an application to biophysics. J Acoust Soc Am. 1951;23(6):707–714. [Google Scholar]
- 7.Fatemi M, Greenleaf JF. Ultrasound-stimulated vibro-acoustic spectrography. Science. 1998 Apr 3;280(5360):82–85. doi: 10.1126/science.280.5360.82. [DOI] [PubMed] [Google Scholar]
- 8.Fatemi M, Greenleaf JF. Vibro-acoustography: An imaging modality based on ultrasound-stimulated acoustic emission. Proc Natl Acad Sci U S A. 1999 Jun 8;96:6603–8. doi: 10.1073/pnas.96.12.6603. [DOI] [PMC free article] [PubMed] [Google Scholar]
- 9.Nightingale KR, Palmeri ML, Nightingale RW, Trahey GE. On the feasibility of remote palpation using acoustic radiation force. J Acoust Soc Am. 2001 Jul;110:625–34. doi: 10.1121/1.1378344. [DOI] [PubMed] [Google Scholar]
- 10.Chen S, Fatemi M, Greenleaf JF. Quantifying elasticity and viscosity from measurement of shear wave speed dispersion. Journal of Acoustical Society of America. 2004;115(6):2781–2785. doi: 10.1121/1.1739480. [DOI] [PubMed] [Google Scholar]
- 11.Zheng Y, Chen S, Zhang X, Greenleaf JF. Detection of shear wave propagation in an artery using pulse echo ultrasound and Kalman filtering. Proceedings of 2004 IEEE International Ultrasonic Symposium; 2004. pp. 1251–1253. [Google Scholar]
- 12.Zheng Y, Yao A, Chen S, Greenleaf JF. Measurement of shear wave using ultrasound and Kalman filter with large background motion for cardiovascular studies. Proceedings of the 2006 IEEE Ultrasonics Symposium; 2006. pp. 718–721. [Google Scholar]
- 13.Zheng Y, Yao A, Chen S, Greenleaf JF. Rapid Shear Wave Measurement for SDUV with broadband excitation pulses and non-uniform sampling. Proceedings of 2008 IEEE International Ultrasonics Symposium; 2008. pp. 217–220. [Google Scholar]
- 14.Chen X, Shen Y, Zheng Y, Lin H, Guo Y, Zhu Y, Zhang X, Wang T, Chen S. Quantification of Liver Viscoelasticity with Acoustic Radiation Force: A Study of Hepatic Fibrosis in an Animal Model. Ultrasound in Medicine and Biology. doi: 10.1016/j.ultrasmedbio.2013.05.020. in Press. [DOI] [PubMed] [Google Scholar]
- 15.Urban MW, Greenleaf JF. A Kramers-Kronig-based quality factor for shear wave propagation in soft tissue. Phys Med Biol. 2009;54:5919–5933. doi: 10.1088/0031-9155/54/19/017. [DOI] [PMC free article] [PubMed] [Google Scholar]
- 16.Urban MW, Chen S, Greenleaf JF. Error in estimates of tissue material properties from shear wave dispersion ultrasound vibrometry. IEEE Trans Ultrason Ferroelectr Freq Control. 2009;56:748–758. doi: 10.1109/TUFFC.2009.1097. [DOI] [PMC free article] [PubMed] [Google Scholar]
- 17.Zhang X, Greenleaf JF. Measurement of wave velocity in arterial walls with ultrasound transducers. Ultrasound Med Biol. 2006;32:1655–60. doi: 10.1016/j.ultrasmedbio.2006.04.004. [DOI] [PubMed] [Google Scholar]
- 18.Zhang X, Kinnick RR, Fatemi M, Greenleaf JF. Noninvasive method for estimation of complex elastic modulus of arterial vessels. IEEE Trans Ultrason Ferroelectr Freq Control. 2005;52:642–52. doi: 10.1109/tuffc.2005.1428047. [DOI] [PubMed] [Google Scholar]
- 19.Zhang X, Greenleaf JF. Noninvasive generation and measurement of propagating waves in arterial walls. J Acoust Soc Am. 2006;119:1238–43. doi: 10.1121/1.2159294. [DOI] [PubMed] [Google Scholar]
- 20.Bernal M, Nenadic I, Urban MW, Greenleaf JF. Material property estimation for tubes and arteries using ultrasound radiation force and analysis of propagating modes. J Acoust Soc Am. 2011;129:1344–1354. doi: 10.1121/1.3533735. [DOI] [PMC free article] [PubMed] [Google Scholar]
- 21.Urban MW, Pislaru C, Nenadic IZ, Kinnick RR, Greenleaf JF. Measurement of viscoelastic properties of in vivo swine myocardium using Lamb wave dispersion ultrasound vibrometry (LDUV) IEEE Trans Med Imaging. 2013;32:247–261. doi: 10.1109/TMI.2012.2222656. [DOI] [PMC free article] [PubMed] [Google Scholar]
- 22.Mitri FG, Urban MW, Fatemi M, Greenleaf JF. Shearwave Dispersion Ultrasonic Vibrometry (SDUV) for measuring prostate shear stiffness and viscosity–An in vitro pilot study. IEEE Trans Biomed Eng. 2011;58:235–242. doi: 10.1109/TBME.2010.2053928. [DOI] [PMC free article] [PubMed] [Google Scholar]
- 23.Amador C, Urban MW, Chen S, Greenleaf JF. Shearwave Dispersion Ultrasound Vibrometry (SDUV) on swine kidney. IEEE Trans Ultrason Ferroelectr Freq Control. 2011;58:2608–2619. doi: 10.1109/TUFFC.2011.2124. [DOI] [PMC free article] [PubMed] [Google Scholar]
- 24.Chen S, Sanchez W, Callstrom MR, Gorman B, Lewis JT, Sanderson SO, Greenleaf JF, Xie H, Shi Y, Pashley M, Shamdasani V, Lachman M, Metz S. Assessment of liver viscoelasticity by using shear waves induced by ultrasound radiation force. Radiology. 2013;266:964–970. doi: 10.1148/radiol.12120837. [DOI] [PMC free article] [PubMed] [Google Scholar]
- 25.Urban MW, Chen S, Fatemi M. A review of shearwave Dispersion Ultrasound Vibrometry (SDUV) and its applications. Current Medical Imaging Reviews. doi: 10.2174/157340512799220625. in press. [DOI] [PMC free article] [PubMed] [Google Scholar]
- 26.Yamakoshi Y, Sato J, Sato T. Ultrasonic imaging of internal vibration of soft tissue under forced vibration. IEEE Trans Ultrason Ferroelectr Freq Control. 1990;37:45–53. doi: 10.1109/58.46969. [DOI] [PubMed] [Google Scholar]
- 27.Huwart L, Peeters F, Sinkus R, Annet L, Salameh N, ter Beek LC, Horsmans Y, Van Beers BE. Liver fibrosis: non-invasive assessment with MR elastography. NMR Biomed. 2006;19:173–179. doi: 10.1002/nbm.1030. [DOI] [PubMed] [Google Scholar]
- 28.Zheng Y, Yao A, Chen S, Urban MW, Liu Y, Chen K, Greenleaf JF. Composed Vibration Pulse for Ultrasound Vibrometry. IEEE International Ultrasonics Symposium Proceedings; October, 2010; pp. 17–20. [Google Scholar]
- 29.Zheng Y, Yao A, Chen S, Urban MW, Kinnick R, Greenleaf JF. Orthogonal Frequency Ultrasound Vibrometry. 2010 American Society of Mechanical Engineering Congress; November, 2010; Vacouver, Canada. [Google Scholar]
- 30.Lathi BP, Ding A. Modern Digital and Analog Communication Systems. 4. Oxfrod: Univesity Press; 2009. [Google Scholar]


