

Abstract
Moyamoya disease (MMD) is a cerebrovascular disease characterized by progressive stenosis of the intracranial internal carotid arteries and their proximal branches. However, the etiology of this rare disease remains unknown. Serum microRNA (miRNA) profiles have been screened to identify novel biomarkers of prognostic values. Here, we identified serum miRNAs that might play an important role in the pathogenesis of MMD. A genome-wide miRNA array analysis of two pooled serum samples from patients with MMD and controls revealed 94 differentially expressed serum miRNAs, including 50 upregulated and 44 downregulated miRNAs. In an independent MMD cohort, real-time PCR confirmed that miR-106b, miR-130a and miR-126 were significantly upregulated while miR-125a-3p was significantly downregulated in serum. GO analysis showed that the differentially expressed serum miRNAs were enriched in metabolic processes, transcription and signal transduction. Pathway analysis showed that the most enriched pathway was mTOR signaling pathway with 16 potential, functional targets. Finally, we found that 16 and 13 aberrant serum miRNAs coordinately inhibited RNF213 and BRCC3 protein expression at the posttranscriptional level, respectively, resulting in defective angiogenesis and MMD pathogenesis. To our knowledge, this is the first study to identify a serum miRNA signature in MMD. Modulation of the mechanism underlying the role of serum miRNAs in MMD is a potential therapeutic strategy and warrants further investigations.
Introduction
Moyamoya disease (MMD) is an idiopathic disorder manifesting stenosis or occlusion of a terminal portion of the internal carotid artery (ICA) or a proximal portion of the anterior cerebral arteries and the middle cerebral arteries (ACAs, MCAs) as well as abnormal vascular networks near the occlusive or stenotic lesions, as shown by cerebral angiography [1].
Histopathology of the carotid arteries reveals fibrocellular thickening of the intima. Moyamoya vessels show dilated perforating arteries with fibrin deposits, fragmented elastic laminae, and microaneurysms [2], [ 3].
Radiological findings such as computed tomography (CT) perfusion [4] and magnetic resonance imaging (MRI), are necessary for accurate diagnosis, especially MRI, which assists easier detections of asymptomatic patients with familial MMD [2]. In clinical diagnosis and treatment of cerebrovascular diseases, dynamic susceptibility contrast magnetic resonance has been widely used [5]. The “ivy sign” refers to the diffuse leptomeningeal enhancement that is found on post contrast MR images in patients with MMD or moyamoya syndrome [6]. Due to slow flow, prominent leptomeningeal collaterals result in vivid contrast enhancement and high signal on Fluid-Attenuated Inversion Recovery (FLAIR) [7]. The appearance is a reminiscence of the brain covered with ivy. High-resolution magnetic resonance imaging (HR-MRI) manifested smaller, concentric occlusive lesions, which are rarely enhanced in comparison with symptomatic intracranial atherosclerotic disease (ICAD) [8]. Arterial spin labeling (ASL), a completely noninvasive modality, is employed to investigate details of cerebral blood flow [9].The incidence of MMD worldwide in individuals with diverse ethnic backgrounds, including American and European populations is well established. However, the disease is extremely uncommon in non-Asian populations [10], [ 11]. The etiology of MMD is still unknown [12]. It is, therefore, essential to investigate the mechanisms underlying the development and progression of the disease.
Genetic linkage analyses unraveled five candidate loci for MMD including: chromosome 3p24–26, 6q25, 8q23, 12p12 and 17q25 [13], [ 14]. Genome-wide association studies (GWAS) also revealed several susceptibility genes: ACTA2, RPTOR, PDGFRB and TGFB1 [15], [ 16], [ 17]. RNF213 was identified as an MMD susceptibility gene in a genome-wide, locus-specific association study. It has since been confirmed in a recent large scale sequencing analysis [18], [ 19], [ 20]. In the near future, the pathogenesis of MMD might be determined by genetic analyses. Identification of the relevant genes may be very promising for the development of novel gene therapies and prevent the occurrence of MMD [2], [ 21], [ 22].
MicroRNAs (miRNAs) are short non-coding RNAs that regulate gene expression by binding to the 3′-untranslated regions (3′-UTRs) of specific mRNAs. MiRNA expression signatures have prognostic values [23], [ 24], [ 25], [ 26], [ 27]. Recently, novel biomarkers for disease diagnosis and prognosis have been identified in serum miRNA [28], [ 29], [30]. For example, miRNA-21, miRNA-155, miRNA-196a and miRNA-210, were found to be elevated in the plasma of patients with pancreatic carcinoma [31], [ 32]. Serum miRNAs are therefore, potential, independent prognostic factors compared with biomarkers derived from target tissues.
In this study, we hypothesized that serum miRNAs are candidate biomarkers in MMD. We systematically screened serum miRNAs by using miRNA arrays and validated the results by miRNA real-time PCR. Bioinformatics analyses revealed several important pathways and serum miRNAs potentially involved in the disease. To our knowledge, this is the first study to identify serum miRNA signature in MMD.
Methods
Sample preparation and RNA extraction
Written informed consents on the use of samples for analysis were obtained from all participants and/or their guardians before entry. The study was approved by the Ethics Committee Review Board of Changhai Hospital at Shanghai where the study was carried out. We included 10 adults with MMD diagnosed by digital subtraction angiography (DSA) along with 10 adults serving as controls. The diagnostic criteria for MMD were based on the guidelines published in 1997 by the Research Committee on the Spontaneous Occlusion of the Circle of Willis of the Ministry of Health and Welfare, Japan [2]. The inclusion criteria were: bilateral angiographic identification of severe stenosis or occlusion of the distal internal carotid, proximal middle cerebral, and anterior cerebral arteries, associated with an abnormal network of collateral vessels [33]. The exclusion criteria involved the presence of secondary moyamoya phenomenon caused by atherosclerosis, meningitis, Down syndrome, hyperthyroidism, neurofibromatosis, leptospiral infection, or prior skull-base radiation therapy. The regional distribution of MMD is indicated in Table 1. The control group of healthy adults was of a similar age and sex ratio as the adult patients with MMD. All patients and healthy subjects were of an ethnically homogeneous Han Chinese origin.
Table 1. Clinical characteristics of 20 MMD patients.
| No | Presentation | Initial CT or MR Image Findings | Suzuki Stage | Region of Origin(Province) |
| Blood samples of MMD patients used in the microarray analysis | ||||
| 1 | IVH | intracerebral hematoma(rt periventricular region) | rt5 lt4 | Shanghai |
| 2 | Infarction | infarction (lt frontal white matter) | rt3 lt2 | Beijing |
| 3 | TIA | lacunae | rt3 lt3 | Guangdong |
| 4 | TIA | normal | rt3 lt2 | Anhui |
| 5 | TIA | normal | rt2 lt3 | Henan |
| 6 | TIA | lacunae | rt3 lt4 | Shandong |
| 7 | Infarction | infarction (rt temperal white matter) | rt4 lt4 | Shanghai |
| 8 | TIA | normal | rt3 lt2 | Hubei |
| 9 | IVH | subarachnoid hemorrhage | rt4 lt3 | Jiangsu |
| 10 | TIA | lacunae | rt1 lt2 | Sichuan |
| Blood samples of MMD patients used in the Real-Time PCR analysis | ||||
| 1 | TIA | lacunae | rt2 lt3 | Hubei |
| 2 | TIA | normal | rt3 lt2 | Xinjiang |
| 3 | TIA | lacunae | rt3 lt3 | Anhui |
| 4 | Infarction | infarction (rt occipital white matter) | rt5 lt4 | Zhejiang |
| 5 | IVH | intraventricular hemorrhage(rt) | rt4 lt4 | Shandong |
| 6 | TIA | lacunae | rt3 lt3 | Jiangsu |
| 7 | TIA | normal | rt2 lt3 | Qinghai |
| 8 | TIA | normal | rt3 lt2 | Fujian |
| 9 | Infarction | infarction (lt temporal white matter) | rt4 lt4 | Shanxi |
| 10 | IVH | intracerebral hematoma(lt periventricular region) | rt4 lt4 | Shanghai |
CT = computerized tomography; IVH = intraventricular hemorrhage; MR = magnetic resonance; TIA = transient ischemic attack; lt = left; rt = right.
We collected 5 ml of venous blood from each participant using a procoagulant drying tube. The whole blood was centrifuged at 1500 g for 10 min at room temperature, and at 13800 g for 15 min at 4°C to completely remove cell debris. To detect the general signatures of serum miRNAs for MMD, we pooled serum samples from 10 patients and 10 controls respectively. Trizol Reagent (Invitrogen, Carlsbad, CA) was used for serum denaturation. Qiagen miRNeasy Mini kit (Qiagen, Valencia, CA) was used for RNA collection and purification, according to the manufacturer's protocol. We collected independent serum samples, including another 10 MMD patients and 10 controls, for miRNA validation by real-time PCR. Each new serum sample was separately used for RNA extraction and real-time PCR.
MiRNA microarray
We conducted three independent experiments using an Agilent Human 8×60 K miRNA array with the two pooled samples. The integrity of the total RNA was checked using an Agilent 2100 Bioanalyzer (Agilent, Santa Clara, USA). We synthesized the cDNA and biotinylated cRNA and hybridized to the array. Data were acquired using the Agilent G2565BA Microarray Scanner System and Agilent Feature Extraction Software. Probe intensities were normalized using Percentile Shift implemented in GeneSpring 12. Accession number(GSE45737)was obtained after submitting the dataset to Gene Expression Omnibus. Differentially expressed miRNAs were identified through fold- change filtering (fold change>2).
Real-time PCR
Additional serum samples were collected independently from 10 adult patients with MMD and 10 adult controls for miRNA validation. Each individual serum sample was separately used for RNA extraction and real-time PCR. The inclusion and exclusion criteria of MMD patients used in RT-PCR were identical to the RNA extraction protocol. The regional distribution was indicated in Table 1. All MMD patients and controls were of an ethnically homogeneous Han Chinese origin.
The miRNAs were quantified by using real-time PCR based on SYBR Green. The total serum RNAs were isolated using TRI Reagent BD (MRC, TR126), based on the manufacturer's modified instructions. In brief, 100 µl of plasma was added to 0.75 ml of TRI Reagent BD supplemented with 20 µl of acetic acid (5 mol/L). We used 5 µl of synthetic C.elegans miRNA (cel-miR-39, 50 pmol/L) as control [34], [ 35], [ 36] before chloroform extraction. We then precipitated RNA using isopropanol at −20°C, and resuspended the pellet in RNase-free water. In the absence of a unified internal reference for serum miRNA detection, we used the exogenous synthetic cel-miR-39 as control [37].The miRNeasy Serum Kit(Qiagen)was used to detect serum miRNA level [36]. First, we synthesized cDNA using small RNA from serum samples using miScript II RT Kit (Qiagen), according to the manufacturer's instructions. Real-time PCR was performed on a Rotor-Gene 3000A PCR Machine. The forward primers used in the PCR amplification reaction were as follows (5′ to 3′ shown):
GCCCTAAAGTGCTGACAGTGCAGAT for miR-106b; CCTACCACAGGGTAGAACCACGG for miR-140-3p; CAGCAGTGCAATGTTAAAAGGGCAT for miR-130a; GCCTCGTACCGTGAGTAATAATGCG for miR-126; and ACAGGTGAGGTTCTTGGGAGCC for miR-125a-3p. The universal reverse primers were provided by the miScript SYBR Green PCR Kit (Qiagen).
Bioinformatics analysis
In this study, we used TargetScan (http://www.targetscan.org/, TargetScanHuman 6.2) to identify the targets of differentially expressed miRNAs. In TargetScan, biological targets of miRNAs are predicted by searching for the presence of conserved 8 mer and 7 mer sites that match the seed region of each miRNA. We defined the predicted target genes by no less than 12 differentially expressed miRNAs as potential functional targets in MMD.
To determine the biological relationship between the potential miRNA target genes, Gene Ontology [37] and KEGG [38], [ 39] pathway enrichment analysis was performed using DAVID (http://david.abcc.ncifcrf.gov/)[40]. The significance threshold was set to 0.05 in our enrichment analysis.
Statistical Analysis
We used SPSS 11.0 (SPSS, Chicago, IL) to analyze the dataset from miRNA microarray experiments. All data were represented by mean ± SD. Statistical significance was determined at P<0.05. In order to screen the aberrant serum miRNAs in MMD, the criterion (more than 2-fold) was set. We detected the plasma miRNA levels both in healthy control and Moyamoya patients by real-time PCR. The data were evaluated by Shapiro-Wilk test to see whether they followed the normal distribution. The basis to declare a certain parameter as normally distributed was adjusted to P = 0.20. For the data that did not fit the normal distribution, Kruskal-Wallis test was performed. For the data of normal distribution, Levene's test of homogeneity of variance was further performed. When the data fitted the homogeneity of variance, One-way ANOVA was applied; and for the data that did not fit the homogeneity of variance, Kruskal-Wallis test was performed.
Results
Serum miRNAs were aberrantly expressed in MMD
Baseline clinical demographics were summarized in Table 1 and Table 2. The cases and controls were well matched in age, sex, routine blood tests, liver function and lipid screening. Total cholesterol and low density lipoprotein were slightly higher in MMD patients, but within the range of normal values. To study the miRNA mechanism in MMD, we determined the serum miRNA expression profile through microarray analysis. First, we assessed miRNA expression profiles in the two pooled serum samples, and 94 miRNAs were differentially expressed (Table 3). Of these, 50 miRNAs were upregulated by more than 2 folds in MMD group compared with the control group, while 44 miRNAs were downregulated, also by more than 2 folds. Several miRNA families and clusters were detected. Let-7 family (let-7a, let-7b, let-7c, let-7g and let-7i), miR-17 family (miR-19a, miR-19b, miR-20a, miR-106b, miR-25 and miR-92a), and miR-15/16 cluster (miR-15a and miR-16) were elevated in serum of MMD patients. Let-7 family, miR-17 family and miR-15/16 cluster have been reportedly associated with tumor development [41], [42], [43]. The miRNA families and the cluster associated with MMD warrant further investigations.
Table 2. Characteristics of the study population.
| Variable | Case | Control | P |
| Age(years) | 34.40±10.29 | 29.50±3.38 | 0.192 |
| Sex(Femal/Male) | 5/5 | 4/6 | 0.653 |
| WBC(×10∧9/L) | 7.73±2.14 | 7.01±1.83 | 0.422 |
| RBC(×10∧12/L) | 4.22±0.44 | 4.50±0.74 | 0.329 |
| GLU(mmol/L) | 5.25±0.65 | 4.91±0.85 | 0.332 |
| K+(mmol/L) | 4.06±0.19 | 4.41±0.83 | 0.212 |
| Na+(mmol/L) | 142.00±2.91 | 141.3±3.96 | 0.657 |
| ALT(U/L) | 28.1±30.11 | 15.42±12.47 | 0.233 |
| AST(U/L) | 13.25±18.56 | 17.61±9.68 | 0.446 |
| TB(umol/L) | 10.25±3.75 | 6.10±3.47 | 0.019 |
| DB(umol/L) | 3.80±1.67 | 2.92±1.37 | 0.205 |
| TC(mmol/L) | 4.27±0.36 | 3.20±0.78 | 0.001 |
| TG(mmol/L) | 0.82±0.31 | 0.96±0.07 | 0.087 |
| HDL(mmol/L) | 1.05±0.21 | 1.03±0.09 | 0.797 |
| LDL(mmol/L) | 2.54±0.34 | 2.08±0.55 | 0.038 |
WBC: white blood cell; RBC: red blood cell; GLU: glucose; ALT: alanine aminotransferase; AST: aspartic acid amino transferase; TB: total bilirubin; DB: direct bilirubin; TC: total cholesterol; TG: triglyceride; HDL: high density lipoprotein; LDL: low density lipoprotein.
Table 3. Differentially expressed miRNAs in MMD.
| Upregulated miRNAs | Downregulated miRNAs | ||||||
| MiRNA | Fold | MiRNA | Fold | MiRNA | Fold | MiRNA | Fold |
| miR-106b | 247.8 | miR-151-3p | 32.3 | miR-3648 | −207 | miR-1305 | −24.7 |
| miR-140-3p | 145.7 | miR-361-5p | 32.3 | miR-125a-3p | −133 | miR-595 | −19.0 |
| miR-320d | 141.3 | miR-1274b | 29.6 | miR-4299 | −124 | miR-30c-1* | −16.7 |
| miR-29c | 138.1 | miR-146a | 28.7 | miR-1224-5p | −97.8 | miR-769-3p | −15.2 |
| miR-126 | 138 | miR-103 | 28.5 | miR-3692* | −81.6 | miR-371-5p | −5.2 |
| miR-142-3p | 130.7 | miR-101 | 28.5 | miR-32* | −81.5 | miR-4257 | −3.9 |
| let-7i | 121.2 | miR-29a | 26.7 | miR-3198 | −76.9 | miR-3195 | −3.5 |
| miR-320e | 114.3 | miR-145 | 26.6 | miR-3156 | −75.6 | miR-765 | −3.0 |
| miR-122 | 101.1 | miR-877* | 19.4 | miR-1469 | −72.6 | miR-3202 | −2.8 |
| miR-130a | 98.51 | miR-144 | 16.9 | miR-1182 | −71.9 | miR-575 | −2.8 |
| miR-19a | 97.4 | miR-191* | 13.3 | miR-557 | −67.6 | miR-3679-5p | −2.8 |
| miR-107 | 69.4 | miR-19b | 11.9 | miR-1226* | −59.8 | miR-1471 | −2.4 |
| miR-1290 | 67.0 | miR-451 | 9.3 | miR-601 | −59.5 | miR-4271 | −2.4 |
| miR-15b | 61.1 | miR-16 | 7.2 | miR-3149 | −59.3 | miR-423-5p | −2.3 |
| miR-30a | 58.0 | miR-320b | 5.0 | miR-4313 | −57.8 | miR-483-5p | −2.2 |
| miR-1183 | 55.9 | miR-25 | 4.6 | miR-3945 | −53.6 | miR-3188 | −2.2 |
| miR-15a | 46.6 | miR-22 | 4.5 | miR-202 | −52.6 | miR-574-5p | −2.1 |
| miR-185 | 41.0 | miR-21 | 3.5 | miR-3180-5p | −51.1 | miR-4298 | −2.1 |
| miR-338-3p | 41.0 | let-7b | 3.4 | miR-514b-5p | −48.3 | miR-197 | −2.0 |
| let-7c | 40.3 | miR-720 | 3.2 | miR-187* | −47.1 | ||
| miR-4286 | 39.1 | miR-26a | 2.9 | miR-3605-5p | −42.4 | ||
| let-7g | 37.9 | miR-23a | 2.7 | miR-711 | −35.1 | ||
| miR-483-3p | 36.3 | miR-92a | 2.5 | miR-2278 | −30.9 | ||
| let-7a | 34.1 | miR-486-5p | 2.5 | miR-3652 | −27.8 | ||
| miR-20a | 33.8 | miR-30e | 2.2 | miR-3646 | −26.8 | ||
Serum miR-106b, miR-130a, miR-126 and miR-125a-3p were validated in independent MMD samples. Real-time PCR assay was used to further confirm the serum miRNA expression profile. The natural history of MMD may be associated with vascular endothelium and neovascularization [2], thereby justifying the focus of our experimental design. Using Pubmed search, we selected 5 associated miRNAs, including miR-106b [44], miR-140-3p [45], miR-130a [46], miR-126 [47] and miR-125a-3p [48], for further study. We then examined these miRNAs in serum from an independent cohort containing 10 MMD samples and 10 control samples. As shown in Fig 1, miR-106b, miR-130a and miR-126 were significantly upregulated (P<0.05), whereas miR-125a-3p was significantly downregulated in MMD serum (P<0.05). Our real-time PCR validation rate was relatively high (4/5).
Figure 1. Real-time PCR of dysregulated miRNAs.

Expression levels of miR-106b, miR-140-3p, miR-130a, miR-126 and miR-125a-3p in MMD serum were measured by real-time PCR and quantified as described in Methods. * P<0.05 compared with control group.
Potential functional targets
Since miRNAs negatively regulate the expression of their target genes, the next step was to screen the potential functional targets of the differentially expressed miRNAs. By searching and defining the target prediction program, we identified 1989 potential functional targets that may participate in MMD pathogenesis. GO analysis of biological process showed that potential functional targets were enriched in metabolic processes, transcription and signal transduction. The top 10 terms of biological processes were listed in Table 4.
Table 4. Top 10 biological processes as potential functional targets (1989).
| Term | Count | P Value |
| protein amino acid phosphorylation | 116 | 1.00E-08 |
| phosphate metabolic process | 150 | 1.97E-07 |
| phosphorus metabolic process | 150 | 1.97E-07 |
| regulation of transcription | 338 | 4.49E-07 |
| phosphorylation | 125 | 1.19E-06 |
| enzyme linked receptor protein signaling pathway | 65 | 1.25E-06 |
| transcription | 278 | 1.61E-06 |
| cellular macromolecule catabolic process | 112 | 7.95E-06 |
| response to peptide hormone stimulus | 35 | 1.18E-05 |
| response to insulin stimulus | 26 | 1.81E-05 |
mTOR pathway might be regulated by miRNAs and involved in MMD pathogenesis
Pathway analysis revealed 18 different pathways corresponding to the target genes (P<0.05, Table 5). The most enriched pathway was mTOR signaling pathway (Fig 2) with 16 potential functional targets. Recent data suggest that various matrixins, cytokines and angiogenic factors in plasma are involved in the pathogenesis of MMD, including MMP-3, MMP-9, MCP-1, VEGF, PDGF-BB, etc [20], [ 49]. These factors may be regulated by MAPK signaling and VEGF signaling, which are associated with mTOR pathway.
Table 5. Enriched pathways for potential functional targets (1989).
| Term | Count | P Value |
| mTOR signaling pathway | 16 | 8.05E-05 |
| Ubiquitin mediated proteolysis | 28 | 2.47E-04 |
| Adherens junction | 19 | 3.14E-04 |
| Endocytosis | 33 | 7.26E-04 |
| Focal adhesion | 35 | 8.35E-04 |
| T cell receptor signaling pathway | 22 | 0.001419 |
| Oocyte meiosis | 21 | 0.004158 |
| Aldosterone-regulated sodium reabsorption | 11 | 0.004868 |
| Axon guidance | 23 | 0.006051 |
| Progesterone-mediated oocyte maturation | 17 | 0.007885 |
| ErbB signaling pathway | 17 | 0.008822 |
| Gap junction | 17 | 0.010962 |
| Regulation of actin cytoskeleton | 32 | 0.01563 |
| Biosynthesis of unsaturated fatty acids | 7 | 0.015886 |
| TGF-beta signaling pathway | 16 | 0.019483 |
| Neurotrophin signaling pathway | 20 | 0.029869 |
| Long-term depression | 13 | 0.032527 |
| Insulin signaling pathway | 21 | 0.036219 |
Figure 2. Targets of the differentially expressed miRNAs in mTOR signaling pathway.

Red boxes indicate potential functional targets of the differentially expressed miRNAs in MMD (based on Kanehisa Laboratories on 7/25/12, from KEGG).
RNF213 and BRCC3- associated miRNAs
To explore unknown angiogenesis-related miRNAs, we performed a Pubmed search for known genes. Recent data have shown that RNF213 is a susceptible gene for MMD. Knockdown of RNF213 in zebrafish causes irregular wall formation in trunk arteries, with abnormal sprouting vessels [50], [ 51], [ 52]. We found that RNF213 was the potential target of 16 differentially expressed serum miRNAs in MMD, involving upregulation of 14/16 (87.5%) serum miRNAs (Fig 3). The 14 over-expressed miRNAs may synergistically interact with the 3′UTR of RNF213 to inhibit RNF213 protein expression, thereby modulating MMD pathogenesis.
Figure 3. Network of RNF213- and BRCC3-associated miRNAs in MMD.
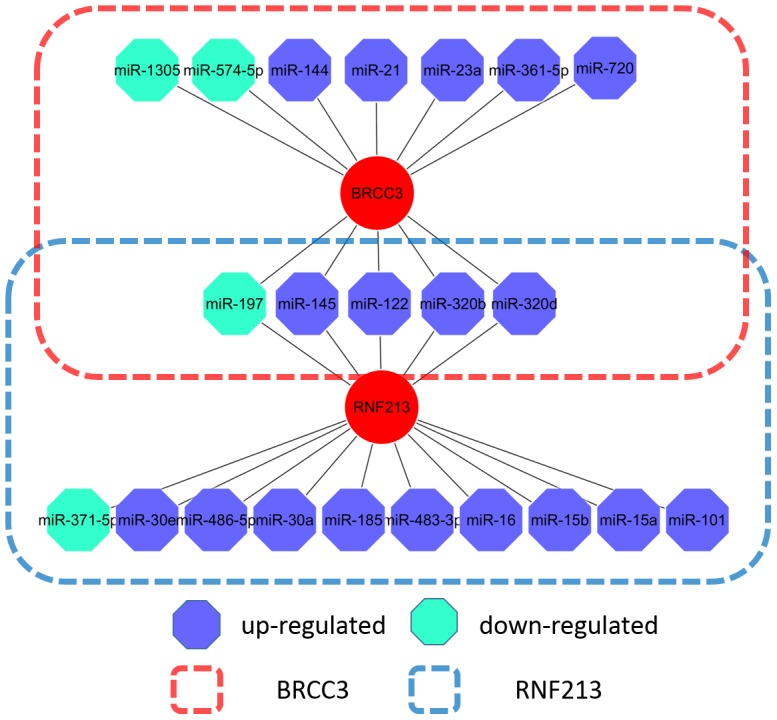
Another study has reported that syndromic moyamoya was associated with Xq28 deletions involving BRCC3, leading to defective angiogenesis in zebrafish [53]. Of the 94 aberrant miRNAs, 13 miRNAs potentially target BRCC3, including 10 upregulated and 3 downregulated miRNAs (Fig 3). The 13 differentially expressed serum miRNAs inhibit BRCC3 protein expression at the posttranscriptional level, resulting in abnormal angiogenesis in MMD.
Discussion
Extensive data indicate that serum miRNAs act as potential biomarkers for various diseases [54]. However, until now, no study has reported detail serum miRNAs in MMD. Neurosci Lett recently published a paper which demonstrated a higher frequency of the CT+CC genotype of the SNP rs11614913 in miR-196a2C>T [52], suggesting that miR-196a2 may play an important role in the pathogenesis of Moyamoya disease. It's worth noting that although annexin A1 (lipocortin1, ANXA1), a main targeted gene of miR-196a, was identified to be linked with increased multiple malignant tumors in brain models of ischemia and reperfusion injury, the SNP rs11614913 in miR-196a2C>T would not affect the function inhibiting targeted genes expression, because it was not present in the seed-sequences of miR-196a. Actually, the data of plasma miRNA microarray showed no differences in miR-196a between the two groups. However, whether SNP rs11614913 in miR-196a2C>T could be present in the Moyamoya patients involved in our investigation should also be confirmed in the future. A genome-wide array was used in our study to screen 10 patients with MMD for serum miRNAs. For the first time, we detected a serum miRNA signature for MMD and found that mTOR pathway and RNF213 and BRCC3-associated miRNAs play an important role in MMD.
In our study, we confirmed that serum miR-106b, miR-130a, miR-126 and miR-125a-3p were dysregulated in MMD. Human circulating miR-126 has been reported as a potential, novel indicator for acute myocardial infarction (AMI) [55]. Decreased miR-126 in plasma from symptomatic AMI patients compared with healthy subjects correlated with expression of cardiac troponin I (cTnI). Further, in hepatocellular carcinoma, upregulation of miR-125a significantly repressed the expression of vascular endothelial growth factor A (VEGF-A) and matrix metalloproteinase 11 (MMP11), both in vitro and in vivo [56]. The mechanism of aberrant serum miRNAs involved in MMD warrants further investigations.
The mechanism and function of serum miRNAs remain unclear. Recently, miRNAs have been reportedly transported in microvesicles and involved in gene silencing [57]. According to Skog et al., glioblastoma-derived RNA contained in microvesicles was functional and transported by human brain microvascular endothelial cells (HBMVEC) in cultures [28], [ 58]. If this hypothesis holds true, differentially expressed serum miRNAs in MMD may be delivered by HBMVEC to regulate MMD associated genes. Loss of RNF213 and BRCC3 has been associated with MMD pathogenesis [50], [ 53], [ 57]. Here, we showed that most RNF213- and BRCC3-associated miRNAs were elevated in serum of MMD patients, repressed RNF213 and BRCC3 protein expression in HBMVEC, and modulated HBMVEC angiogenesis. Therefore, searching for known angiogenesis-associated genes might be a better way to identify potentially unknown angiogenesis-associated miRNAs.
In conclusion, our study revealed, for the first time, that serum miRNAs were differentially expressed in MMD. The miR-106b, miR-130a, miR-126 and miR-125a-3p play a critical role in the pathogenesis of MMD. The RNF213- and BRCC3-associated miRNAs may significantly contribute to the development of MMD.
However, the study limitations are related to the target mRNA(s) of the differentially expressed miRNAs. Experimental validation is required to confirm the targets of the differentially expressed miRNAs predicted by computational algorithms. Another limitation involves the relatively small cohort size. A similar study with larger cohorts of MMD and corresponding control sample may improve the reliability of our findings.
Funding Statement
This paper was financially supported by National Science Foundation of China (ISIS : 81271271, 81171093 and 81101906) and "1255" Discipline Construction Project of Changhai Hospital (CH125520105). The funders had no role in study design, data collection and analysis, decision to publish, or preparation of the manuscript.
References
- 1. Weinberg DG, Arnaout OM, Rahme RJ, Aoun SG, Batjer HH, et al. (2011) Moyamoya disease: a review of histopathology, biochemistry, and genetics. Neurosurg Focus 30: E20. [DOI] [PubMed] [Google Scholar]
- 2. Kuroda S, Houkin K (2008) Moyamoya disease: current concepts and future perspectives. Lancet Neurol 7: 1056–1066. [DOI] [PubMed] [Google Scholar]
- 3. Chen J, Liu J, Duan L, Xu R, Han YQ, et al. (2013) Impaired dynamic cerebral autoregulation in moyamoya disease. CNS NeurosciTher 19: 638–640. [DOI] [PMC free article] [PubMed] [Google Scholar]
- 4. Dai DW, Zhao WY, Zhang YW, Yang ZG, Li Q, et al. (2013) Role of CT perfusion imaging in evaluating the effects of multiple burr hole surgery on adult ischemic Moyamoya disease. Neuroradiology 55: 1431–1438. [DOI] [PMC free article] [PubMed] [Google Scholar]
- 5. Lu CF, Guo WY, Chang FC, Huang SR, Chou YC, et al. (2013) Hemodynamic segmentation of brain perfusion images with delay and dispersion effects using an expectation-maximization algorithm. PLoS One 8: e68986. [DOI] [PMC free article] [PubMed] [Google Scholar]
- 6. Maeda M, Tsuchida C (1999) "Ivy sign" on fluid-attenuated inversion-recovery images in childhood moyamoya disease. Am J Neuroradiol 20: 1836–1838. [PMC free article] [PubMed] [Google Scholar]
- 7. Mori N, Mugikura S, Higano S, Kaneta T, Fujimura M, et al. (2009) The leptomeningeal "ivy sign" on fluid-attenuated inversion recovery MR imaging in Moyamoya disease: a sign of decreased cerebral vascular reserve? Am J Neuroradiol 30: 930–935. [DOI] [PMC free article] [PubMed] [Google Scholar]
- 8. Kim YJ, Lee DH, Kwon JY, Kang DW, Suh DC, et al. (2013) High resolution MRI difference between moyamoya disease and intracranial atherosclerosis. Eur J Neurol 20: 1311–1318. [DOI] [PubMed] [Google Scholar]
- 9. Yun TJ, Sohn CH, Han MH, Kang HS, Kim JE, et al. (2013) Effect of Delayed Transit Time on Arterial Spin Labeling: Correlation With Dynamic Susceptibility Contrast Perfusion Magnetic Resonance in Moyamoya Disease. Invest Radiol 48: 795–802. [DOI] [PubMed] [Google Scholar]
- 10. Duan L, Bao XY, Yang WZ, Shi WC, Li DS, et al. (2012) Moyamoya disease in China: its clinical features and outcomes. Stroke 43: 56–60. [DOI] [PubMed] [Google Scholar]
- 11. Kossorotoff M, Herve D, Toulgoat F, Renaud C, Presles E, et al. (2012) Paediatric moyamoya in mainland France: a comprehensive survey of academic neuropaediatric centres. Cerebrovasc Dis 33: 76–79. [DOI] [PubMed] [Google Scholar]
- 12. Li H, Zhang ZS, Liu W, Yang WZ, Dong ZN, et al. (2010) Association of a functional polymorphism in the MMP-3 gene with Moyamoya Disease in the Chinese Han population. Cerebrovasc Dis 30: 618–625. [DOI] [PubMed] [Google Scholar]
- 13. Sakurai K, Horiuchi Y, Ikeda H, Ikezaki K, Yoshimoto T, et al. (2004) A novel susceptibility locus for moyamoya disease on chromosome 8q23. J Hum Genet 49: 278–281. [DOI] [PubMed] [Google Scholar]
- 14. Yamauchi T, Tada M, Houkin K, Tanaka T, Nakamura Y, et al. (2000) Linkage of familial moyamoya disease (spontaneous occlusion of the circle of Willis) to chromosome 17q25. Stroke 31: 930–935. [DOI] [PubMed] [Google Scholar]
- 15. Guo DC, Papke CL, Tran-Fadulu V, Regalado ES, Avidan N, et al. (2009) Mutations in smooth muscle alpha-actin (ACTA2) cause coronary artery disease, stroke, and moyamoya disease, along with thoracic aortic disease. Am J Hum Genet 84: 617–627. [DOI] [PMC free article] [PubMed] [Google Scholar]
- 16. Liu W, Hashikata H, Inoue K, Matsuura N, Mineharu Y, et al. (2010) A rare Asian founder polymorphism of Raptor may explain the high prevalence of Moyamoya disease among East Asians and its low prevalence among Caucasians. Environ Health Prevent Med 15: 94–104. [DOI] [PMC free article] [PubMed] [Google Scholar]
- 17.Roder C, Peters V, Kasuya H, Nishizawa T, Takehara Y, et al. (2010) Polymorphisms in TGFB1 and PDGFRB are associated with Moyamoya disease in European patients. Acta Neurochir: 1–8. [DOI] [PubMed]
- 18. Wu Z, Jiang H, Zhang L, Xu X, Zhang X, et al. (2012) Molecular analysis of RNF213 gene for moyamoya disease in the Chinese Han population. PLoS One 7: e48179. [DOI] [PMC free article] [PubMed] [Google Scholar]
- 19. Hitomi T, Habu T, Kobayashi H, Okuda H, Harada KH, et al. (2013) Downregulation of Securin by the variant RNF213 R4810K (rs112735431, G>A) reduces angiogenic activity of induced pluripotent stem cell-derived vascular endothelial cells from moyamoya patients. BiochemBiophys Res Commun 438: 13–19. [DOI] [PubMed] [Google Scholar]
- 20. Wang X, Zhang Z, Liu W, Xiong Y, Sun W, et al. (2013) Impacts and interactions of PDGFRB, MMP-3, TIMP-2, and RNF213 polymorphisms on the risk of Moyamoya disease in Han Chinese human subjects. Gene 526: 437–442. [DOI] [PubMed] [Google Scholar]
- 21. Kamada F, Aoki Y, Narisawa A, Abe Y, Komatsuzaki S, et al. (2010) A genome-wide association study identifies RNF213 as the first Moyamoya disease gene. J Hum Genet 56: 34–40. [DOI] [PubMed] [Google Scholar]
- 22. Liu W, Morito D, Takashima S, Mineharu Y, Kobayashi H, et al. (2011) Identification of RNF213 as a susceptibility gene for moyamoya disease and its possible role in vascular development. Plos ONE 6: e22542. [DOI] [PMC free article] [PubMed] [Google Scholar]
- 23. Kong YW, Ferland-McCollough D, Jackson TJ, Bushell M (2012) microRNAs in cancer management. Lancet Oncol 13: e249–258. [DOI] [PubMed] [Google Scholar]
- 24. Shi L, Cheng Z, Zhang J, Li R, Zhao P, et al. (2008) hsa-mir-181a and hsa-mir-181b function as tumor suppressors in human glioma cells. Brain Res 1236: 185–193. [DOI] [PubMed] [Google Scholar]
- 25. Wang Y, Wang X, Zhang J, Sun G, Luo H, et al. (2012) MicroRNAs involved in the EGFR/PTEN/AKT pathway in gliomas. J Neurooncol 106: 217–224. [DOI] [PubMed] [Google Scholar]
- 26. Bai J, Guo A, Hong Z, Kuai W (2012) Upregulation of microRNA-100 predicts poor prognosis in patients with pediatric acute myeloid leukemia. Onco Targets Ther 5: 213–219. [DOI] [PMC free article] [PubMed] [Google Scholar]
- 27. Boeri M, Verri C, Conte D, Roz L, Modena P, et al. (2011) MicroRNA signatures in tissues and plasma predict development and prognosis of computed tomography detected lung cancer. Proc Natl Acad Sci USA 108: 3713–3718. [DOI] [PMC free article] [PubMed] [Google Scholar]
- 28. Brase JC, Wuttig D, Kuner R, Sultmann H (2010) Serum microRNAs as non-invasive biomarkers for cancer. Mol Cancer 9: 306. [DOI] [PMC free article] [PubMed] [Google Scholar]
- 29. Zhao C, Dong J, Jiang T, Shi Z, Yu B, et al. (2011) Early second-trimester serum miRNA profiling predicts gestational diabetes mellitus. PLoS One 6: e23925. [DOI] [PMC free article] [PubMed] [Google Scholar]
- 30. Dai DW, Lu Q, Wang LX, Zhao WY, Cao YQ, et al. (2013) Decreased miR-106a inhibits glioma cell glucose uptake and proliferation by targeting SLC2A3 in GBM. BMC Cancer 13: 478. [DOI] [PMC free article] [PubMed] [Google Scholar]
- 31. Ho AS, Huang X, Cao H, Christman-Skieller C, Bennewith K, et al. (2010) Circulating miR-210 as a Novel Hypoxia Marker in Pancreatic Cancer. Transl Oncol 3: 109–113. [DOI] [PMC free article] [PubMed] [Google Scholar]
- 32. Wang J, Chen J, Chang P, LeBlanc A, Li D, et al. (2009) MicroRNAs in plasma of pancreatic ductal adenocarcinoma patients as novel blood-based biomarkers of disease. Cancer Prev Res (Phila) 2: 807–813. [DOI] [PMC free article] [PubMed] [Google Scholar]
- 33. Kraemer M, Heienbrok W, Berlit P (2008) Moyamoya disease in Europeans. Stroke 39: 3193–200. [DOI] [PubMed] [Google Scholar]
- 34. Wang GK, Zhu JQ, Zhang JT, Li Q, Li Y, et al. (2010) Circulating microRNA: a novel potential biomarker for early diagnosis of acute myocardial infarction in humans. Eur Heart J 31: 659–666. [DOI] [PubMed] [Google Scholar]
- 35. Mitchell PS, Parkin RK, Kroh EM, Fritz BR, Wyman SK, et al. (2008) Circulating microRNAs as stable blood-based markers for cancer detection. Proc Natl Acad Sci USA 105: 10513–8. [DOI] [PMC free article] [PubMed] [Google Scholar]
- 36. Kroh EM, Parkin RK, Mitchell PS, Tewari M (2010) Analysis of circulating microRNA biomarkers in plasma and serum using quantitative reverse transcription-PCR (qRT-PCR), . Methods 50: 298–301. [DOI] [PMC free article] [PubMed] [Google Scholar]
- 37. Ashburner M, Ball CA, Blake JA, Botstein D, Butler H, et al. (2000) Gene ontology: tool for the unification of biology. Nat Genet 25: 25–29. [DOI] [PMC free article] [PubMed] [Google Scholar]
- 38. Kanehisa M (2013) Molecular network analysis of diseases and drugs in KEGG. Methods Mol Biol 939: 263–275. [DOI] [PubMed] [Google Scholar]
- 39. Kanehisa M, Goto S, Sato Y, Furumichi M, Tanabe M (2012) KEGG for integration and interpretation of large-scale molecular datasets. Nucleic Acids Res 40: D109–D114. [DOI] [PMC free article] [PubMed] [Google Scholar]
- 40. Huang da W, Sherman BT, Lempicki RA (2009) Systematic and integrative analysis of large gene lists using DAVID bioinformatics resources. Nat Protoc 4: 44–57. [DOI] [PubMed] [Google Scholar]
- 41. Wang X, Cao L, Wang Y, Liu N, You Y (2012) Regulation of let-7 and its target oncogenes (Review). Oncol Lett 3: 955–960. [DOI] [PMC free article] [PubMed] [Google Scholar]
- 42. Concepcion CP, Bonetti C, Ventura A (2012) The microRNA-17-92 family of microRNA clusters in development and disease. Cancer J 18: 262–267. [DOI] [PMC free article] [PubMed] [Google Scholar]
- 43. Aqeilan RI, Calin GA, Croce CM (2010) miR-15a and miR-16-1 in cancer: discovery, function and future perspectives. Cell Death Differ 17: 215–220. [DOI] [PubMed] [Google Scholar]
- 44. Liu Z, Yang D, Xie P, Ren G, Sun G, et al. (2012) MiR-106b and MiR-15b modulate apoptosis and angiogenesis in myocardial infarction. Cell Physiol Biochem 29: 851–862. [DOI] [PubMed] [Google Scholar]
- 45. Taurino C, Miller WH, McBride MW, McClure JD, Khanin R, et al. (2010) Gene expression profiling in whole blood of patients with coronary artery disease. Clin Sci (Lond) 119: 335–343. [DOI] [PMC free article] [PubMed] [Google Scholar]
- 46. Wu WH, Hu CP, Chen XP, Zhang WF, Li XW, et al. (2011) MicroRNA-130a mediates proliferation of vascular smooth muscle cells in hypertension. Am J Hypertens 24: 1087–1093. [DOI] [PubMed] [Google Scholar]
- 47. Sasahira T, Kurihara M, Bhawal UK, Ueda N, Shimomoto T, et al. (2012) Downregulation of miR-126 induces angiogenesis and lymphangiogenesis by activation of VEGF-A in oral cancer. Br J Cancer 107: 700–706. [DOI] [PMC free article] [PubMed] [Google Scholar]
- 48. Li D, Yang P, Xiong Q, Song X, Yang X, et al. (2010) MicroRNA-125a/b-5p inhibits endothelin-1 expression in vascular endothelial cells. J Hypertens 28: 1646–1654. [DOI] [PubMed] [Google Scholar]
- 49. Kang HS, Kim JH, Phi JH, Kim YY, Kim JE, et al. (2010) Plasma matrix metalloproteinases, cytokines and angiogenic factors in moyamoya disease. J Neurol Neurosurg Psychiatry 81: 673–678. [DOI] [PubMed] [Google Scholar]
- 50. Liu W, Morito D, Takashima S, Mineharu Y, Kobayashi H, et al. (2011) Identification of RNF213 as a susceptibility gene for moyamoya disease and its possible role in vascular development. PLoS One 6: e22542. [DOI] [PMC free article] [PubMed] [Google Scholar]
- 51. Kamada F, Aoki Y, Narisawa A, Abe Y, Komatsuzaki S, et al. (2011) A genome-wide association study identifies RNF213 as the first Moyamoya disease gene. J Hum Genet 56: 34–40. [DOI] [PubMed] [Google Scholar]
- 52. Miyatake S, Miyake N, Touho H, Nishimura-Tadaki A, Kondo Y, et al. (2012) Homozygous c.14576G>A variant of RNF213 predicts early-onset and severe form of moyamoya disease. Neurology 78: 803–810. [DOI] [PubMed] [Google Scholar]
- 53. Miskinyte S, Butler MG, Herve D, Sarret C, Nicolino M, et al. (2011) Loss of BRCC3 deubiquitinating enzyme leads to abnormal angiogenesis and is associated with syndromic moyamoya. Am J Hum Genet 88: 718–728. [DOI] [PMC free article] [PubMed] [Google Scholar]
- 54. Scholer N, Langer C, Dohner H, Buske C, Kuchenbauer F (2010) Serum microRNAs as a novel class of biomarkers: a comprehensive review of the literature. Exp Hematol 38: 1126–1130. [DOI] [PubMed] [Google Scholar]
- 55. Long G, Wang F, Duan Q, Chen F, Yang S, et al. (2012) Human circulating microRNA-1 and microRNA-126 as potential novel indicators for acute myocardial infarction. Int J Biol Sci 8: 811–818. [DOI] [PMC free article] [PubMed] [Google Scholar]
- 56. Bi Q, Tang S, Xia L, Du R, Fan R, et al. (2012) Ectopic expression of MiR-125a inhibits the proliferation and metastasis of hepatocellular carcinoma by targeting MMP11 and VEGF. PLoS One 7: e40169. [DOI] [PMC free article] [PubMed] [Google Scholar]
- 57. Kosaka N, Iguchi H, Yoshioka Y, Takeshita F, Matsuki Y, et al. (2010) Secretory mechanisms and intercellular transfer of microRNAs in living cells. J Biol Chem 285: 17442–17452. [DOI] [PMC free article] [PubMed] [Google Scholar]
- 58. Skog J, Wurdinger T, van Rijn S, Meijer DH, Gainche L, et al. (2008) Glioblastoma microvesicles transport RNA and proteins that promote tumour growth and provide diagnostic biomarkers. Nat Cell Biol 10: 1470–1476. [DOI] [PMC free article] [PubMed] [Google Scholar]