

Abstract
Background
Atopic dermatitis (AD) is the most common inflammatory disease. Evolving disease models link changes in epidermal growth and differentiation to Th2/Th22 cytokine activation. However, these models have not been tested by in-vivo suppression of T-cell cytokines. CsA is an immune-suppressant highly effective for severe disease, but its mechanism in AD skin lesions has not been studied.
Objective
To establish the ability of a systemic immune-suppressant to modulate immune and epidermal alterations that form the pathogenic disease phenotype, and to correlate changes with clinical improvement.
Methods
CsA effects on AD skin pathology were evaluated using geneexpression and immunohistochemistry studies in baseline, week 2 and 12 lesional and non-lesional biopsies from 19 patients treated with 5 mg/kg/d CsA for 12 weeks.
Results
After 2 and 12 weeks of treatment, we observed significant reductions of 51% and 72%, respectively, in Scoring of AD/SCORAD. Clinical improvements were associated with significant gene expression changes in lesional but also non-lesional skin, particularly reductions of Th2-, Th22-, and some Th17-related molecules (i.e IL-13, IL-22, CCL17, S100As, elafin/PI3), and modulation of epidermal hyperplasia and differentiation measures.
Conclusions
This is the first study that establishes a relationship between cytokine activation and molecular epidermal alterations as well as correlations between disease biomarkers in the skin and clinical improvement. The reversal of the molecular phenotype with CsA and the associated biomarkers can serve as a reference for the successful modulation of tissue inflammation with specific immune-antagonists in future studies, contributing to the understanding of the specific cytokines involved in epidermal pathology.
Keywords: atopic dermatitis, cyclosporine A, T-cell, immune, epidermal abnormalities, S100 proteins
Introduction
Although atopic dermatitis (AD) is the most common inflammatory skin disorder,1 therapeutic options for moderate-to-severe patients are limited.2–4 The AD phenotype has been associated with activation of inflammatory pathways and epidermal alterations (including hyperplasia, increased expression of S100 proteins, and differentiation abnormalities).2,4–7 It has been recently classified as a Th2/Th22-polarized disease, but Th1 and Th17 have been also proposed to contribute to pathogenesis.8–10 However, the relative roles of the immune and barrier elements in disease pathogenesis, and the extent to which their modulation is correlated with clinical improvement are not yet known.5–10
Cyclosporine (CsA) is a potent immunosuppressant that acts primarily on T-cells by inhibiting calcineurin, and thus signal transduction mediated by TCR activation. It has also been reported to affect B-cells and dendritic cells (DCs),11–14 and can also suppress some growth-related pathways in keratinocytes.15–17 The efficacy of CsA in AD has been demonstrated by numerous studies, and is considered by many as the treatment of choice for severe AD.18–23 However, its mechanism of action in AD is not established, and studies that correlate clinical improvement with changes in the immune and epidermal abnormalities in skin lesions are unavailable. Some studies, using blood from AD patients treated with CsA, found associations between therapeutic improvement and reduction of IFNγ/Th1 and IL-4/IL-13/IL-5/Th2 producing T-cells and associated products (i.e CCL17/TARC, IL-13, IL-4, IL-5, IL-31, IL-6, IL-8), with inconclusive data on Treg modulation.24–31 However, effects of CsA on T-cells in AD tissues, which show high levels of activation compared to circulating lymphocytes, have not been investigated. In psoriasis, reversal of the clinical and histologic phenotypes was strongly linked to suppression of Th1, Th17 and Th22 axes in skin lesions, establishing it as a primarily immune-driven disease.12 An in vitro T-cell model has recently demonstrated that in addition to the general immune-suppressive effects, CsA also directly inhibits IL-22 expression, possibly explaining its therapeutic benefit.32
Our recent investigations with NB-UVB demonstrated for the first time that clinical AD reversal is associated with reductions in the epidermal hyperplasia and inflammatory molecules.33 However, since NB-UVB has direct effects on regenerative hyperplasia, we were not able to definitively link the immune suppression with reversal of the barrier abnormalities.34 Using CsA, a broad immune-suppressant, we aimed to establish the ability of a systemic pharmacological treatment to modulate activation of the various immune axes involved in AD pathogenesis, and to reverse the associated epidermal pathology. This study links immune suppression with improvement in epidermal pathology, and establishes a set of biomarkers that correlate with clinical improvement.
Methods
Patients’ Characteristics and skin samples
Pre-treatment (week 0), week 2, and post-treatment (week 12) lesional (LS) and non-lesional (NL) (at least 1 cm from any active lesion) skin biopsies and blood samples were obtained from 19 patients with moderate-to-severe AD (12 males, 7 females, ages 18–69 years, median 45 years) who participated in an open label trial with 5 mg/kg/day CsA for 12 weeks under IRB-approved protocols. Patients were allowed to use emollients only with no other treatment during the study. Week 0, 2, and 12 LS and NL biopsies (from the same area) were obtained to evaluate for treatment effect. Disease severity was evaluated by Scoring of AD (SCORAD) at baseline, weeks 2 and 12. No heterozygous FLG mutations (R501X and 2282del4 allele) were found in the 6 Caucasian patients studied (Table E1, Supplementary Materials in Online Repository/OR).
Immunohistochemistry
IHC was performed on cryostat tissue sections using purified mouse anti-human monoclonal antibodies (Table E4).33,35 Epidermal thickness and positive cells per millimeter were quantified using computer-assisted image analysis software (ImageJ 1.42; National Institutes of Health, Bethesda, MD). The epidermal thickness measurement included all layers, including stratum corneum. Pathologic thickness was defined as pre-treatment LS minus NL epidermal thickness.33,35
Quantitative real-time (RT) PCR and gene-array analysis
RNA was extracted for RT-PCR, which was performed with EZ-PCR Core Reagents (Life Technologies, Grand Island, NY), and custom primers were generated as described.33 Affymetrix U133Plus 2.0 arrays (Affymetrix, Santa Clara, CA) were used for gene-arrays, as reported.33
Statistical Analysis
All 19 patients (including the two non-responders) were included in statistical analyses. Quality control of microarrays was carried out using standard QC metrics and R package microarray Quality Control.36 Images were scrutinized for spatial artifacts using Harshlight.37 Expression measures were obtained using GCRMA.38 Probe-sets with ≥3 samples, expression values >3, and standard deviation (SD)>0.1 were kept for further analyses. Expression values were modeled using mixed-effect models with fixed Time and Treatment factors and a random effect for each patient. Fold changes/FCHs for the comparisons of interest were estimated and hypothesis testing were conducted using contrasts under the general framework for linear models in limma package. P-values from the moderated (paired) t-test were adjusted for multiple hypotheses using the Benjamini–Hochberg procedure. Hierarchical Clustering were obtained using Euclidean distance and Mcquitty agglomeration scheme. RT-PCR analysis used log transformed expression values and similar mixed effect models. Spearman rank correlations were used to correlate clinical response with variables measured by RT-PCR and IHC.
Results
After 12 weeks of 5mg/kg/day of CsA, 17/19 patients met the therapeutic response criteria of SCORAD 50 (a decrease of ≥50% in SCORAD index). Pretreatment SCORAD ranged from 44 to 98 (mean 65.02, SD 15.86); week 2 ranged from 5.9 to 76 (mean 33.34, SD 19.87), and post-treatment from 0 to 59 (mean 17.90, SD 14.51). Two patients did not achieve SCORAD 50 (non-responders). Pre-treatment serum IgE levels were elevated in 12/19 patients (range 6–70, 530, median 1269, reference range 0–114 kU/L). Serum eosinophil levels were elevated in 10/19 patients (range 0.6–17%, mean 8%, reference range 0–7%). Mean reductions in SCORAD of 51% (SD 23) and 72% (SD 18) were observed at week 2 and week 12 (p<0.001, p<0.001), respectively (Figure E1B in Online Repository (OR)). There were no significant reductions in serum IgE and eosinophil levels (Figure E1C–D). Epidermal response was evaluated by comparing the thickness and keratinocyte proliferation markers (K16 and Ki67) at week 0, 2, and 12 in LS and NL biopsies (Figure 1A–D). Mean LS epidermal thickness at week 0 was 197% greater than NL (204.51μm versus 104.00μm, respectively) and was significantly reduced after 2 and 12 weeks of treatment (p<0.001), with a mean decrease of 90.2 (SD 14.77μm) at 12 weeks (a reduction of pathologic epidermal thickness of 79.70, (SD 21.18) (Figure 1C). We also detected reductions in epidermal thickness of NL skin (a mean decrease of 16.10um; SD 5.30). Significant reductions in Ki67 cell counts were observed in LS skin at week 2 and week 12 compared with baseline (p<0.001) (Figure 1D). 17/19 patients showed resolved suprabasilar K16 expression (not typically expressed in normal skin) in LS skin at week 12 versus K16-positivity in 19/19 pre-LS samples (Figure 1B). Significant reductions in K16 mRNAs were seen at week 2 and week 12 (p<0.001, p<0.001 respectively) (Figure 1E). Interestingly, the 2 patients that retained K16-positivity were different from the clinical non-responders. The mechanistic study was structured to determine whether CsA would “normalize” or improve the LS towards a NL AD phenotype.
Figure 1.
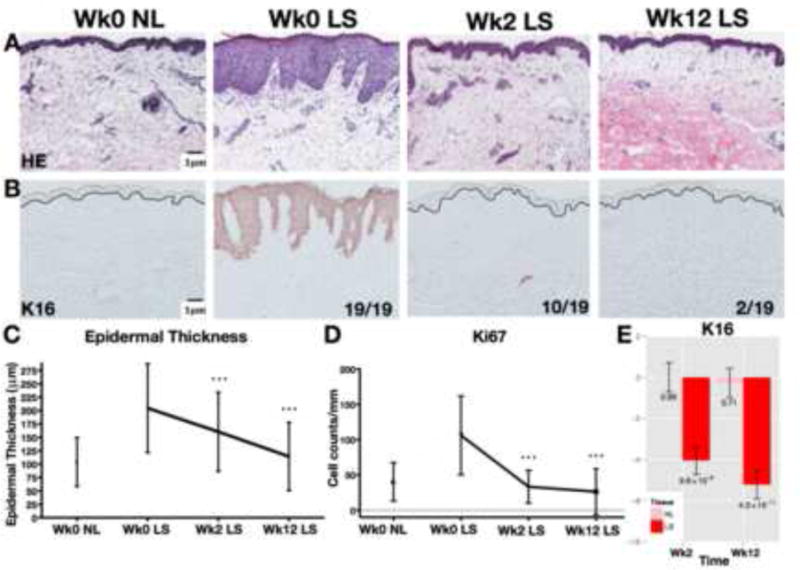
Representative staining with H&E (A) and proliferation marker K16 (B). All 19 LS samples were K16-positive at wk0 and only 2/19 LS samples retained positivity at wk12. Significant decreases in epidermal thickness (C), Ki67+ cell counts (D), and K16 mRNA expression (E) with CsA. Wk/week; LS/lesional; NL/non-lesional; FCH/fold-change; Mean±SD(C–D); Mean±SEM(E); post-versus-pre p-values *p<0.05/**p<0.01/***p<0.001
Suppression of inflammatory-cell infiltrates following CsA
We measured infiltrates of CD3+ T-cells, CD11c+ and CD83+ DCs and CD206+ inflammatory dendritic epidermal cells (IDECs) in LS and NL skin throughout treatment (Figure E2A–D). Marked reductions in LS skin infiltrating leukocytes occurred by 2 weeks of treatment, with subsequent reductions through week 12. Overall, cellular infiltrates in LS skin were reduced to levels measured in baseline NL skin (p<0.001) (Figure E2E–H).
Genomic Reversal of the AD phenotype with CsA treatment
Gene-arrays were performed to define the AD phenotype (the differentially-expressed genes/DEGs between LS and NL tissues, or the AD transcriptome) and to assess the effects of CsA on the transcriptome. In this study 519 up-regulated probes (399 genes) and 422 down-regulated probes (310 genes) defined the baseline AD transcriptome (FCH>2 and false discovery rate/FDR<0.05). Figure 2A illustrates the AD transcriptome at baseline and the changes induced by CsA at weeks 2 and 12. Significantly altered gene expression compared with baseline was observed in LS but also in NL skin (red to blue, or blue to red transition) as early as week 2, with some additional suppression at week 12. At week 12, post-LS and NL skin showed similar expression levels. 392 and 421 probes were up-regulated and 141 and 329 down-regulated at weeks 2 and 12, respectively (Table E2). The diminishing difference between LS and NL skin (where LS approaches NL) is represented in Figure 2B. Significant changes from the baseline expression of the transcriptome genes were already observed at week 2 (Figure 2B). Mean genomic improvements in the AD transcriptome of 84% and 106% were seen, with reductions of 97% and 109% in up-regulated, and increases of 68% and 102% in down-regulated genes at weeks 2 and 12, respectively, paralleling significant respective decreases in SCORAD (Figures E3B and Figure E1B, Table E2).
Figure 2.
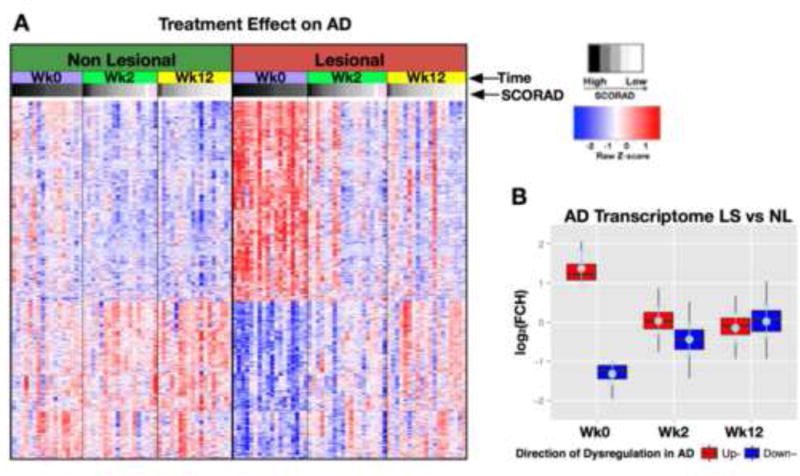
Genomic differences in patients with AD before and after CsA treatment. Significant changes in differentially-expressed genes/DEGs defining the AD transcriptome (A) occur by wk2 in NL and LS skin (B). Heatmaps are arranged by patient SCORAD (white-to-black gradient); pink=patients with unknown SCORAD. Red/upregulated; Blue/downregulated; AD/atopic dermatitis; Wk/week; LS/lesional; NL/non-lesional; FCH/fold-change.
Major Suppression of Epidermal Proliferation and Inflammatory Pathways with CsA at week 2 by gene-arrays
A large set of genes were significantly modulated by CsA treatment on gene-arrays at week 2, with smaller changes observed between weeks 2 and 12 (Table E2). Among the most significantly down-regulated genes with CsA were general inflammatory markers (MMP12, S100A12), markers of T-cells (granzyme B, CTLA4, CD28), Th2 and eosinophil attracting chemokines (CCL18, CCL17, CCL22, CCL13), Th17/Th22 related S1007, A8, A9, Th1/interferon-related products (OASL, CXCL10, CXCL9, STAT1), Th17 related products (CXCL1, CXCL2, PI3/Elafin, lipocalin 2/LCN2), and DC antigens (CD1b, CD209). Markers of epidermal proliferation (Mki67, K16) were also among the top down-regulated genes. Several immune markers, among which major Th2 (i.e CCL17, CCL22) chemokines, IL-17/IL-22 related genes (i.e LCN2, S100s), and others, showed comparable or even sometimes higher suppression from baseline levels at week 2 compared to week 12. Structural and lipid metabolism (lipoprotein lipase, leptin, thyroid hormone responsive) and barrier genes (i.e the tight junction gene claudin 8) showed significant up-regulation from baseline expression levels mostly evident only at week 12. The NL skin also showed significant changes in key AD genes at week 12 (Table E2).
CsA Induces Broad Suppression of Inflammatory Pathways by gene-arrays and RT-PCR
A predicted effect of CsA would be to strongly reduce expression of T-cell derived cytokines and downstream inflammatory pathways regulated by immune cytokines. Figure E3A shows changes in an immune subset within the AD transcriptome in LS and NL skin at weeks 2 and 12, whereas lower abundance genes were measured by RT-PCR (Figure 3, Table E3). Inflammation is well illustrated by up-regulation (red) of inflammatory genes in LS skin, and variably in NL skin, appearing stronger in patients with higher SCORAD. Robust changes were observed in LS but also in NL skin (red to blue transition) already at week 2, with week 12 LS and NL skin showing similar expression levels (Figure E3A). Major T-cell, DC, and keratinocyte-related products (i.e IL-4R, JAK-3, ITGAX/CD11c+, CCL17, IL-7R, S100s, etc) that are increased in AD lesions, showed significantly decreased expression in LS and also NL skin at week 2 by gene arrays (Figure E3A, Table E2). Lesional, and variably also NL skin, contain activated populations of Th1, Th2, Th17, Th22, and Th9 T-cell subsets and increased inflammatory mediators as determined by increased mRNA production of representative cytokines and chemokines by RT-PCR8,35. General inflammatory markers (MMP12, S100A12) showed major mRNA decreases at week 12 compared with baseline expression in both LS and NL skin (Figure 3A–B). Strong, significant reductions were detected in IL-13, IL-19 (shown to induce the Th2 cytokines IL-4/IL-13)39, IL-9, and IL-22 mRNAs at week 2 (p<0.001) (Figure 3C–D, H–I) with lesser effects on IFNγ and IL-17 mRNAs (Figure 3M,T). Inflammatory products regulated by these cytokines, especially Th2-related chemokines (CCL13, CCL17, CCL18), and the IL-22/IL-17 regulated S100A7, A8, and A9 proteins8,40 are strongly down-regulated at week 2 (p<0.01) (Figure 3E–G, J–L). Evident S100 responses are also suggested by reversal of epidermal S100A7 protein expression on IHC in LS post-treatment biopsies (Figure E4A) Few Th2-related molecules showed only modest modulation (IL-5, IL-31, CCL26) and IL-25 was decreased only in NL skin (Figure E5). Significant reductions in CXCL1, CCL20, PI3, and IL-8 are also measured at week 2 (Figure 3V–X, S) potentially reflecting decreased signaling by IL-17 and/TNF (Figures E3A, Table E2). By week 12, larger or more significant reductions in some cytokine mRNAs are noted (i.e IL-17A). Although only NL skin shows significant reductions in IFNγ mRNA at week 12, many IFN-regulated genes are reduced at this time (i.e CXCL9, CXCL10, STAT1, MX1) (Figures E3A and Figure 3). We found small increases in mRNAs of differentiation genes, particularly at week 2 (significant for filaggrin/FLG and periplakin/PPL, with a trend of increase for loricrin/LOR) (Figure E6), despite respective reductions in hyperplasia. Curiously a significant decrease in LOR was observed in NL skin at week 12. A heatmap summary of all RT-PCR expression studies at weeks 2 and 12 illustrates the potent inhibition of inflammatory and epidermal proliferation markers (Figure 4).
Figure 3.
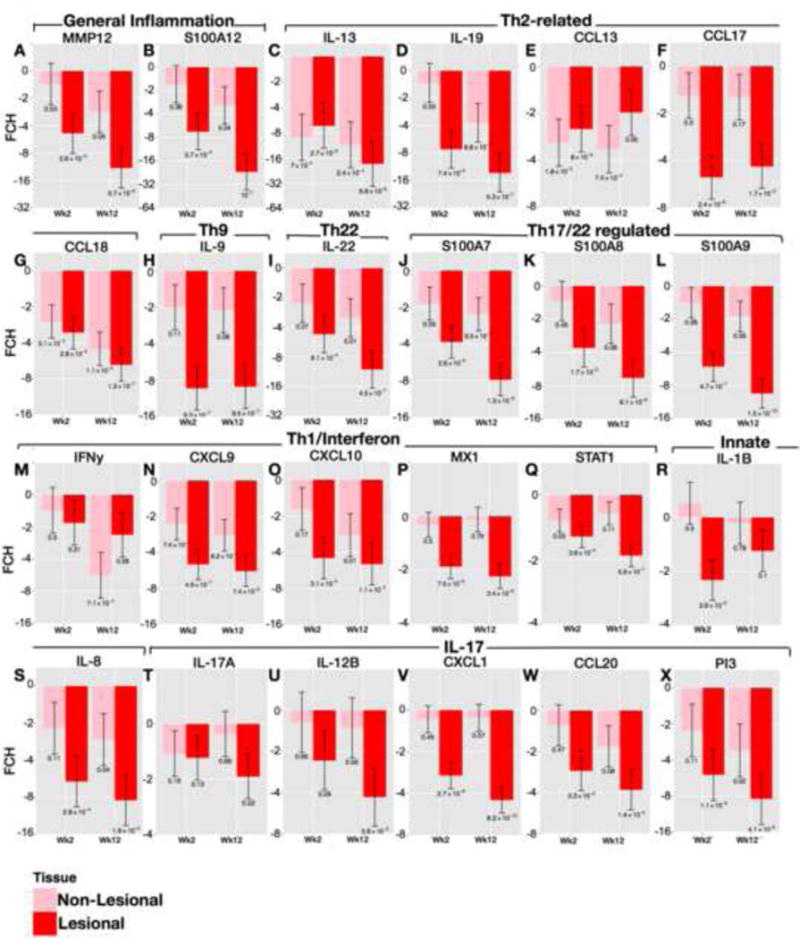
Significant down-regulation of inflammatory markers following CsA in AD skin as quantified by real-time/RT-PCR. A–X) Post-versus-pre-treatment mRNA expression differences (FCHs) of selected genes, as grouped by the inflammatory pathway, in LS and NL AD at wks2 and 12 of treatment. Wk/week; FCH/fold-change; Mean±SEM with post-versus-pre p-values. See Table E3 in OR for confidence intervals.
Figure 4.
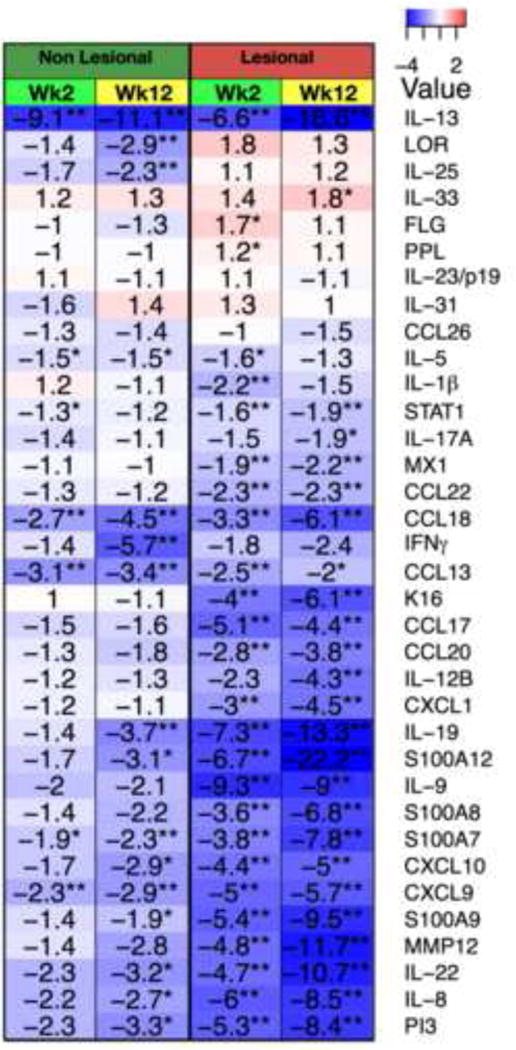
A summary heatmap of mRNA changes (RT-PCR) in wks2 and 12 LS and NL skin with fold-changes/FCHs (blue, red) Wk/week; post-versus-pre p-values *p<0.05/**p<0.01/***p<0.001.
Effects of CsA on Epidermal Differentiation
Before treatment, focal absence of a granular layer and parakeratosis are observed (Figure E4B). Post treatment LS skin has a continuous granular layer and normal appearing stratum corneum with restoration of orthokeratosis (Figure E4B). We also evaluated for FLG and LOR protein expression by IHC (Figure E4C–D). Pre-treatment LS expression of LOR and FLG is relatively faint, and inconsistent. In post-treatment biopsies these proteins show stronger expression, continuously expressed in the granular layer (Figure E4C–D).
Biomarkers that correlate with clinical improvement and reductions in epidermal hyperplasia
We have evaluated which markers are associated with clinical and histological disease reversal by determining the correlations of each variable measured in LS skin by IHC and RT-PCR with improvement in SCORAD (clinical disease reversal), and reduction in epidermal hyperplasia/thickness (histological disease reversal) (Table E4A–B).
Key Th2, Th22, but also Th1 and Th17-related markers were highly correlated with clinical improvement. These included IL-13, IL-22 cytokines and associated chemokines (S100A7, S100A9, S100A12/IL-22, and CCL17, CCL18, CCL22, CCL26/IL-13), and the Th1/IFN-related CXCL10 chemokine. Reductions in epidermal thickness and in CD3+ T-cells and DCs (CD83+ and CD206+) infiltrates were also significantly correlated with clinical improvement (Table E4A). The reduction in epidermal thickness was highly correlated with reductions in the proliferation marker/K16, inflammatory markers (MMP12, S100A12), Th2-related cytokines (IL-13, IL-19), and Th17/Th22-related genes (S100s, PI3), and also with elimination of CD83+ DCs (Table E4B).
We have also evaluated for major immune and epidermal markers that showed significant improvements across the CsA and NB-UVB treatments41 (Table 1). We found that hyperplasia and S100 response of the epidermis are highly reversible biomarkers of disease. Suppression of Th2 and Th22 cytokines is related to extent of S100 down-regulation in both treatments. Largest dynamic change in biomarkers include S100A12, S100A9, IL-13, IL-22, IL-19, MMP12 (all >10 FCH decrease with CsA), markers of hyperplasia (thickness, K16, Mki67), and cellular markers of T-cells and DCs (CD3, CD11c, CD206).
Table 1.
Disease Biomarkers Across CsA and NB-UVB treatment
| CsA | NB-UVB | |||||
|---|---|---|---|---|---|---|
| LS-NL (Wk0) |
Post-Pre (LS) |
% Improvement |
LS-NL (Wk0) |
Post-Pre (LS) |
% Improvement |
|
| IHC1 | ||||||
| ET(μm) | 100.5 | −90.2 | 90 | 159.1 | −140 | 88 |
| Ki67 | 66 | −79.8 | 121 | 34 | −40 | 118 |
| CD3 | 225.1 | −246.6 | 110 | 214.8 | −225.7 | 105 |
| CD11c | 155.8 | −182.6 | 117 | 46.6 | −24.4 | 53 |
| CD206 | 109.9 | −99.1 | 90 | 17.7 | −60.4 | 341 |
|
LS/NL (Wk0) |
Post/Pre (LS) |
% Improvement |
LS/NL (Wk0) |
Post/Pre (LS) |
% Improvement |
|
| RT-PCR2 | (FCH) | (FCH) | (FCH) | (FCH) | ||
| S100A12 | 6.5 | −22.2 | 165 | ND | ND | ND |
| IL-13 | 5.3 | −18.6 | 176 | 6 | −4 | 77 |
| IL-19 | 5.5 | −13.3 | 151 | ND | ND | ND |
| MMP12 | 3.2 | −11.7 | 209 | *8.6 | *−9.6 | 105 |
| IL-22 | 5.6 | −10.7 | 138 | 2.2 | −2.8 | 135 |
| S100A9 | 5.3 | −9.5 | 136 | *5.4 | *−4.6 | 90 |
| IL-9 | 4.5 | −9 | 146 | ND | ND | ND |
| PI3/Elafin | 3.8 | −8.4 | 159 | *4.4 | *−3.5 | 84 |
| S100A7 | 3.7 | −7.8 | 157 | 4.9 | −3 | 53 |
| S100A8 | 3.4 | −6.8 | 158 | 2.3 | −1.8 | 73 |
| CCL18 | 2 | −6.1 | 265 | 5.9 | −6.3 | 104 |
| K16 | 5.6 | −6.1 | 105 | 6.1 | −2.8 | 59 |
| CXCL10 | 1.6 | −5 | 341 | *2.3 | *−3.1 | 76 |
| CXCL1 | 3 | −4.5 | 137 | *3.3 | *−1.3 | 92 |
| CCL17 | 2.6 | −4.4 | 153 | 3.5 | −2.9 | 86 |
| IL-12β3 | 2.8 | −4.3 | 142 | 1.4 | −1.4 | 100 |
IHC LS-NL data at Wk0 and post-pre (Wk12-Wk0) LS data is differences in cell counts or epidermal thickness (μm).
RT-PCR LS/NL data at Wk0, and post/pre (Wk12 vs Wk0) LS data is in FCHs.
Referred to as IL-23p40 in NB-UVB paper.
Data from gene arrays (RT-PCR data unavailable). % improvement is calculated using log2FCHs. ET/epidermal thickness; LS/lesional; NL/non-lesional; FCHs/fold changes; Wk/week; ND/not done. NB-UVB data from (Suarez-Farinas et al., J Allergy Clin Immunol 2013 131 (2):577–9).
A non-responder analysis was conducted between responders and non-responders, including significantly different markers as illustrated in Figure E7A–B. Despite lack of differences in inflammatory markers at week 2, the lack of response at week 12 was associated among non-responders with lack of improvement in key AD molecules, particularly the Th2/IL-13 and Th22/IL-22 cytokines, and the inflammatory marker MMP-12 (Figure E7B). The non-responders also showed lack of improvements in epidermal thickness, and DC markers (CD11c and CD206) (Figure E7A). The patients that retained K16 positivity after treatment but were clinical responders, showed intermediate cytokine modulation between non-responders and responders (data not shown).
Discussion
Whether AD is fundamentally a disease of barrier dysfunction or underlying immune activation is still debated,2,4 but evolving disease models link changes in growth and differentiation of epidermal keratinocytes to specific T-cell subsets and associated cytokines. AD lesions show increased leukocyte infiltration, production of inflammatory mediators, reactive epidermal hyperplasia in which S100 proteins are up-regulated,2,4,8–9 and suppression of terminal differentiation products (filaggrin, loricrin, etc).4,35,42 The Th2/IL-4/IL-13 and Th22/IL-22 cytokines are implicated as drivers of key pathogenic AD features.2,4,42–45 IL-22 has been linked to many aspects of epidermal pathology in AD, including inhibition of epidermal differentiation, induction of hyperplasia, and up-regulation of S100s, and has been strongly correlated with disease activity.33,40,46 IL-4/IL-13 have been reported to inhibit differentiation, production of antimicrobial peptides/AMPs,47–48 and Th17 activation,49 but have not previously been reported to promote epidermal hyperplasia.
CsA induces rapid clinical reversal, and is considered the “gold-standard” for inhibiting skin inflammation. This is the first comprehensive study of AD that establishes the ability of a systemic immune- suppressant to modulate the immune activation and epidermal aberrations that characterize the AD phenotype, and to correlate associated changes with clinical improvement. Rapid clinical responses were seen within 2 weeks of CsA treatment, associated with strong suppressions of immune and epidermal phenotypes. Clinical responses continued to improve significantly between weeks 2–12, paralleled by further reductions in IL-13, IL-22, and S100s mRNAs. CsA treatment resulted in large reductions in T-cell and DC infiltrates, by week 2, with further reductions at week 12. Suppression of all inflammatory axes was observed, with impressive reductions in Th2, Th22, and Th9-associated products, but also in some Th1/IFNγ and Th17-related markers. Strong inhibition of Th2-related products (IL-13, IL-19, CCL17, CCL18, CCL26) and the Th9 cytokine IL-9, were measured with treatment. Robust decreases in IL-22 gene expression and reductions in several IL-17-related genes (PI3, CXCL1) were also observed. Since IL-22 and IL-17 synergistically regulate S100A7-9, the marked reductions in these molecules with CsA, are likely related to suppression of these cytokines. When changes induced by CsA in our AD study are compared to those reported in psoriasis patients12 there is overall similar suppression of general inflammatory markers (S100A12, MMP12), and interferonγ/Th1 axis genes (CXCL10) (Table E6). However, while in psoriasis patients there is higher suppression of the Th17 axis and both subunits of IL-23/p40 and p19, AD patients show higher inhibition of IL-22, and significant down-regulation of the Th2 axis that has not been measured in psoriasis.
Regenerative hyperplasia was also reversed with CsA, as indicated by strong reductions in epidermal thickness and proliferation markers (K16 and Ki67). Cytokines and growth factors known to regulate epidermal hyperplasia (i.e. IL-19, IL-22, FGF, VEGF) were strongly down-regulated by CsA. Furthermore, the suppression of Th2/IL-13, IL-19 and IL-22/IL-17-modulated genes (i.e S100A7-9, PI3/elafin) was correlated with the reduction in the pathologic epidermal hyperplasia. We also found small mRNA increases in differentiation genes (i.e FLG, LOR, and PPL) with CsA treatment, coupled with parallel stronger protein expressions, orthokeratosis and restoration of granular layer by IHC, suggesting that the regenerative hyperplasia is turned off with treatment.
In comparison to our prior NB-UVB study,33,41 CsA resulted in greater, and more significant improvements in the immune and epidermal phenotypes, with highly significant decreases already evident at week 2. The effects of CsA in our data also extend to NL skin, which shows similar but milder reversal of the inflammatory and epidermal components. The improvement in NL skin was not seen in our NB-UVB study in which the inhibitory effects were mostly limited to LS skin.33
In this study, we have established robust genomic and cellular signatures of successful suppression of the AD phenotype after CsA treatment that can be used as a point of comparison for future studies with targeted therapeutics. This study defines a broad set of biomarkers that correlate with clinical disease improvement and/or the suppression of pathological hyperplasia. We have also outlined a set of biomarkers across both CsA and NB-UVB treatments that contain key pathogenic elements of AD, including Th2, and Th22 cytokines and chemokines, S100 proteins, and epidermal markers, which could serve as a reference for effectiveness analyses in future trials (Table 1).
Our data support the model of cytokine-induced alterations in keratinocytes that includes induction of S100 proteins by IL-22 and IL-17, and the negative effects of IL-4/IL-13 on epidermal differentiation.2 However, absolute proof of immune-mediated pathogenesis is not possible since CsA has some direct effects on keratinocytes.50,51 Future studies with specific immune antagonists are needed to determine the contribution of specific cytokines to the pathologic epidermal phenotype. We are now experiencing an exciting new era in AD, with narrow-targeted therapeutics entering clinical trials.52–54 Reversal of the molecular disease phenotype with CsA and the associated response biomarkers will thus be valuable as a point of reference for assessing the modulation of tissue inflammation in current and future AD studies.
Supplementary Material
Supplementary Figure E1. A) Photographs from a representative patient at wks 0, 2, and 12 after cyclosporine 5mg/kg/day treatment. B) Significant reductions in SCORAD of 50.89% and 73.44% were observed at wks 2 and 12 after CsA. C) Total IgE and (D) eosinophil serum levels at wks 2 and 12 of CsA. pre vs post p-values are indicated. Wk/week; Mean±SEM
Supplementary Figure E2. Reductions in cellular infiltrates by immunohistochemistry, in lesional/LS and non-lesional/NL atopic dermatitis at wks 2 and 12 of CsA. Representative staining is shown, with significant reductions in CD3+ T-cells (A,E), myeloid/CD11c+ (B,F), CD206+ (C,G), and mature/CD83+ dendritic cells (D,H) at wks2 and 12. Wk/week; Mean±SD, *p<0.05/**p<0.01/***p<0.001
Supplementary Figure E3. Changes in a transcriptome subset of immune genes (A). AD transcriptome improves by 84.25% and 105.95% at wks 2 and 12 respectively (B). Red/upregulated; Blue/downregulated; Wk/week; AD/atopic dermatitis. Heatmap is arranged by patient SCORAD (white to black gradient) pink = patients with unknown SCORAD.
Supplementary Figure E4. Representative S100A7 staining at wks 0 and 12 LS and NL skin (A). Representative 40× magnification H&E (B), arrow points to absence of granular layer at wk 0 and restoration 24 of granular layer at wk 12. Representative IHC of C) filaggrin and D) loricrin after treatment in LS and NL AD (n=5/antibody). Wk/week; LS/lesional; NL/non lesional; AD/atopic dermatitis; FLG/filaggrin; LOR/loricrin.
Supplementary Figure E5. Quantitative RT-PCR of several Th2-related cytokines. A–D) mRNA differences from baseline expression levels (fold-changes/FCHs) in lesional/LS and non-lesional/NL skin at wks2 and 12 of treatment. Wk/week; pre vs post p-values are indicated; Mean±SEM
Supplementary Figure E6. Small increases in mRNA expression of differentiation genes filaggrin/FLG (A), loricrin/LOR (B) and periplakin/PPL (C), particularly at wk2. FCH/fold changes; Wk/week; pre vs post p-values are indicated; Mean±SEM
Supplementary Figure E7. Comparison of selected cellular (A) and genomic (B) biomarkers between non-responders and responders at weeks 2 (W2) and 12 (W12) of treatment. Color corresponds to treatment effect on LS skin (W12 vs W0) in responders. Y-axis shows differences between responders and non-responders. For example, IL-13 decreased by 5.1 log2FCH at W12 in the responder group, whereas it only slightly increased by 0.5 log2FCH in the non-responder group, corresponding to a difference of 5.6 between the two groups. W/week; LS/lesional; FCH/fold change
Supplementary Figure E8. Scatterplots corresponding 47 to the top Spearman correlations in Table E4A–B.
Supplementary Table E1. Demographic data of the atopic dermatitis patients enrolled in this study, including gender, patient age, race, SCORAD, total serum IgE, and % eosinophils at baseline, wks 2 and 12, and filaggrin mutation status. Wk/Week; Scoring of AD/SCORAD.
Supplementary Table E2. Effects of CsA on the AD transcriptome. The FCHs, log2FCHs, p-values, and status (1=up-regulated, −1=down-regulated, 0=not differentially expressed) are indicated for each comparison, including post versus pre-treatment values at wks 2 and 12 for LS and NL skin, and LS versus NL skin at wks 2 and 12. DEGs/differentially-expressed genes; LS/lesional; NL/non-lesional; FCH/fold change.
Supplementary Table E3. Average mRNA expression values and confidence interval values corresponding with Figure 3.
Supplementary Table E4. LS skin biomarkers significantly correlated with improvement in the SCORAD index following CsA. Spearman rank correlations were determined for all evaluated biomarkers quantified by immunohistochemistry (denoted by “I”) and real-time-PCR (RT-PCR) (denoted by “R”) with reduction in SCORAD (A) and epidermal 69 thickness (B) following treatment. FDR <0.03 (A) and <0.02 (B).
Supplementary Table E5. Antibodies (with specific vendor, clone, isotype, and dilution value) used in immunohistochemistry.
Supplementary Table E6. Comparison of mRNA expression differences (FCHs) in pre (Wk0) and post (Wk12 or D56) LS skin biopsies from psoriasis and atopic dermatitis patients treated with CsA. Psoriasis data is from (Haider et al., J Immunol 2008 180(3):1913–20) AD/atopic dermatitis; PsO/psoriasis; LS/lesional; Wk/week; D/day; FCH/fold change; ND/not done.
Clinical Implications.
Alternative approaches to inhibiting T-cell derived cytokines could produce better-tolerated long-term therapies for patients with moderate-to-severe atopic dermatitis.
Acknowledgments
We thank Novartis for providing CsA/Neoral drug supply for the whole study period for all of the patients treated in the United States.
Funding: JGK, MSF, MR, TC and ND were supported by grant number 5UL1RR024143-02 from the National Center for Research Resources (NCRR), a component of the NIH, and NIH Roadmap for Medical Research. E.G.Y was supported by the Dermatology Foundation Physician Scientist Career Development Award and by a CTSA grant from the Rockefeller University.
Abbreviations
- AD
Atopic dermatitis
- AMP
Antimicrobial peptide
- CsA
Cyclosporine
- CCL2
chemokine, CC motif, ligand 2/ Monocyte Chemotactic and Activating Factor (MCAF)
- CCL13
chemokine, CC motif, ligand 13/ Monocyte Chemotactic Protein 4 (MCP4)
- CCL17
chemokine, CC motif, ligand 17/ Thymus and Activation-Regulated Chemokine (TARC)
- CCL18
chemokine, CC motif, ligand 18/ Pulmonary and Activation-Regulated Chemokine (PARC)
- CCL20
chemokine, CC motif, ligand 20/ Macrophage Inflammatory Protein 3-alpha (MIP3A)
- CCL22
chemokine, CC motif, ligand 22/ Macrophage-derived chemokine (MDC)
- CCL26
chemokine, CC motif, ligand 26/ Eotaxin 3
- CTLA4
Cytotoxic T-Lymphocyte Antigen 4
- CXCL1
Chemokine, CXC motif, Ligand 1/ Melanoma growth stimulating activity (MGSA)
- CXCL2
Chemokine, CXC motif, Ligand 2/ Macrophage inflammatory protein 2-alpha (MIP2-alpha)
- CXCL9
Chemokine, CXC motif, Ligand 9/ Monokine induced by gamma interferon (MIG)
- CXCL10
Chemokine, CXC motif, Ligand 10/ Interferon-gamma inducible protein 10 (IP10)
- DC
Dendritic cell
- DEG
Differentially expressed genes
- FCH
Fold change
- FDR
False discovery rate
- FGF
Fibroblast growth factor
- FLG
Filaggrin
- IDEC
Inflammatory dendritic epidermal cell
- IFNγ
Interferon gamma
- IgE
Immunoglobulin E
- IHC
Immunohistochemistry
- IL
Interleukin
- IL4R
Interleukin 4 Receptor
- IL7R
Interleukin 7 Receptor
- IL12Rβ2
Interleukin 12 Receptor β2
- IRF-1
Interferon Regulatory Factor 1
- ITGAX
Integrin alpha X/CD11c
- K16
Keratin 16
- LCN2
Lipocalin-2
- LOR
Loricrin
- LS
Lesional
- MMP12
Matrix metalloproteinase 12
- MX1
Myxovirus resistance 1
- NB-UVB
narrow band ultraviolet B
- NL
Non lesional
- OASL
2′-5′ oligoadenylate synthetase like
- PI3
Peptidase inhibitor 3
- PPL
Periplakin
- RT-PCR
Real-time PCR
- S100A
S100-Calcium binding protein
- SCORAD
SCORing of Atopic Dermatitis
- SD
Standard deviation
- SEM
standard error of the mean
- STAT1
Signal Transducers and Activators of Transcription
- TARC
Thymus and Activation Regulated Chemokine
- TCR
T-cell receptor
- Th1
Type 1 Helper T-cell
- Th17
Type 17 Helper T-cell
- Th2
Type 2 Helper T-cell
- Th22
Type 22 Helper T-cell
- Treg
regulatory T cells
- UV
Ultraviolet
- VEGF
Vascular Endothelial Growth Factor
Footnotes
Publisher's Disclaimer: This is a PDF file of an unedited manuscript that has been accepted for publication. As a service to our customers we are providing this early version of the manuscript. The manuscript will undergo copyediting, typesetting, and review of the resulting proof before it is published in its final citable form. Please note that during the production process errors may be discovered which could affect the content, and all legal disclaimers that apply to the journal pertain.
Disclosures: The authors have declared that they have no conflict of interest.
References
- 1.Chamlin SL, Chren MM. Quality-of-life outcomes and measurement in childhood atopic dermatitis. Immunol Allergy Clin North Am. 2010;30(3):281–8. doi: 10.1016/j.iac.2010.05.004. [DOI] [PMC free article] [PubMed] [Google Scholar]
- 2.Guttman-Yassky E, Nograles KE, Krueger JG. Contrasting pathogenesis of atopic dermatitis and psoriasis–part II: immune cell subsets and therapeutic concepts. J Allergy Clin Immunol. 2011;127(6):1420–32. doi: 10.1016/j.jaci.2011.01.054. [DOI] [PubMed] [Google Scholar]
- 3.Guttman-Yassky E, Dhingra N, Leung DY. New era of biologic therapeutics in atopic dermatitis. Expert Opin Biol Ther. 2013;13(4):549–61. doi: 10.1517/14712598.2013.758708. [DOI] [PMC free article] [PubMed] [Google Scholar]
- 4.Guttman-Yassky E, Nograles KE, Krueger JG. Contrasting pathogenesis of atopic dermatitis and psoriasis–part I: clinical and pathologic concepts. J Allergy Clin Immunol. 2011;127(5):1110–8. doi: 10.1016/j.jaci.2011.01.053. [DOI] [PubMed] [Google Scholar]
- 5.Fartasch M, Diepgen TL. The barrier function in atopic dry skin. Disturbance of membrane-coating granule exocytosis and formation of epidermal lipids? Acta Derm Venereol Supp. 1992;176:26–31. [PubMed] [Google Scholar]
- 6.Imokawa G, Abe A, Jin K, Higaki Y, Kawashima M, Hidano A. Decreased level of ceramides in stratum corneum of atopic dermatitis: an etiologic factor in atopic dry skin? J Invest Dermatol. 1991;96(4):523–6. doi: 10.1111/1523-1747.ep12470233. [DOI] [PubMed] [Google Scholar]
- 7.Kim BE, Leung DY. Epidermal barrier in atopic dermatitis. J All Asthma Immunol Res. 2012;4(1):12–6. doi: 10.4168/aair.2012.4.1.12. [DOI] [PMC free article] [PubMed] [Google Scholar]
- 8.Gittler JK, Shemer A, Suarez-Farinas M, Fuentes-Duculan J, Gulewicz KJ, Wang CQ, et al. Progressive activation of T(H)2/T(H)22 cytokines and selective epidermal proteins characterizes acute and chronic atopic dermatitis. J Allergy Clin Immunol. 2012;130(6):1344–54. doi: 10.1016/j.jaci.2012.07.012. [DOI] [PMC free article] [PubMed] [Google Scholar]
- 9.Suarez-Farinas M, Dhingra N, Gittler J, Shemer A, Cardinale I, de Guzman Strong C, et al. Intrinsic atopic dermatitis shows similar TH2 and higher TH17 immune activation compared with extrinsic atopic dermatitis. J Allergy Clin Immunol. 2013;132(2):361–70. doi: 10.1016/j.jaci.2013.04.046. [DOI] [PMC free article] [PubMed] [Google Scholar]
- 10.Koga C, Kabashima K, Shiraishi N, Kobayashi M, Tokura Y. Possible pathogenic role of Th17 cells for atopic dermatitis. J Invest Dermatol. 2008;128(11):2625–30. doi: 10.1038/jid.2008.111. [DOI] [PubMed] [Google Scholar]
- 11.Tsuda K, Yamanaka K, Kitagawa H, Akeda T, Naka M, Niwa K, et al. Calcineurin inhibitors suppress cytokine production from memory T cells and differentiation of naive T cells into cytokine-producing mature T cells. PloS One. 2012;7(2):e31465. doi: 10.1371/journal.pone.0031465. [DOI] [PMC free article] [PubMed] [Google Scholar]
- 12.Haider AS, Lowes MA, Suarez-Farinas M, Zaba LC, Cardinale I, Khatcherian A, et al. Identification of cellular pathways of “type 1,” Th17 T cells, and TNF- and inducible nitric oxide synthase-producing dendritic cells in autoimmune inflammation through pharmacogenomic study of cyclosporine A in psoriasis. J Immunol. 2008;180(3):1913–20. doi: 10.4049/jimmunol.180.3.1913. [DOI] [PubMed] [Google Scholar]
- 13.Brandt C, Pavlovic V, Radbruch A, Worm M, Baumgrass R. Low-dose cyclosporine A therapy increases the regulatory T cell population in patients with atopic dermatitis. Allergy. 2009;64(11):1588–96. doi: 10.1111/j.1398-9995.2009.02054.x. [DOI] [PubMed] [Google Scholar]
- 14.Tajima K, Amakawa R, Ito T, Miyaji M, Takebayashi M, Fukuhara S. Immunomodulatory effects of cyclosporin A on human peripheral blood dendritic cell subsets. J Immunol. 2003;108(3):321–8. doi: 10.1046/j.1365-2567.2003.01585.x. [DOI] [PMC free article] [PubMed] [Google Scholar]
- 15.Smit NP, Van Rossum HH, Romijn FP, Sellar KJ, Breetveld M, Gibbs S, Van Pelt J. Calcineurin activity and inhibition in skin and epidermal cell cultures. J Invest Dermatol. 2008;128(7):1686–90. doi: 10.1038/sj.jid.5701244. [DOI] [PubMed] [Google Scholar]
- 16.Kashyap T, Rabinovitz I. The calcium/calcineurin pathway promotes hemidesmosome stability through inhibition of β4 integrin phoshorylation. J Biol Chem. 2012;287(39):32440–9. doi: 10.1074/jbc.M112.385245. [DOI] [PMC free article] [PubMed] [Google Scholar]
- 17.Aizu T, Tamai K, Nakano H, Rokunohe D, Toyomaki Y, Uitto J, Sawamura D. Calcineurin/NFAT dependent regulation of 230 kDa bullous pemphigoid antigen (BPAG1) gene expression in normal human epidermal keratinocytes. J Dermatol Sci. 2008;51(1):45–51. doi: 10.1016/j.jdermsci.2008.01.006. [DOI] [PubMed] [Google Scholar]
- 18.BuBmann C, Bieber T, Novak N. Systemic therapeutic options for severe atopic dermatitis. J Dtsch Dermatol Ges. 2009;7(3):205–19. doi: 10.1111/j.1610-0387.2008.06834.x. [DOI] [PubMed] [Google Scholar]
- 19.Hijnen DJ, ten Berge O, Timmer-de Mik L, Bruijnzeel-Koomen CA, de Bruin-Weller MS. Efficacy and safety of long-term treatment with cyclosporin A for atopic dermatitis. J Eur Acad Dermatol Venereol. 2007;21(1):85–9. doi: 10.1111/j.1468-3083.2006.01877.x. [DOI] [PubMed] [Google Scholar]
- 20.Sowden JM, Berth-Jones J, Ross JS, Motley RJ, Marks R, Finlay AY, et al. Double-blind, controlled, crossover study of cyclosporin in adults with severe refractory atopic dermatitis. Lancet. 1991;338(8760):137–40. doi: 10.1016/0140-6736(91)90134-b. [DOI] [PubMed] [Google Scholar]
- 21.Munro CS, Higgins EM, Marks JM, Daly BM, Friedmann PS, Shuster S. Cyclosporin A in atopic dermatitis: therapeutic response is dissociated from effects on allergic reactions. Br J Dermatol. 1991;124(1):43–8. doi: 10.1111/j.1365-2133.1991.tb03280.x. [DOI] [PubMed] [Google Scholar]
- 22.Granlund H, Erkko P, Sinisalo M, Reitamo S. Cyclosporin in atopic dermatitis: time to relapse and effect of intermittent therapy. Br J Dermatol. 1995;132(1):106–12. doi: 10.1111/j.1365-2133.1995.tb08633.x. [DOI] [PubMed] [Google Scholar]
- 23.Granlund H, Erkko P, Reitamo S. Long-term follow-up of eczema patients treated with cyclosporine. Acta Derm Venereol. 1998;78(1):40–3. doi: 10.1080/00015559850135814. [DOI] [PubMed] [Google Scholar]
- 24.Hijnen D, Haeck I, van Kraats AA, Nijhuis E, de Bruin-Weller MS, Bruijnzeel-Koomen CA, et al. Cyclosporin A reduces CD4(+)CD25(+) regulatory T-cell numbers in patients with atopic dermatitis. J Allergy Clin Immunol. 2009;124(4):856–8. doi: 10.1016/j.jaci.2009.07.056. [DOI] [PubMed] [Google Scholar]
- 25.Baumgrass R, Brandt C, Wegner F, Abdollahnia M, Worm M. Low-dose, but not high-dose, cyclosporin A promotes regulatory T-cell induction, expansion, or both. J Allergy Clin Immunol. 2010;126(1):183–4. doi: 10.1016/j.jaci.2010.04.032. author reply 4. [DOI] [PubMed] [Google Scholar]
- 26.Otsuka A, Tanioka M, Nakagawa Y, Honda T, Ikoma A, Miyachi Y, et al. Effects of cyclosporine on pruritus and serum IL-31 levels in patients with atopic dermatitis. Eur J Dermatol. 2011;21(5):816–7. doi: 10.1684/ejd.2011.1470. [DOI] [PubMed] [Google Scholar]
- 27.Farrell AM, Antrobus P, Simpson D, Powell S, Chapel HM, Ferry BL. A rapid flow cytometric assay to detect CD4+ and CD8+ T-helper (Th) 0, Th1 and Th2 cells in whole blood and its application to study cytokine levels in atopic dermatitis before and after cyclosporin therapy. Br J Dermatol. 2001;144(1):24–33. doi: 10.1046/j.1365-2133.2001.03948.x. [DOI] [PubMed] [Google Scholar]
- 28.Hijnen D, De Bruin-Weller M, Oosting B, Lebre C, De Jong E, Bruijnzeel-Koomen C, et al. Serum thymus and activation-regulated chemokine (TARC) and cutaneous T cell- attracting chemokine (CTACK) levels in allergic diseases: TARC and CTACK are disease-specific markers for atopic dermatitis. J Allergy Clin Immunol. 2004;113(2):334–40. doi: 10.1016/j.jaci.2003.12.007. [DOI] [PubMed] [Google Scholar]
- 29.Bunikowski R, Gerhold K, Brautigam M, Hamelmann E, Renz H, Wahn U. Effect of low-dose cyclosporin a microemulsion on disease severity, interleukin-6, interleukin-8 and tumor necrosis factor alpha production in severe pediatric atopic dermatitis. Int Arch Allergy Immunol. 2001;125(4):344–8. doi: 10.1159/000053836. [DOI] [PubMed] [Google Scholar]
- 30.Bunikowski R, Staab D, Kussebi F, Brautigam M, Weidinger G, Renz H, et al. Low-dose cyclosporin A microemulsion in children with severe atopic dermatitis: clinical and immunological effects. Pediatr Allergy Immunol. 2001;12(4):216–23. doi: 10.1034/j.1399-3038.2001.012004216.x. [DOI] [PubMed] [Google Scholar]
- 31.Furukawa H, Nakamura K, Zheng X, Tojo M, Oyama N, Akiba H, et al. Enhanced TARC production by dust-mite allergens and its modulation by immunosuppressive drugs in PBMCs from patients with atopic dermatitis. J Derm Sci. 2004;35(1):35–42. doi: 10.1016/j.jdermsci.2004.02.008. [DOI] [PubMed] [Google Scholar]
- 32.Rudloff I, Bachmann M, Pfeilschifter J, Muhl H. Mechanisms of rapid induction of interleukin-22 in activated T cells and its modulation by cyclosporin a. J Biol Chem. 2012;287(7):4531–43. doi: 10.1074/jbc.M111.286492. [DOI] [PMC free article] [PubMed] [Google Scholar]
- 33.Tintle S, Shemer A, Suarez-Farinas M, Fujita H, Gilleaudeau P, Sullivan-Whalen M, et al. Reversal of atopic dermatitis with narrow-band UVB phototherapy and biomarkers for therapeutic response. J Allergy Clin Immunol. 2011;128(3):583–93. e1–4. doi: 10.1016/j.jaci.2011.05.042. [DOI] [PMC free article] [PubMed] [Google Scholar]
- 34.Reigh A, Medrek K. Effects of narrow band UVB (311 nm) irradiation on Epidermal Cells. Int J Mol Sci. 2013;14(4):8456–66. doi: 10.3390/ijms14048456. [DOI] [PMC free article] [PubMed] [Google Scholar]
- 35.Suarez-Farinas M, Tintle SJ, Shemer A, Chiricozzi A, Nograles K, Cardinale I, et al. Nonlesional atopic dermatitis skin is characterized by broad terminal differentiation defects and variable immune abnormalities. J Allergy Clin Immunol. 2011;127(4):954–64. e1–4. doi: 10.1016/j.jaci.2010.12.1124. [DOI] [PMC free article] [PubMed] [Google Scholar]
- 36.http://www.Rproject.org
- 37.Suarez-Farinas M, Pellegrino M, Wittkowski KM, Magnasco MO. Harshlight: a “corrective make-up” program for microarray chips. BMC bioinformatics. 2005;6:294. doi: 10.1186/1471-2105-6-294. [DOI] [PMC free article] [PubMed] [Google Scholar]
- 38.Wu Z, Irizarry R, Gentleman R, Murillo F, Spencer F. A model-based background adjustment for oligonucleotide expression arrays. J Am Stat Assoc. 2004;(99):909–17. [Google Scholar]
- 39.Liao SC, Cheng YC, Wang YC, et al. IL-19 induced Th2 cytokines and was upregulated in asthma patients. J Immunol. 2004;173(11):6712–8. doi: 10.4049/jimmunol.173.11.6712. [DOI] [PubMed] [Google Scholar]
- 40.Nograles KE, Zaba LC, Guttman-Yassky E, Fuentes-Duculan J, Suarez-Farinas M, Cardinale I, et al. Th17 cytokines interleukin (IL)-17 and IL-22 modulate distinct inflammatory and keratinocyte-response pathways. Br J Dermatol. 2008;159(5):1092–102. doi: 10.1111/j.1365-2133.2008.08769.x. [DOI] [PMC free article] [PubMed] [Google Scholar]
- 41.Suarez-Farinas M, Gittler JK, Shemer A, Cardinale I, Krueger JG, Guttman-Yassky E. Residual genomic signature of atopic dermatitis despite clinical resolution with narrow-band UVB. J Allergy Clin Immunol. 2013;131(2):577–9. doi: 10.1016/j.jaci.2012.11.010. [DOI] [PubMed] [Google Scholar]
- 42.Howell MD, Kim BE, Gao P, Grant AV, Boguniewicz M, Debenedetto A, et al. Cytokine modulation of atopic dermatitis filaggrin skin expression. J Allergy Clin Immunol. 2007;120(1):150–5. doi: 10.1016/j.jaci.2007.04.031. [DOI] [PMC free article] [PubMed] [Google Scholar]
- 43.Eyerich K, Novak N. Immunology of atopic eczema: overcoming the Th1/Th2 paradigm. Allergy. 2013;68(8):974–82. doi: 10.1111/all.12184. [DOI] [PubMed] [Google Scholar]
- 44.Sehra S, Yao Y, Howell MD, Nguyen ET, Kansas GS, Leung DY, et al. IL-4 regulates skin homeostasis and the predisposition toward allergic skin inflammation. J Immunol. 2010;184(6):3186–90. doi: 10.4049/jimmunol.0901860. [DOI] [PMC free article] [PubMed] [Google Scholar]
- 45.Boguniewicz M, Leung DY. Atopic dermatitis: a disease of altered skin barrier and immune dysregulation. Immunol Rev. 2011;242(1):233–46. doi: 10.1111/j.1600-065X.2011.01027.x. [DOI] [PMC free article] [PubMed] [Google Scholar]
- 46.Nograles KE, Zaba LC, Shemer A, Fuentes-Duculan J, Cardinale I, Kikuchi T, et al. IL-22-producing “T22”T cells account for upregulated IL-22 in atopic dermatitis despite reduced IL-17-producing TH17 Tcells. J Allergy Clin Immunol. 2009;123(6):1244–52. doi: 10.1016/j.jaci.2009.03.041. [DOI] [PMC free article] [PubMed] [Google Scholar]
- 47.Kim BE, Leung DY, Boguniewicz M, Howell MD. Loricrin and involucrin expression is down-regulated by Th2 cytokines through STAT-6. J Clin Immunol. 2008;126(3):332–7. doi: 10.1016/j.clim.2007.11.006. [DOI] [PMC free article] [PubMed] [Google Scholar]
- 48.Howell MD, Fairchild HR, Kim BE, Bin L, Boguniewicz M, Redzic JS, et al. Th2 cytokines act on S100/A11 to downregulate keratinocyte differentiation. J Invest Dermatol. 2008;128(9):2248–58. doi: 10.1038/jid.2008.74. [DOI] [PubMed] [Google Scholar]
- 49.Eyerich K, Pennino D, Scarponi C, Foerster S, Nasorri F, Behrendt H, et al. IL-17 in atopic eczema: linking allergen-specific adaptive and microbial-triggered innate immune response. J Allergy Clin Immunol. 2009;123(1):59–66.e4. doi: 10.1016/j.jaci.2008.10.031. [DOI] [PubMed] [Google Scholar]
- 50.Takei-Taniguchi R, Imai Y, Ishikawa C, Sakaguchi Y, Nakagawa N, Tsuda T, et al. Interleukin-17- and protease-activated receptor 2-mediated production of CXCL1 and CXCL8 modulated by cyclosporine A, vitamin D3 and glucocorticoids in human keratinocytes. J Dermatol. 2012;39(7):625–31. doi: 10.1111/j.1346-8138.2011.01462.x. [DOI] [PubMed] [Google Scholar]
- 51.Hibino M, Sugiura K, Muro Y, Shimoyama Y, Tomita Y. Cyclosporin A induces the unfolded protein response in keratinocytes. Arch Dermatol. 2011;303(7):481–9. doi: 10.1007/s00403-010-1099-3. [DOI] [PubMed] [Google Scholar]
- 52.http://clinicaltrials.gov/ct2/show/NCT01806662
- 53.http://clinicaltrials.gov/ct2/show/NCT01941537
- 54.http://clinicaltrials.gov/ct2/show/NCT01979016
Associated Data
This section collects any data citations, data availability statements, or supplementary materials included in this article.
Supplementary Materials
Supplementary Figure E1. A) Photographs from a representative patient at wks 0, 2, and 12 after cyclosporine 5mg/kg/day treatment. B) Significant reductions in SCORAD of 50.89% and 73.44% were observed at wks 2 and 12 after CsA. C) Total IgE and (D) eosinophil serum levels at wks 2 and 12 of CsA. pre vs post p-values are indicated. Wk/week; Mean±SEM
Supplementary Figure E2. Reductions in cellular infiltrates by immunohistochemistry, in lesional/LS and non-lesional/NL atopic dermatitis at wks 2 and 12 of CsA. Representative staining is shown, with significant reductions in CD3+ T-cells (A,E), myeloid/CD11c+ (B,F), CD206+ (C,G), and mature/CD83+ dendritic cells (D,H) at wks2 and 12. Wk/week; Mean±SD, *p<0.05/**p<0.01/***p<0.001
Supplementary Figure E3. Changes in a transcriptome subset of immune genes (A). AD transcriptome improves by 84.25% and 105.95% at wks 2 and 12 respectively (B). Red/upregulated; Blue/downregulated; Wk/week; AD/atopic dermatitis. Heatmap is arranged by patient SCORAD (white to black gradient) pink = patients with unknown SCORAD.
Supplementary Figure E4. Representative S100A7 staining at wks 0 and 12 LS and NL skin (A). Representative 40× magnification H&E (B), arrow points to absence of granular layer at wk 0 and restoration 24 of granular layer at wk 12. Representative IHC of C) filaggrin and D) loricrin after treatment in LS and NL AD (n=5/antibody). Wk/week; LS/lesional; NL/non lesional; AD/atopic dermatitis; FLG/filaggrin; LOR/loricrin.
Supplementary Figure E5. Quantitative RT-PCR of several Th2-related cytokines. A–D) mRNA differences from baseline expression levels (fold-changes/FCHs) in lesional/LS and non-lesional/NL skin at wks2 and 12 of treatment. Wk/week; pre vs post p-values are indicated; Mean±SEM
Supplementary Figure E6. Small increases in mRNA expression of differentiation genes filaggrin/FLG (A), loricrin/LOR (B) and periplakin/PPL (C), particularly at wk2. FCH/fold changes; Wk/week; pre vs post p-values are indicated; Mean±SEM
Supplementary Figure E7. Comparison of selected cellular (A) and genomic (B) biomarkers between non-responders and responders at weeks 2 (W2) and 12 (W12) of treatment. Color corresponds to treatment effect on LS skin (W12 vs W0) in responders. Y-axis shows differences between responders and non-responders. For example, IL-13 decreased by 5.1 log2FCH at W12 in the responder group, whereas it only slightly increased by 0.5 log2FCH in the non-responder group, corresponding to a difference of 5.6 between the two groups. W/week; LS/lesional; FCH/fold change
Supplementary Figure E8. Scatterplots corresponding 47 to the top Spearman correlations in Table E4A–B.
Supplementary Table E1. Demographic data of the atopic dermatitis patients enrolled in this study, including gender, patient age, race, SCORAD, total serum IgE, and % eosinophils at baseline, wks 2 and 12, and filaggrin mutation status. Wk/Week; Scoring of AD/SCORAD.
Supplementary Table E2. Effects of CsA on the AD transcriptome. The FCHs, log2FCHs, p-values, and status (1=up-regulated, −1=down-regulated, 0=not differentially expressed) are indicated for each comparison, including post versus pre-treatment values at wks 2 and 12 for LS and NL skin, and LS versus NL skin at wks 2 and 12. DEGs/differentially-expressed genes; LS/lesional; NL/non-lesional; FCH/fold change.
Supplementary Table E3. Average mRNA expression values and confidence interval values corresponding with Figure 3.
Supplementary Table E4. LS skin biomarkers significantly correlated with improvement in the SCORAD index following CsA. Spearman rank correlations were determined for all evaluated biomarkers quantified by immunohistochemistry (denoted by “I”) and real-time-PCR (RT-PCR) (denoted by “R”) with reduction in SCORAD (A) and epidermal 69 thickness (B) following treatment. FDR <0.03 (A) and <0.02 (B).
Supplementary Table E5. Antibodies (with specific vendor, clone, isotype, and dilution value) used in immunohistochemistry.
Supplementary Table E6. Comparison of mRNA expression differences (FCHs) in pre (Wk0) and post (Wk12 or D56) LS skin biopsies from psoriasis and atopic dermatitis patients treated with CsA. Psoriasis data is from (Haider et al., J Immunol 2008 180(3):1913–20) AD/atopic dermatitis; PsO/psoriasis; LS/lesional; Wk/week; D/day; FCH/fold change; ND/not done.