

Abstract
Deregulation in lysine methylation signaling has emerged as a common etiologic factor in cancer pathogenesis, with inhibitors of several histone lysine methyltransferases (KMTs) being developed as chemotherapeutics1. The largely cytoplasmic KMT SMYD3 (SET and MYND domain containing protein 3) is overexpressed in numerous human tumors2-4. However, the molecular mechanism by which SMYD3 regulates cancer pathways and its relationship to tumorigenesis in vivo are largely unknown. Here we show that methylation of MAP3K2 by SMYD3 increases MAP Kinase signaling and promotes the formation of Ras-driven carcinomas. Using mouse models for pancreatic ductal adenocarcinoma (PDAC) and lung adenocarcinoma (LAC), we found that abrogating SMYD3 catalytic activity inhibits tumor development in response to oncogenic Ras. We employed protein array technology to identify the MAP3K2 kinase as a target of SMYD3. In cancer cell lines, SMYD3-mediated methylation of MAP3K2 at lysine 260 potentiates activation of the Ras/Raf/MEK/ERK signaling module. Finally, the PP2A phosphatase complex, a key negative regulator of the MAP Kinase pathway, binds to MAP3K2 and this interaction is blocked by methylation. Together, our results elucidate a new role for lysine methylation in integrating cytoplasmic kinase-signaling cascades and establish a pivotal role for SMYD3 in the regulation of oncogenic Ras signaling.
The Ras family of oncogenes is activated in a large fraction of human cancers5. To explore possible connections between KMTs and human cancers driven by activation of Ras, we surveyed the level of expression for 54 known and candidate human KMT genes in pancreas ductal adenocarcinoma (PDAC), a cancer nearly universally initiated by oncogenic Ras mutations. We found that five KMTs (SMYD3, MLL5, EZH2, SETD5 and WHSC1L1) were consistently up-regulated in human datasets (Extended Data Fig. 1a-c). SMYD3, which showed the most significant correlation with PDAC in our meta-analysis, is reported to be overexpressed in several cancers with elevated Ras activity2,3, and SMYD3 protein expression increases with PDAC development (Extended Data Fig. 2a-b). Based on these results, we postulated that SMYD3 might have a role in Ras-driven tumorigenesis.
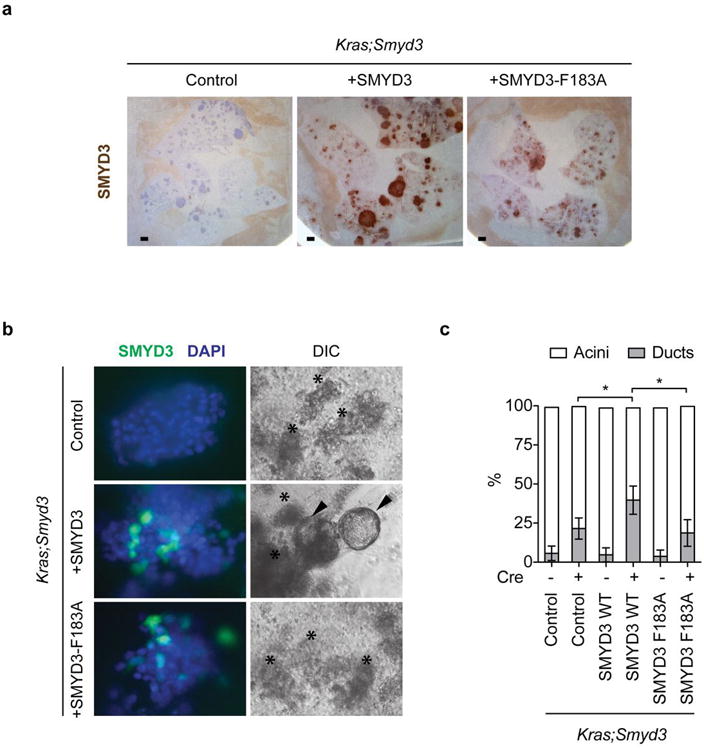
Little is known regarding SMYD3 cancer-related function in vivo. We previously generated Smyd3 mutant mice, which develop normally, are viable, and fertile (Extended Data Fig. 2d; data not shown;6). To investigate the role of SMYD3 in Ras-driven cancers, Smyd3 mutant mice were crossed with mice harbouring a loxP-Stop-loxP KrasG12D knock-in allele (Kras+/LSL-G12D), which allows for the controlled induction of oncogenic K-Ras and the initiation of tumors in distinct organs, including the lung and the pancreas7,8. PDAC arises from the transdifferentiation of acinar cells into duct-like cells upon activation of Ras signaling9,10. We observed induction of SMYD3 expression during this process in mice with pancreas-specific activation of K-Ras (Fig. 1a) and in an ex vivo acinar-to-ductal metaplasia (ADM) system11 (Fig. 1b). In this assay, SMYD3 was required for efficient duct formation from acinar cells (Fig. 1c-d). In vivo, ADM and PDAC initiation are triggered in young Kras mutant mice by inducing severe acute pancreatitis via repeated injections of caerulein12 (Fig. 1e). In this system, Smyd3 deletion reduced the appearance of pancreatic intra-epithelial neoplasia (PanIN) brought on by Kras activation, as determined by histopathological analysis and decreased signal for both phosphorylated ERK1/2 (pERK1/2, a downstream marker of Ras activity) and MUC5 (a marker of PanINs) (Fig. 1f-g). In the absence of a pancreatitis trigger, PanIN lesions develop by 6 months in p48+/Cre;Kras+/LSL-G12D mice8, a process that was attenuated by Smyd3 loss (Fig. 1h; Extended Data Fig. 3a). Next, to study PDAC growth and to perform survival studies, we used the p48+/Cre;Kras+/LSL-G12D;p53lox/lox (Kras;p53) mutant model, which is characterized by rapid PanIN-to-PDAC progression and malignant transformation with 100% penetrance in a relatively short latency (∼50-60 days)13. At autopsy, the pancreatic tissue from Kras;p53 mutant mice was entirely occupied by transformed cells, whereas areas of normal pancreatic tissue remained in Kras;p53;Smyd3 mutant mice (Extended Data Fig. 3b-c). Furthermore, loss of Smyd3 extended the lifespan of the animals (Fig. 1i) and resulted in reduced levels of the PDAC biomarker pERK1/2 in biopsy samples (Fig. 1j; Extended Data Fig. 3b). Notably, Ras expression was not affected by SMYD3 deletion (Extended Data Fig. 3f). Based on these data, we conclude that SMYD3 is required for efficient initiation of pancreatic cancer by oncogenic K-Ras.
Figure 1. SMYD3 loss inhibits Ras-driven pancreatic tumorigenesis.
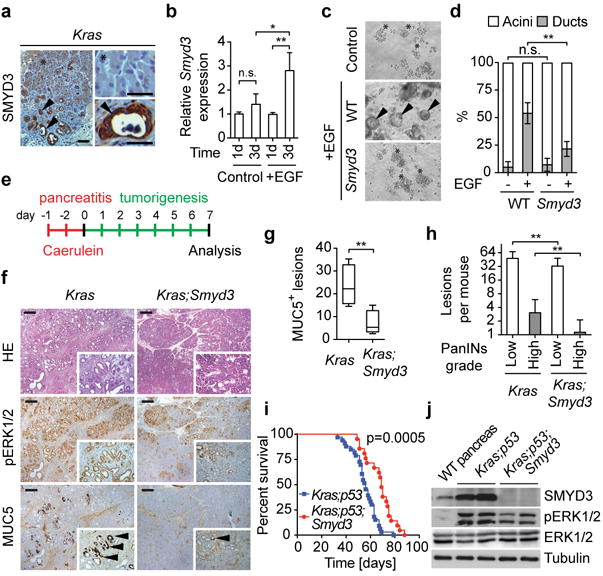
a, Representative immunohistochemistry (IHC) images showing SMYD3 expression in cells undergoing acinar-to-ductal metaplasia (ADM, arrowheads) but not in acini (asterisk) in p48Cre/+;Kras+/LSL-G12D (Kras) mice. b, Smyd3 expression increases during ADM formation. Quantitative real-time-PCR (qRT-PCR) analysis of Smyd3 expression at the indicated times from control- and EGF-induced ADM ex vivo samples (four independent biological replicas). c, SMYD3 depletion inhibits ADM. Wild-type (WT, p48Cre/+) acinar clusters (asterisk) undergo ADM and form ducts (arrowhead) ex vivo, whereas Smyd3 mutant acini explants inefficiently form ducts. d, Quantitation of acinar and ductal clusters on day 3 of culture as in (c) (four independent biological replicas with three technical replicas each). e, Schematic of the caerulein pancreatitis-induced tumorigenesis protocol12. f, Representative hematoxylin and eosin (HE) staining and IHC for pERK1/2, a marker of Ras activity, and MUC5, a marker of PanIN lesions (arrowheads). g, Quantification of MUC5 positive lesions in caerulein-treated pancreata from Kras (n=6) and Kras;Smyd3 (n=6) mutant mice. h, Quantification of spontaneous PanIN lesions formed in 6-month old Kras (n=8) and Kras;Smyd3 (n=8) mutant mice. The grade of lesions is indicated. i, Kaplan-Meier survival of Kras;p53 mutant mice (p48Cre/+; KrasLSL-G12D/+;p53lox/lox, n=33, med. survival=56 days) and Kras;p53;Smyd3 mutant mice (n=21, med. survival=68.5 days) animals. p=0.0005 by log-rank test for significance. j, Immunoblots with the indicated antibodies of Kras;p53 and Kras;p53;Smyd3 mutant pancreatic tumor lysates. Loss of SMYD3 was also confirmed by immunostaining of pancreatic sections (Extended Data Fig. 4d). All scale bars, 50 μm. *: p-value<0.05; **: p-value<0.01; n.s.: not significant. (two-tailed unpaired Student's t-test). Data are represented as mean +/− SEM.
Oncogenic activation of the Ras pathway is a frequent event in lung adenocarcinoma, a cancer that also shows high SMYD3 expression (Extended Data Figs. 1d and 2c). Intratracheal injection of an adenovirus expressing the Cre recombinase (Ad-Cre) in adult Kras+/LSL-G12D mice led to the development of atypical adenomatous hyperplasia (AAH) and adenomas in the lungs within 12 weeks7, irrespective of Smyd3 status (Fig. 2a-b; Extended Data Fig. 3d). In contrast, at 16 and 20 weeks or more after Ad-Cre infection, mice lacking Smyd3 showed significantly smaller and less advanced tumors than control mice (Fig. 2a, c-d; Extended Data Fig. 3d; data not shown). Specifically, quantification of tumor grade indicated that Smyd3 loss impeded the critical transition from adenoma to adenocarcinoma (Fig. 2c), which was also observable at the whole organ level (Fig. 2d). Moreover, the lifespan of KrasG12D-expressing mice was 20% longer if mutant for Smyd3 (Fig. 2e). Progression of lung cancer to carcinoma correlates with amplification of Ras/MEK/ERK signaling14,15. Smyd3 deletion resulted in lower detection of pERK1/2 relative to control tumors without an overall change in total levels of Ras (Fig. 2f; Extended Data Figs. 2a and 3f). Together, these observations indicate that SMYD3 promotes Ras-driven cancer development and progression in vivo.
Figure 2. SMYD3 loss inhibits the development of Ras-driven lung adenocarcinoma.
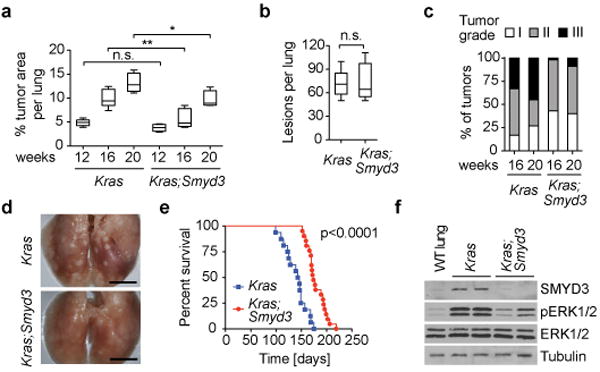
a, Quantification of tumor area per lung at the indicated time points after tumor induction (n=6 for each time point and genotype). b, Total number of tumor lesions at 12 weeks post tumor induction (n=6 for each genotype). Data are represented as mean +/− SEM. *: p-value<0.05; **: p-value<0.01; n.s.: not significant (two-tailed unpaired Student's t-test). c, Quantification of tumor grade at 16 and 20 weeks (n=6 for each time point and genotype). d, Representative lung images at the endpoint of survival studies. Scale bars, 1 cm. e, Survival analysis of Kras (n=16, med. survival=144.5 days) and Kras;Smyd3 (n=21; med. survival=174 days) mutant mice, time post infection. p<0.0001 by log-rank test for significance. f, Immunoblots of lung tumor lysates dissected from Kras and Kras;Smyd3 mutant mice (two independent biological replicates for each genotype) with the indicated antibodies. Loss of SMYD3 was also confirmed by immunostaining on lung sections (Extended Data Fig. 3f).
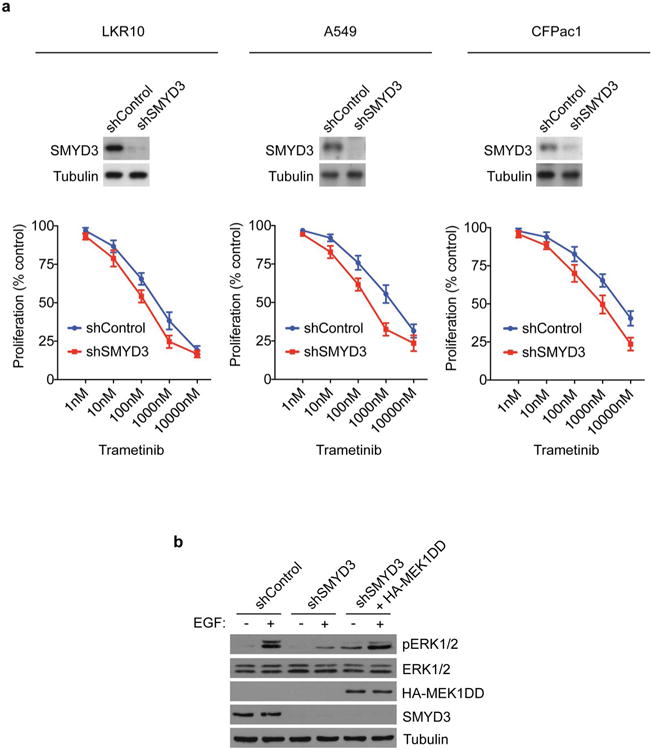
Depletion of SMYD3 by RNA-mediated interference (RNAi) using a short hairpin (shRNA) strategy in LKR10 mouse cells, a LAC-derived cell line16, A549, a human LAC cell line, and CFPac1, a human PDAC cell line, reduced the proliferation rates for all three cell types and inhibited their ability to grow in anchorage independent condition (Extended Data Fig. 4a-c). Furthermore, knockdown of SMYD3 in CFPac1 cells inhibited tumor growth in mouse xenograft experiments (Extended Data Fig. 4d-f). Thus, SMYD3 acts to maintain a number of tumorigenic characteristics in mouse and human cancer cell lines driven by oncogenic Ras.
Next, wild-type SMYD3, a catalytically inactive form (SMYD3F183A)6, or vector control were co-expressed with the Cre recombinase in the lungs of Kras;Smyd3 mutant mice by lentiviral transduction (Extended Data Fig. 5a). Complementation of wild-type SMYD3 into the lungs of Kras;Smyd3 mutant mice resulted in a higher tumor burden and pERK1/2 signal relative to the control Cre-alone infection and expression of mutant SMYD3F183A (Fig. 3a-c). Reconstitution experiments also demonstrated that SMYD3 catalytic activity is required for pancreatic ADM (Extended Data Fig. 5b-c). We previously reported that SMYD3 methylates histone H4 at lysine 5 (H4K5) and not at other lysines on histones6. However, in LAC and PDAC cells and tumors, virtually all SMYD3 is present in the cytoplasm (Fig. 1a and Extended Data Figs. 2a, 2c, 3e, 6b), suggesting that the cancer-relevant substrate in these cell types is unlikely to be nuclear H4K5 but rather a cytoplasmic protein.
Figure 3. SMYD3 methylates MAP3K2 in cancer cells.
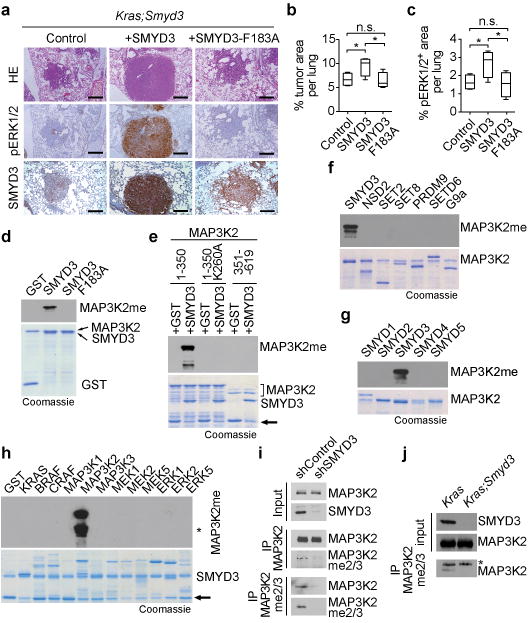
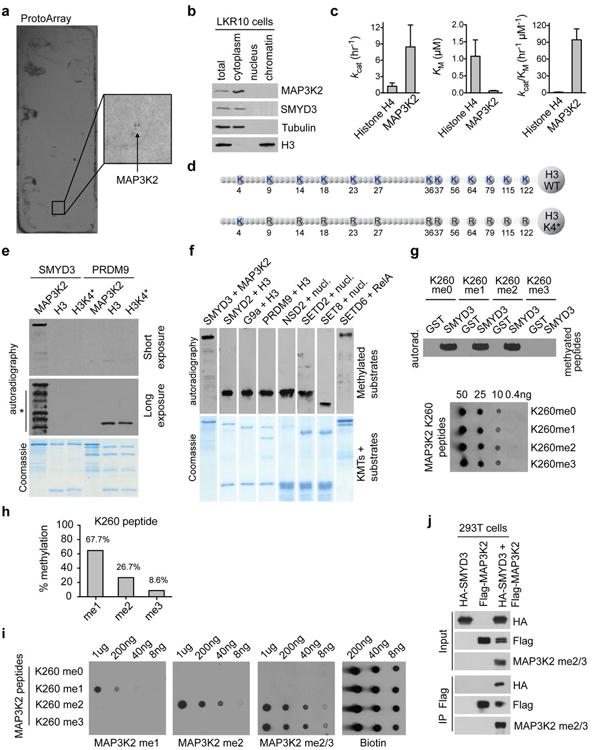
a, Analysis of lung cancer development in Kras;Smyd3 mutant mice following infection with a lentivirus expressing Cre only or simultaneously Cre and WT SMYD3 or inactive SMYD3F183A. Histological analysis (HE staining) and IHC for pERK1/2 were performed 24 weeks post lentiviral infection. IHC confirms lentiviral-mediated expression of SMYD3. Scale bars, 50 μm. b, c, Quantification of total tumor area per lung and pERK1/2 positive area per lung, respectively (n=4 for each experimental group). Data are represented as mean +/− SEM. *: p-value<0.05 (two-tailed unpaired Student's t-test). d, SMYD3 directly methylates MAP3K2. In vitro methylation assay on full-length recombinant MAP3K2 with recombinant wild-type SMYD3, catalytic-dead SMYD3F183A, or GST control. Top panel: autoradiogram of methylation assay. Bottom panel: Coomassie stain of proteins in the reaction. e, SMYD3 methylates MAP3K2 at K260. In vitro methylation assay as in (d) with the indicated proteins on MAP3K2 aa1-350, MAP3K2 aa1-350 with a K260A substitution, and MAP3K2 aa351-619. Arrow indicates GST, which is a stable breakdown product of recombinant proteins. f-g, MAP3K2 is a specific substrate of SMYD3. In vitro methylation assays as in (d) on MAP3K2 using the indicated KMTs (positive controls for the known KMTs shown in Extended Data Fig. 6f). h, SMYD3 specifically methylates MAP3K2. In vitro SMYD3 methylation assay as in (d) on the indicated MAP Kinase pathway proteins. Asterisks indicates MAP3K2 breakdown product. Arrow indicates GST, which is a stable breakdown product for many of the screened substrates. i, Immunoblots with the indicated antibodies from input (cytoplasmic extract) or the indicated IPs (immunoprecipitations) from LKR10 cells stably expressing control or Smyd3 shRNA. j, Immunoblots with the indicated antibodies and samples as in (i) of lung tumor biopsy lysates isolated from Kras and Kras;Smyd3 mutant mice. Asterisks represent detection of IgG. For experiments e-k representative data based on three or more independent biological replica is shown.
In a biochemical screen for SMYD3 targets on a protein array platform containing greater than 9000 potential substrates17, the only candidate to be methylated by SMYD3 in three independent experiments was the MAP Kinase pathway component MAP3K2 (Extended Data Fig. 6a). As shown in Figure 3d, recombinant wild-type SMYD3, but not the catalytically dead SMYD3F183A mutant, methylated recombinant MAP3K2 in vitro. Using a mutagenesis approach, we identified lysine 260 of MAP3K2 as the single site of methylation catalyzed by SMYD3 (Fig. 3e; data not shown). The immediate sequence surrounding K260 of MAP3K2 and K5 of H4 is identical (GKGG), though the catalytic efficiency (kcat/KM) of SMYD3 for MAP3K2 is nearly two orders of magnitude greater than it is for H4 (Extended Data Fig. 6c). We also did not detect any methylation of H3 at lysine 4 by SMYD3, a previously reported activity4 (Extended Data Fig. 6d-e). In addition, SMYD3 was the only KMT of the eleven we tested that could methylate MAP3K2 (Fig. 3f-g; Extended Data Fig. 6f). Furthermore, while SMYD3 methylated MAP3K2, it had no detectable activity on a dozen other members of the MAP Kinase signaling cascade (Fig. 3h). Finally, in vitro methylation assays on MAP3K2 peptides spanning K260 (aa 249 to 273) with K260 either unmethylated, mono-, di-, or tri-methylated showed that SMYD3 can utilize all lower states of methylation as substrates to generate the fully saturated trimethyl state at K260 (Extended Data Fig. 6g-h). Thus, SMYD3 mono-, di-, and tri-methylates MAP3K2 at lysine 260 (MAP3K2-K260me) with high specificity in vitro.
To investigate MAP3K2 methylation in cells, we raised methyl-specific antibodies against the different states of methylation at K260 (Extended Data Fig. 6i). In co-transfection experiments in human 293T cells, overexpressed MAP3K2 was methylated at K260 upon SMYD3 overexpression (Extended Data Fig. 6j). Endogenous methylation at MAP3K2-K260 was observed in LKR10 cells and RNAi-mediated depletion of SMYD3 in these cells resulted in loss of this signal (Fig. 3i). Finally, the MAP3K2-K260me2/3 signal was significantly reduced in tumor tissue micro-dissected from Kras versus Kras;Smyd3 mutant mice (Fig. 3j). Thus, SMYD3 is required for maintenance of physiological levels of MAP3K2-K260 methylation in cancer tissue and cells.
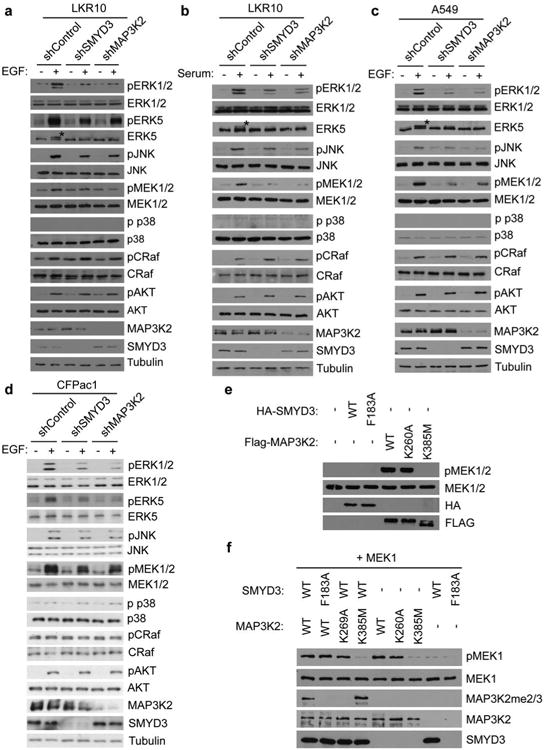
The cytoplasmic kinase MAP3K2 is activated in response to a variety of stress and mitogenic stimuli, including EGF, and relays signals to downstream MAP Kinase components such as ERK1/218 and ERK519. Given that the pERK1/2 and pERK5 signals are reduced in LAC and PDAC samples from Smyd3 mutant mice (Figs. 1 and 2; Extended Data Fig. 3), we reasoned that SMYD3-mediated methylation of MAP3K2 may regulate signaling within the Ras/ERK pathway. We therefore examined the relationship between SMYD3 and EGF-stimulated ERK1/2 activation. First, endogenous SMYD3 was depleted in LKR10 by shRNA targeting the 3′ untranslated region of Smyd3 and then we reconstituted the depleted cells with RNAi-resistant wild-type SMYD3 or catalytically inactive SMYD3F183A. In control cells, EGF treatment triggered ERK1/2 phosphorylation, and this response was greatly reduced by SMYD3 depletion (Fig. 4a). Complementation with wild-type SMYD3 re-established the EGF-mediated ERK1/2 phosphorylation response, whereas complementation with SMYD3F183A failed to do so (Fig. 4a). SMYD3 was also required when serum was used to activate ERK1/2 activation in LKR10 cells (Extended Data Fig. 7b) and when EGF was used to activate ERK1/2 in human lung and pancreatic cancer cells (Extended Data Fig. 7c-d). Finally, we established a MAP3K2 complementation system to investigate the role of K260 of MAP3K2. In these experiments, wild-type MAP3K2 but not the SMYD3-resistant MAP3K2K260A mutant, reconstituted the EGF-mediated ERK1/2 phosphorylation response (Fig. 4b).
Figure 4. SMYD3 methylation of MAP3K2 activates MAP Kinase signaling pathways and repels PP2A.
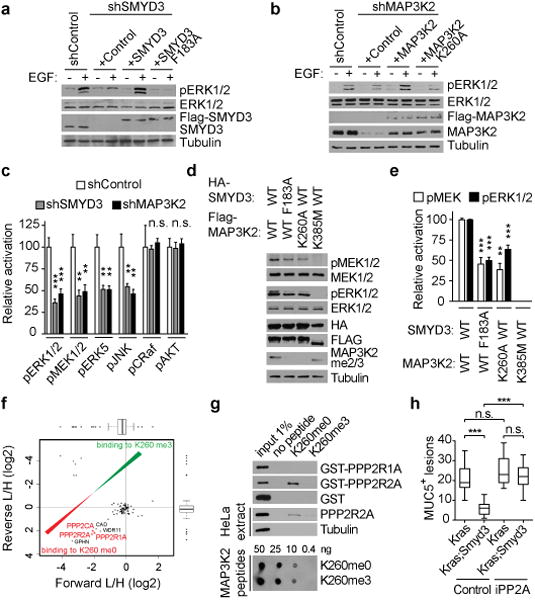
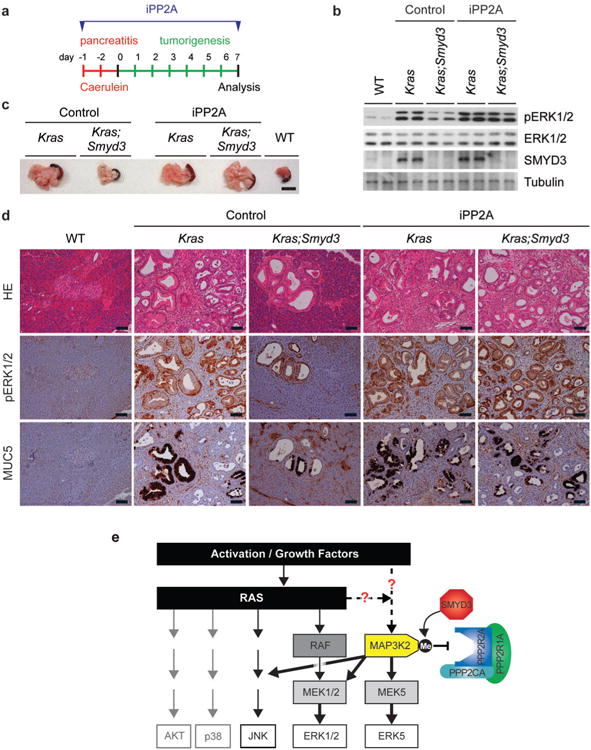
a, SMYD3 catalytic activity is required for ERK1/2 activation in LAC cells. Immunoblots with the indicated antibodies of LKR10 cells lysates depleted for SMYD3 and reconstituted with either active or inactive Flag-SMYD3 as indicated. Stimulation: EGF treatment for 15 min at 25 ng/μl. b, MAP3K2 methylation is required for ERK1/2 activation in LAC cells. Immunoblot with the indicated antibodies of LKR10 cells lysates treated as in (a) depleted for MAP3K2 and reconstituted with either wild-type or K260A mutant Flag-MAP3K2. c, SMYD3 and MAP3K2 regulate multiple overlapping MAP kinase pathway proteins. Quantitation of the indicated activated kinase signals in shSMYD3 and shMAP3K2 relative to shControl cell lysates based on three independent biological replica treated as in Extended Data Fig. 7a. d, SMYD3 catalytic activity promotes MAP3K2-induced phosphorylation of MEK1/2. Immunoblots with the indicated antibodies of 293T cells lysates transfected with Flag-MAP3K2 and HA-SMYD3 wild-type and derivatives as indicated. MAP3K2 K385 is a kinase-dead mutant. e, Quantitation of pMEK and pERK1/2 signals in 293T cells transected with the indicated MAP3K2 and SMYD3 constructs and treated as in (d). Data was generated from three independent biological replica. f, SILAC-based quantitative proteomic analysis of proteins that bind to MAP3K2-K260me0 and MAP3K2-K260me3 peptides. Data represent two independent experiments (forward and reverse direction). Proteins are plotted by their SILAC ratios in the forward (x axis) and reverse (y axis) SILAC experiments. Specific interactors of K260me0 reside in the lower left quadrant. The three PP2A complex components are highlighted in red. g, PP2R2A directly binds to MAP3K2 peptides encompassing amino acids 249-273 and this interaction is inhibited by K260 methylation. Immunoblots of peptide pulldowns as indicated with either recombinant proteins (top panel) or HeLa cytoplasmic extracts (middle panel) (based on two replica). The dot blot in the bottom panel shows equivalent amounts of peptides used for the experiments. h, Quantification of MUC5 positive lesions in caerulein-treated pancreata from Kras (n=5, each treatment) and Kras;Smyd3 (n=5, each treatment) mutant mice treated with the PP2A inhibitor cantharidin (iPP2A) (0.15mg/kg BID, IP) or vehicle control (see Extended Data Figure 10). *: p-value<0.05; **: p-value<0.01; ***: p-value<0.001; n.s.: not significant. (two-tailed unpaired Student's t-test). Data are represented as mean +/− SEM.
To characterize how the SMYD3-MAP3K2 axis impinges on the overall MAP Kinase network, the level of EGF-induced activation for several kinases was determined in control, SMYD3 knockdown, and MAP3K2 knockdown LKR10, A549, and CFPac1 cells (Fig. 4c; Extended Data Fig. 7a-d). SMYD3 and MAP3K2 were both required for full activation of ERK5, ERK1/2, MEK1/2 and JNK (known downstream targets of MAP3K218-22), but dispensable for activation of AKT and CRaf (RAF-1) (p38 was not activated in the tested cell lines (Extended Data Fig. 7a-d)). Notably, MEK1/2 activation was impaired in SMYD3 and MAP3K2 knockdown cell lines. As the canonical ERK1/2 activation pathway consists of Raf-MEK1/2-ERK1/2 and both SMYD3 and MAP3K2 were required for MEK1/2 and ERK1/2 activation but not CRaf, we postulated that SMYD3 methylation of MAP3K2 directly influences MEK1/2 phosphorylation. Indeed, pMEK1/2 signal increased in response to overexpression of wild-type MAP3K2 and a SMYD3-resistant MAP3K2K260A mutant, but not a catalytically dead MAP3K2K385M mutant23 (Fig. 4d-e; Extended Data Fig. 7e). SMYD3 expression alone had no effect on MEK1/2 activation (Extended Data Fig. 7e), but resulted in increased MEK1/2 phosphorylation when co-expressed with wild-type MAP3K2 relative to co-expression with MAP3K2K260A (Fig. 4d-e). Notably, MAP3K2 phosphorylates MEK1 in in vitro kinase assays21, and this activity was unchanged if SMYD3-methylated MAP3K2 or MAP3K2K260A were used in the kinase assays rather than wild-type, unmethylated MAP3K2 (Extended Data Fig. 7f). These results suggest that the molecular mode of action linking MAP3K2 methylation to MEK1/2 activation is not due to changes in the intrinsic kinase activity of MAP3K2 but rather another mechanism.
Given the role of SMYD3-MAP3K2 in activating MEK1/2, we tested whether SMYD3 depletion augments the effects of the MEK1/2 inhibitor Trametinib, which is currently being investigated to treat NSCLC and PDAC (http://clinicaltrials.gov/). Administration of Kras and Kras;Smyd3 mutant mice with a normal dose of Trametinib blocked tumorigenesis in both strains, though phosphorylation of ERK1/2 was still lower in mice depleted of SMYD3 (Extended Data Fig. 8). Notably, a low dose Trametinib regimen, which only partially inhibited pERK1/2 levels and the formation of neoplastic lesions in Kras mutant mice, was sufficient to block tumorigenesis and ERK1/2 activation in Smyd3 knockouts (Extended Data Figure 8). Trametinib was also more potent in cancer cell lines when coupled with SMYD3 depletion (Extended Data Fig. 9a). These data suggest that SMYD3 may act in concert with MEK1/2 signaling in tumorigenesis. Indeed, overexpression of activated MEK1S218D,S222D (MEK-DD) 24 rescued the effects of SMYD3 depletion in lung cancer cells (Extended Data Fig. 9b)
Since the intrinsic kinase activity of MAP3K2 is not directly altered by methylation we postulated that this modification event was involved in modulating a key protein-protein interaction. To identify candidate methyl-sensitive binding partners of MAP3K2, a SILAC (Stable Isotope Labelling by Amino acids in Cell culture)-based quantitative proteomic screen was performed with cytoplasmic extracts to isolate proteins that bound differentially to MAP3K2-K260me0 peptides versus MAP3K2-K260me3 peptides. While this analysis did not show enrichment of any K260me3-binding proteins, it did reveal six candidates that bind to the unmethylated peptide but are blocked by K260 trimethylation. Of these six proteins, three are members of the PP2A serine/threonine phosphatase complex (Fig. 4f). In our proteomics experiment we identified the catalytic PPP2CA protein, the structural PPP2R1A protein and the regulatory PPP2R2A protein, three classes of subunits that comprise the typical heterotrimeric PP2A complex. This complex is a major cellular phosphatase that inactivates key members of the MAP Kinase signaling cascade (reviewed in 25,26). We found that the interaction between the PP2A complex and MAP3K2 is direct, as recombinant PPP2R2A, but not PPP2R1A, bound to MAP3K2-K260me0 peptides and not to MAP3K2-K260me3 peptides in in vitro peptide pull-down experiments (Fig. 4g; top panel). Moreover, PPP2R2A was specifically recovered from cytoplasmic extracts using MAP3K2-K260me0 peptides but not by MAP3K2-K260me3 peptides (Fig. 4g; middle panel). Thus, amino acids 249-273 of MAP3K2 are sufficient for binding directly to the PP2A complex, via PPP2R2A, and methylation at K260 inhibits this interaction.
We next tested the ability of the PP2A inhibitor cantharidin27 to “phenocopy” SMYD3 function (Fig. 4h; Extended Data Fig. 10 a-d). Cantharidin treatment had no gross effect on tumor formation in p48+/Cre Kras mutant mice relative to vehicle treatment; in contrast, administration of cantharidin to p48+/Cre Kras;Smyd3 mutant mice restored tumor formation to the level seen with wild-type SMYD3 in the p48+/Cre Kras mutant mice. These data suggest an in vivo functional connection between the Ras pathway, SMYD3, and PP2A.
We have identified SMYD3-catalyzed methylation of MAP3K2 as a key event regulating Ras signaling in cancer cells. While MAP3K2 directly phosphorylates MEK1/2, a complete understanding of how MAP3K2 functions in Ras signaling remains to be determined. Our data suggest a model in which increased SMYD3 activity generates a population of methylated MAP3K2, which – via mechanisms such as blocking the association of the PP2A phosphatase with components of the MAP kinase network – intensifies the output of this pathway in response to oncogenic Ras (Extended Data Fig. 10e). In addition, the cytoplasmic localization of the SMYD3-MAP3K2 dynamic suggests a paradigm for how signaling through lysine methylation and phosphorylation can be integrated to regulate key signal transduction cascades. A clinical implication of this work is the identification of SMYD3 as a candidate therapeutic target for pharmacologic intervention to treat pancreatic and lung cancers, as well as potentially other Ras-driven tumors. The complete loss of SMYD3 function has no visible phenotype in mice, suggesting that SMYD3 inhibitors would have minimal collateral toxicity as chemotherapeutics. Thus, one could envision a therapeutic strategy comprising inhibitors of Raf or MEK that are currently used in the clinic with a SMYD3 inhibitory agent, which could mitigate potential drug toxicity by lowering the overall dose needed for each medicine and combat the development of resistance. Together, our findings reveal a new function for lysine methylation signaling in the cytoplasm in the regulation of cancer pathways.
Full Methods
Ethics statement
Mice were maintained according to practices prescribed by the NIH at Stanford's Research Animal Facility accredited by the AAALAC.
Mouse strains
Kras+/LSL-G12D, p53lox/lox, and p48+/Cre mice have been described before8,28,29. Smyd3tm1a(KOMP)Wtsi mice were obtained from the KOMP Repository. Details on the targeted allele are available on the KOMP web site30. Briefly, mice were constructed using the “knockout first” strategy. In this allele, insertion of a LacZ cassette with strong splice acceptor in intron 2 of the Smyd3 gene creates a knockout allele serving additionally as a reporter. Expression of the Cre recombinase in cells removes the LacZ cassette and further deletes several Smyd3 exons, resulting in a null allele (Extended data Fig. 2d). Mice were of mixed C57BL/6;129SV background and we systematically used littermate as controls in all the experiments (sex ratio per cohort balanced).
Pancreatic cancer mouse models
Pancreatitis-induced tumorigenesis
Acute pancreatitis was induced at 6 to 8 weeks of age in p48Cre/+;KrasLSLG12D (Kras) and p48Cre/+;KrasLSLG12D;Smyd3lox/lox (Kras;Smyd3) mice by administration of 8 hourly intraperitoneal injections of caerulein (125 μg/kg body weight), (Sigma-Aldrich) over 2 consecutive days as described previously12. Mice were treated as indicated with the PP2A inhibitor cantharidin (0.15mg/kg BID, IP), (Sigma-Aldrich) or the MEK inhibitor Trametinib (Selleckchem) (1mg/kg IP OPD or 0.1mg/kg IP OPD) or vehicle 10% cyclodextran. Pancreatic lesions were analyzed 7 days after the last injection.
Spontaneous model of pancreatic intraepithelial neoplasia (PanIN) development
PanIN progression was analyzed in p48Cre/+;KrasLSLG12D (Kras) and p48Cre/+;KrasLSLG12D; Smyd3lox/lox (Kras;Smyd3) mice aged for 6 months. Quantification of low (PanIN1a and 1b) and high-grade (PanIN2 and 3) lesions was performed. Histopathological analysis was conducted on de-identified slides based on the classification consensus31. Five images (×100) were taken in standardized positions (as to cover the whole section) for each slide. PanINs were counted from 8 independent animals for each group. Error bars represent SEM.
Model of aggressive PDAC
To study aggressive PDAC expansion, we generated p48Cre/+;KrasLSLG12D;p53lox/lox (Kras;p53) and p48Cre/+;KrasLSLG12D;p53lox/lox;Smyd3lox/lox (Kras;p53;Smyd3) mutant mice. Mice were followed for signs of disease progression. At endpoint, tumors were processed for histological and immunohistochemical evaluation. To calculate relative normal acini area Kras;p53 and Kras;p53;Smyd3 tumor sections were stained for amylase. Positive regions on six random, non-overlapping, ×100 images were collected from 3 mice per genotype. For each image positive amylase area was normalized to total pancreas tissue area using ImageJ software. Error bars represent means standard error of the mean (SEM).
Lung cancer mouse models
Adenovirus-induced lung adenocarcinoma (LAC)
KrasLSL-G12D (Kras) and KrasLSL-G12D;Smyd3lox/lox (Kras;Smyd3) mice were treated with 5×10⁶ pfu of adenovirus expressing Cre (University of Iowa adenovirus core) by intratracheal infection as previously described32. Tumors were analyzed and quantified at 12, 16 and 20 weeks post-infection, n=6 for each group.
Lentivirus-induced lung adenocarcinoma
Generation of a dual promoter lentiviral vector for Cre and cDNA expression was described before33. To determine the effect of reconstitution of exogenous Smyd3WT and Smyd3F183A expression on lung tumor progression a lentiviral vector was developed that expressed both the Smyd3 cDNA and Cre. A lentivirus expressing Cre alone was used as a control. Virus was produced and titered as described previously34. Briefly, the lenti-Cre vector was co-transfected with packaging vectors into 293T cells using calcium-phosphate. The supernatant was collected at 48 and 72 hrs. Concentrated virus was recovered by ultracentrifugation at 25,000 r.p.m. for 90 min and re-suspended in PBS. Cohorts of KrasLSL-G12D;Smyd3lox/lox (Kras;Smyd3) mice were infected with each lentiviral vector. Tumor burden was analyzed 24 weeks after lentiviral infection, n=4 for each treatment.
Preparation of Pancreatic Epithelial Explants Culture
Pancreatic epithelial explants from 4- to 6-week old p48Cre/+ (WT) and p48Cre/+;Smyd3lox/lox (Smyd3) were established by modification of previously published protocols35. In brief, the whole pancreas was harvested and treated twice with 1.2 mg/ml collagenase-VIII (Sigma-Aldrich). Following multiple wash steps with McCoy's medium containing soybean trypsin inhibitor (SBTI, 0.2 mg/ml), digested samples were filtered through a 100 μm filter, resuspended in culture medium (Waymouth's MB 752/1 supplemented with 0.1% BSA, 0.2 mg/ml SBTI; 50 μg/ml bovine pituitary extract, 10 μg/ml Insulin, 5 μg/ml transferrin, 6.7 ng/ml selenium in 30% FCS) and allowed to recover for 1h at 37°C. Thereafter, cells were pelleted and resuspended in culture medium supplemented with penicillin G (1000 U/ml), streptomycin (100 μg/ml), amphotericin B, 0.1% FCS, and an equal volume of rat tail collagen type I (BD Bioscience). The cellular/rat tail collagen type I suspension was immediately plated on plates pre-coated with 2.5 mg/ml of rat tail collagen type I. In stimulation experiments recombinant human EGF (rhEGF, Invitrogen) was added at final concentration of 25 ng/ml. For quantification, acinar explants were seeded in triplicates. Cells clusters were counted from at least 3 optical fields/well and reported as a percentage of acinar clusters and duct-like spheres. The quantification was performed in two independent experiments; the number of mice is reported in the main text.
Lentiviral transduction of pancreatic epithelial explants
For reconstitution experiments fresh explants from KrasLSL-G12D;Smyd3lacZ/lacZ (Smyd3 deficient) were transduced using lentiviral vectors with or without Cre and expressing wild-type SMYD3 or SMYD3F183A. Cre-mediated recombination results in oncogenic K-Ras activation, causing spontaneous ADM (acinar to ductal metaplasia), which was quantified as described above.
Immunofluorescence of Pancreatic Epithelial Explants
For immunofluorescent labeling of explanted pancreatic acini/duct clusters, collagen gels containing explanted pancreas were fixed in the chamber slides in 4:1 methanol:DMSO overnight at 4°C, washed and stored at –20°C in 100% methanol. Collagen gels were permeabilized with TritonX-100 0.1% (Sigma-Aldrich) for 5 minutes at room temperature and washed in PBS+TritonX-100 0.025% (PBST). Gels were blocked with 5% normal goat serum in PBST+BSA 2% for 2 hours at room temperature, then incubated sequentially with SMYD3 primary antibody (Abcam) and Alexa Fluor 488-conjugated secondary antibody diluted in blocking buffer overnight at 4°C. Following each antibody, gels were washed in PBST. Cells were counterstained with 50 μg/ml DAPI (Invitrogen) and washed in PBS. Images were captured on a Zeiss inverse fluorescent microscope. Identical acquisition methods were used for all samples to allow direct comparison of the resulting images.
Histology, immunohistochemistry, and X-gal staining
Tissue specimens were fixed in 4% buffered formalin for 24 h and stored in 70% ethanol until paraffin embedding. 3 μm sections were stained with hematoxylin and eosin (HE) or used for immunohistochemical studies.
Immunohistochemistry
Immunohistochemistry was performed on formalin-fixed, paraffin embedded mouse and human tissue sections using a biotin-avidin method as described before36. The following antibodies were utilized: rabbit anti-Amylase (Sigma-Aldrich), pERK1/2 (Cell Signaling), MUC5 (NeoMarkers) and SMYD3 (Abcam). Sections were developed with DAB and counterstained with hematoxylin. Pictures were taken using a Zeiss microscope equipped with the Axiovision software. Analysis of the tumor area and IHC analysis was done using ImageJ software by measuring pixel units.
X-gal staining
X-gal staining of cryosections (8 μm) was carried out as described previously36; slides were counterstained with nuclear fast red.
qRT-PCR
RNA was isolated using the Qiagen RNeasy Isolation Kit followed by cDNA synthesis (SuperScript II, Invitrogen). Real-Time PCR was performed with 800 nM primers diluted in a final volume of 20 μl in SYBR Green Reaction Mix (Applied Biosystems). RT-PCRs were performed as follows: 95°C for 10 min, 35 cycles of 95°C for 15 s and 60°C for 1 min. qRT-PCR data are representative of 4 independent mouse pancreatic epithelial explants isolations per treatment. All samples were analyzed in triplicate. Gapdh expression was used for normalization.
The following primers were used:
qRT-PCR-Smyd3-For 5′ TGCGCACCATGGAGCCGTAC
qRT-PCR-Smyd3-Rev 5′ GTCAAAGGCCAGCCTCAGGTTCT
qRT-PCR-Gapdh-For 5′ CCCACTAACATCAAATGGGG
qRT-PCR-Gapdh-Rev 5′ CCTTCCACAATGCCAAAGTT
Meta-analysis of public PDAC and NSCLC data sets
We downloaded raw data for gene expression studies (7 pancreatic cancer, 6 NSCLC) from the NCBI GEO and EBI ArrayExpress. After re-annotating the probes, each data set was separately normalized using gcRMA. We applied two meta-analyses approaches to the normalized data. The meta-analysis approach has been recently described37. Briefly, the first approach combines effect sizes from each dataset into a meta-effect size to estimate the amount of change in expression across all data sets. For each gene in each data set, an effect size was computed using Hedges' adjusted g. If multiple probes mapped to a gene, the effect size for each gene was summarized using the fixed effect inverse-variance model. We combined study-specific effect sizes to obtain the pooled effect size and its standard error using the random effects inverse-variance technique. We computed z-statistics as a ratio of the pooled effect size to its standard error for each gene, and compared the result to a standard normal distribution to obtain a nominal p-value. P-values were corrected for multiple hypotheses testing using FDR38. We used a second non-parametric meta-analysis that combines p-values from individual experiments to identify genes with a large effect size in all data sets. Briefly, we calculated a t-statistic for each gene in each study. After computing one-tail p-values for each gene, they were corrected for multiple hypotheses using FDR. Next, we used Fisher's sum of logs method, which sums the logarithm of corrected p-values across all data sets for each gene, and compares the sum against a chi-square distribution with 2k degrees of freedom, where k is the number of data sets used in the analysis.
Plasmids
Bacterial expression plasmids were created using pGEX-6P1 vector. Transient mammalian expression plasmids were created using pCDNA3.1 HA, pCDNA3.1 Myc and pCagFlag vectors. The different inserts were amplified by PCR using either cDNA or specific clones from the human ORFeome library as template. Single point mutations of SMYD3 and MAP3K2 were generated using the QuikChange site-directed mutagenesis protocol (Stratagene), and clones were confirmed by DNA sequencing. SMYD3 and MAP3K2 shRNA targeting UTR regions were cloned in a pSICOR vector carrying a puromycin resistance gene. Human SMYD3 shRNA sequence directed against the 3′ UTR TGCGTGTGTCTTTGTTGAATTTCAAGAGAATTCAACAAAGACACACGCTTTTTTC Human MAP3K2 shRNA sequence directed against the 3′ UTR TGGATGATTTCACTAGGCATTTCAAGAGAATGCCTAGTGAAATCATCCTTTTTTC Mouse Smyd3 shRNA sequence directed against the 3′ UTR TGAGCAGAACCATTACAATATTCAAGAGATATTGTAATGGTTCTGCTCTTTTTTC Mouse Map3k2 shRNA sequence directed against the 3′ UTR TAGTCATAGCTATAGTGAAATTCAAGAGATTTCACTATAGCTATGACTTTTTTTC. SMYD3 and MAP3K2 stable reconstitution plasmids have been created using the Gateway cloning system according to the manufacturer's instructions (Invitrogen) with either the WT or point mutant constructs, into pMSCV-Flag and pBabe-Flag vectors (hygromycin resistance).
Cell culture, reagents and transfections
K-Ras mutant lung and pancreatic carcinoma lines LKR10 (mouse lung), A549 (human lung) and CFPac1 (human pancreas) were used (all these cell lines are wild-type for EGFR, see below and the COSMIC database for the human cell lines). 293T, LKR10, A549 and CFPac1 cells were grown in Dulbecco's modified Eagle's medium (GIBCO) supplemented with 10% fetal calf serum (FCS, GIBCO), 100 units/ml penicillin/streptomycin and glutamine. All cells were cultured at 37°C in a humidified incubator with 5% CO2. For transient expression, cells were transfected using Mirus 293T transfection reagent and collected 24 to 36 hours later. For stable knockdown, cells were transduced with lentiviral shRNA constructs using the packaging vectors pGagpol and pΔ8.2, followed by 2 μg/ml puromycin selection for one week. For rescue experiments, cells were transduced with retroviral pBabe and pMSCV constructs using packaging the pGag and pVSVg vectors, followed by 100 μg/ml hygromycin selection for one week.
Serum and EGF stimulation were performed after 48h of serum-starvation using either regular 10% FBS cell media or 25 ng/μl of rhEGF (Promega) for 15 min.
EGFR sequencing
LKR10 DNA was isolated. Egfr exons 18 to 21 were amplified using a proofreading polymerase (PfuUltra, Invitrogen) and sequenced bi-directionally. Sequence was verified based on transcript ID: ENSMUST00000020329. The following primers were utilized: mEGFR-Exon 18: For-5′CTCTGGCTCAGAATGAATCTAC, Rev-5′GAAGCCTAGTGCGGACCTGTC, product: 268bp mEGFR Exon 19: For-5′CCAGCTCACAAGGCAACATG, Rev-5′CTAAGGAAGCAAGATTGACC, product: 229bp mEGFR Exon 20: For-5′GATTCATCTATTGTCCTTACC, Rev-5′TGGGTACTTCAGTGGACAGAC, product: 234bp mEGFR Exon 21: For-5′CATGACACTGAGGATGCCCAGA, Rev-5′CAAATGCTGCCCACAGCTGAC, product: 298bp
Cell extracts, immunoprecipitation and immunoblot analysis
For total cell extracts, cells were lysed in RIPA buffer (10 mM Tris-HCl pH 8, 140 mM NaCl, 1 mM EDTA, 0.5 mM EGTA, 1% Triton, 0.1% SDS, 1mM PMSF, protease inhibitors (Roche) and a phosphatase inhibitor cocktail (Sigma-Aldrich)) for 15mn. Cell fractionation was performed by collecting supernatant (cytoplasmic fraction) after 5 min of 1300g centrifugation following a 10 min incubation in hypotonic buffer (10mM Hepes pH7.9, 10mM KCL, 1.5mM MgCl2, 0.34M sucrose, 10% glycerol, 1 mM DTT, 0.05% Triton, and protease inhibitors). The pellet was then incubated 15 min in LSDB250 buffer (Glycerol 20%, MgCl2 3 mM, Hepes pH7.9 50 mM, KCL 250 mM, DTT 0.5mM, PMSF 0.5 mM, NP40 0,1%, protease inhibitors), and centrifuge at 15,000g for 10 min. The supernatant was collected as soluble nuclear extract, and the pellet was further extracted in LSDB250 buffer with sonication (chromatin fraction). Protein concentration was determined by the BCA assay (Pierce).
For immunoprecipitation, cells were lysed in either LSDB250 buffer for smooth total cell extract, or hypotonic buffer for cytoplasmic extract, and same amount of protein extracts were incubated with specific antibody overnight at 4°C. Extracts were then incubated with protein A sepharose beads (GE Healthcare) for 2 hours at 4°C.
Proteins were resolved by SDS-PAGE, transferred to nitrocellulose membrane and analyzed by immunoblot. Antibodies used were as follows: SMYD3 and MAP3K2me2/3 (generated by Yenzym); GST (generated by Covance); beta-Tubulin (05-661 Millipore); MAP3K2 (1662-1 Epitomics); Flag and ERK5 (F1804, E1523, Sigma); pERK1/2 and ERK1/2 and pMEK1/2 and MEK1/2 and pJNK and JNK and pP38 and P38 and pERK5 and pAKT and AKT and pCRaf and CRaf, PPP2R2a (4370, 4695, 9121, 9122, 9251, 9252, 9211, 9212, 3371, 2965, 4685, 9427, 9422, 5689, Cell Signaling); HA and Myc (26183, 21316 Pierce). Immunoblots signal intensity was measured using ImageJ software. Quantification data are expressed as SEM.
Expression and purification of recombinant proteins
For expression of GST tagged recombinant proteins, transformed BL21 cells were induced with 0.1 mM IPTG overnight at 20°C, and proteins were purified using Glutathione sepharose beads (GE Healthcare) and eluted in 10 mM reduced glutathione (Sigma) or cleaved from the GST tag using purified Precision enzyme. Recombinant human histone H3 and H3K4* mutant (first thirteen lysines mutated to arginine except lysine K4) were expressed and purified as previously described39.
Protoarray, methylation and kinase assays
In vitro methylation assays were performed using 1 to 2 μg of recombinant proteins or peptides incubated with 1 μg of recombinant methyltransferases and 0.1 mM of S-adenosyl-methionine (AdoMet, Sigma) or 2 μCi 3H-AdoMet (American Radiolabeled Chemicals) in buffer containing 50 mM Tris-HCl (pH 8.0), 10 % glycerol, 20 mM KCl, 5 mM MgCl2, and 1 mM PMSF at 30°C over-night. The reaction mixture was resolved by SDS-PAGE, followed by autoradiography, Coomassie stain (Pierce) or Mass Spectrometry analysis.
Kinetic constants kcat and KM were determined using Grafit (Erithacus software) from Smyd3 methylation activity on histone H4 (EMD Millipore, USA) and MAP3K2 (Origene, USA) was assessed by radiometric assays utilizing 3H-SAM with specific product capture on arginine binding SPA beads for assays using histone substrates or RNA binding SPA beads when MAP3K2 was the substrate. (PerkinElmer, USA). Assay conditions were 20 mM Tris pH8, 3 mM DTT, 50 μM ZnCl2, 0.005 % Tween-20, 1.2 μM unlabeled SAM, 0.2 μM 3H-SAM and 25 nM Smyd3 final. Reactions were quenched using 2 mM unlabeled SAM. SPA signal was quantified in a Microbeta scintillation counter (PerkinElmer, USA). Data were fit to the Michaelis-Menten equation 30, where the rate was plotted as a function of the concentration of substrate.
To verify the activity of the other lysine methyltransferases tested, in vitro methylation assays were performed using known substrates, as previously reported40-49.
In vitro kinase assays were performed by incubating 1 μg of recombinant MAP3K2 WT or mutants with 1 μg of recombinant MEK1 in kinase buffer containing 25 mM Tris-HCl (pH 7.5), 5 mM b-glycerophosphate, 2 mM dithiothreitol (DTT), 0.1 mM Na3VO4, 10 mM MgCl2 and 200 μM ATP (Cell signaling) at 37°C during 30 min.
Peptide pulldown and SILAC
MAP3K2 peptides were generated by 21st Century Biomedicals and are based on the following sequence: DYDNPIFEKFGKGGTYPRRYHVSYHG[K-Biot-Ahx]-amide.
For peptide pull-downs, 5 to 10 μl of streptavidin sepharose beads (GE Healthcare) were saturated with 10 μg of specific biotinylated peptides for 2 hours at 4°C under rotation in peptide buffer (50 mM Tris pH7.5, 150 mM NaCl, 1% NP-40), then washed 3 times in same buffer. Beads were then incubated with either 1 μg of recombinant proteins or 1 mg of HeLa cytoplasmic extract for 4 hours at 4°C under rotation in peptide buffer. Beads were then washed 3 times in same buffer and resuspended in Laemmli buffer for immunoblot analysis.
For SILAC peptide pulldown, HeLa cytoplasmic extracts were prepared from cells cultivated in either normal amino acids culture condition (“light”) or using modified amino acids culture condition (“heavy”). A 2-way experiments was performed, the “forward” condition combining MAP3K2 K260me0 peptide with light extract and MAP3K2 K260me3 peptide with heavy extract, the “reverse” condition combining MAP3K2 K260me3 peptide with light extract and MAP3K2 K260me0 peptide with heavy extract. Beads of each pair of peptide pulldown were then pooled together, washed and extracts were resuspended in Laemmli buffer and resolved by SDS-PAGE. In-gel trypsin digestion was performed and peptides purified using C18 stage tips (Fisher) before Mass Spectrometry analysis to quantify the ratio of each potential binders for K260me0 and K260me3 peptides, in forward and reverse condition. To identify outliers in both the forward and the reverse experiment, boxplot statistics was applied (cut off = 1.5× interquartile range). Proteins identified as outlier in both experiments are assigned as significant interactors. Amino acid complements used for SILAC are L-Lysine-2HCl (Thermo Scientific 88429), L-Arginine-HCl (Thermo Scientific 88427), 2H4-L-Lysine-2HCl (Thermo Scientific 88438), 13C6-L-Arginine-HCl (Thermo Scientific 88433), L-Proline (Thermo Scientific 88430).
Active Ras pull-down and detection
Ras activity refers to the level of guanosine triphosphate-bound Ras, which is able to bind Ras binding domain (RBD) of RAF-1 as measured using a RBD-domain pull-down assay kit as recommended by the manufacturer (The Active Ras Pull-Down and Detection Kit, Thermo Scientific). Briefly, tumor biopsies were homogenized on ice in lysis buffer containing 25 mM 4-(2–hydroxyethyl)-1-piperazineethanesulfonic acid (pH 7.5), 1% Igepal CA-630, 150 mm NaCl, 0.25% sodium deoxycholate, 10% glycerol, 25 mm NaF, 10 mm MgCl2, 1 mm ethylenediaminetetraacetic acid, 10 μg/ml aprotinin, 10 μg/ml leupeptin and 1 mm sodium orthovanadate. These samples were sonicated and centrifuged at 15 000g for 10 min at 4°C to remove cellular debris. Protein concentration was measured. Equal amounts of lysate were incubated for 30 min at 4 °C with agarose beads coated with RBD. The beads were then washed three times with ice-cold lysis buffer, boiled for 5 min at 95 °C, and active Ras was analyzed by immunoblotting following standard protocol using Ras-specific antibodies (Thermo Scientific). For comparison to total Ras protein, 2% of total lysates used for pulldown was analyzed by immunoblot.
Cancer xenografts
For xenograft analysis, 500,000 CFPac1 cells were injected into the flank of NSG mice with Matrigel (BD Bioscience). Tumor volume was measured at the times indicated and calculated using the ellipsoid formula (length × width2).
Cell assays
Anchorage-independent growth was assessed in soft agar assays. Cell proliferation was assessed by counting cell number at indicated days and expressed relative to the control as previously described30. Cell viability in response to treatment with the MEK inhibitor Trametinib (Selleckchem) was measured by an MTT assay (Roche) according to the manufacturer's instructions.
Statistics
Kaplan-Meier survival curves were calculated using the survival time for each mouse from all littermate groups. The log-rank test was used to test for significant differences between the groups. For image quantification and gene expression analysis statistical significance was assayed by Student's t-test with the Prism GraphPad software (two-tailed unpaired and paired t-test depending on the experiment – variance was first systematically examined using an F-test). *: p-value<0.05; **: p-value<0.01; ***: p-value<0.001; ns: not significant. Data are represented as mean +/− standard error of the mean (SEM).
Extended Data
Extended Data Figure 1. SMYD3 is a highly overexpressed KMT in Ras-associated cancers.
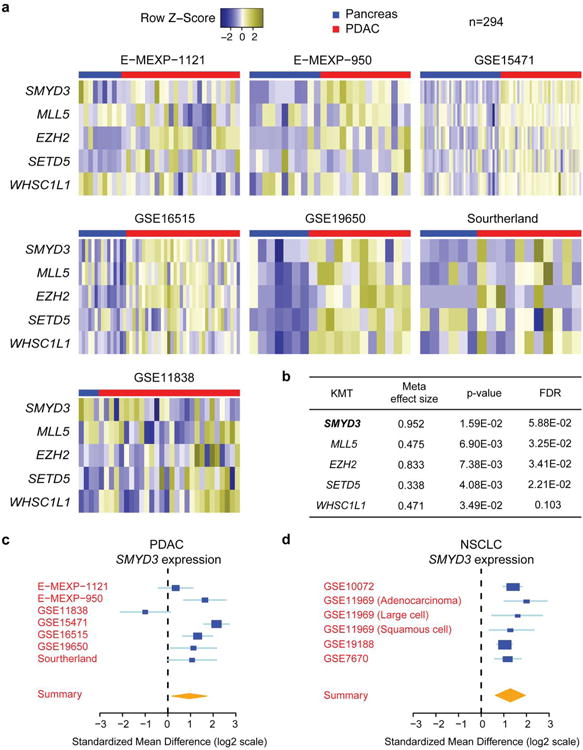
a, Analysis of seven publically available human pancreatic ductal adenocarcinoma (PDAC) gene expression studies from the NCBI GEO and EBI ArrayExpress for SMYD3 levels. The red line indicates expression of SMYD3 in pancreatic cancer biopsies (n=203), the blue line marks normal pancreas samples (n=91). The scale shows relative expression levels (log2). b, A bioinformatics meta-analysis identified 5 lysine methyltransferase overexpressed in human pancreatic ductal adenocarcinoma (PDAC). Meta-effect size and statistical tools are described in the Methods. FDR, false discovery rate. c, d, Summary of SMYD3 expression levels in seven (n=294 independent samples) publically-available expression datasets of PDAC and six datasets (n=319 tumors and n=147 normal independent samples) of non-small cell lung cancer (NSCLC), respectively. Detailed statistical description in the Methods section.
Extended Data Figure 2. Analysis of SMYD3 expression in human and mouse PDAC and lung adenocarcinoma (LAC).
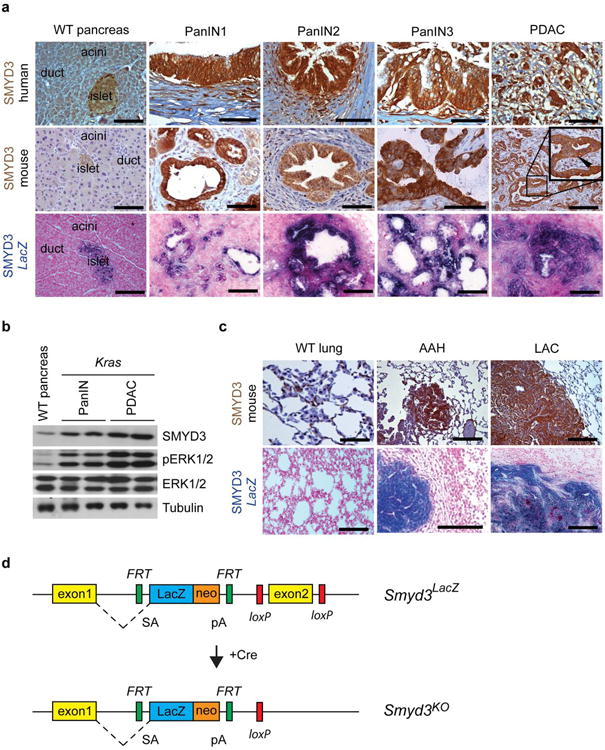
a, Immunohistochemical analysis of SMYD3 expression in mouse and human WT pancreas, PanIN lesions, and PDAC. The expression pattern was further analyzed using a Smyd3LacZ reporter knock-in strain. Smyd3LacZ mice were crossed to p48;KrasG12D (Kras) mice and studied at progressing stages of disease. Analysis of LacZ activity by X-gal staining as a surrogate for Smyd3 expression is shown (lower panel) (see Extended data Fig. 3 for a cartoon of the knock-in allele). b, Immunoblot analysis with the indicated antibodies on tumor biopsy lysates fromwild-type pancreas and from the pancreas of Kras mutant mice at 4.5 and 9 months of age when mice develop PanIN and PDAC, respectively (each time point represents two biological replicates). c, IHC analysis of SMYD3 expression in normal lung, atypical adenomatous hyperplasia (AAH), and lung adenocarcinoma (LAC). X-gal analysis of LacZ activity in Kras-driven tumors with the Smyd3LacZ reporter strain (lower panel). All images shown are representative. Arrowheads indicate nuclear localization of SMYD3. Scale bars, 50 μm. d, Smyd3 knockout allele diagram. In this allele, insertion of a LacZ cassette with a strong splice acceptor in intron 2 of the Smyd3 gene creates a mutant allele serving additionally as a reporter (Smyd3LacZ). Expression of the Cre recombinase in cells removes the LacZ cassette and further deletes Smyd3 exon 2, resulting in a null allele Smyd3KO. SA, splice acceptor, pA, polyadenylation signal.
Extended Data Figure 3. Smyd3 deletion inhibits pancreatic tumorigenesis.
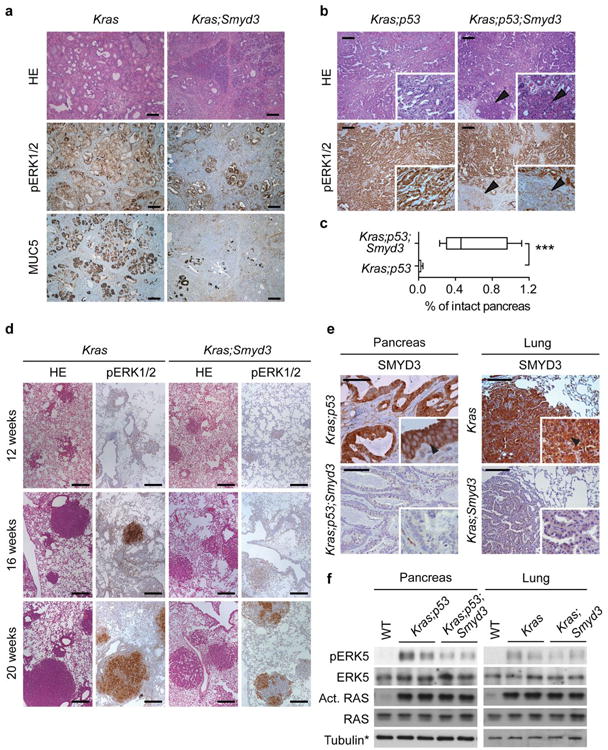
a, Analysis of pancreatic tumorigenesis at 6 months in Kras and Kras;Smyd3 mutant mice. Representative serial histology section (HE), IHC for pERK1/2 and the PanIN marker MUC5. b, Pancreatic cancer phenotypes in Kras;p53 and Kras;p53;Smyd3 mutant mice. Representative IHC for pERK1/2. Arrowheads indicate areas with intact acinar cells. c, Quantitation of intact normal acinar area (Amylase positive area) in Kras;p53 and Kras;p53;Smyd3 mutant mice. Data are represented as mean +/− SEM. ***: p-value<0.001 (two-tailed unpaired Student's t-test). d, Representative HE and pERK1/2 IHC images of lung sections from Kras and Kras;Smyd3 mutant mice 12, 16 and 20 weeks after Ad-Cre infection. pERK1/2 is a marker of Ras activity and advanced tumors. e, f IHC analysis of SMYD3 expression in the PDAC (e) and LAC (h) mouse models. Arrowheads indicate cytoplasmic localization of SMYD3. Scale bars, 50 μm. g, h, Immunoblot analysis with the indicated antibodies probing (g) pancreatic adenocarcinoma or (h) lung adenocarcinoma tumor lysates dissected from Kras and Kras;Smyd3 mutant mice. Active Ras corresponds to Ras protein in the GTP-bound state pulled down with the RAF Ras-Binding Domain (RBD) (see Methods). *Tubulin loading control as in Figure 1j and 2f, respectively.
Extended Data Figure 4. SMYD3 functions to maintain the tumorigenic characteristics of human and murine cancer cells.
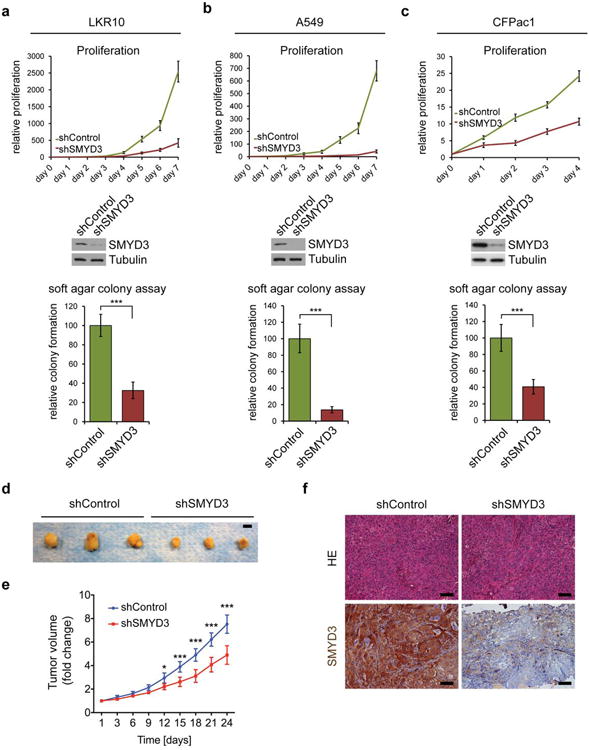
a-c, Cell proliferation rates (top panels) and colony formation in soft agar assays (bottom panels) of murine LAC cell line LKR10 (a), human LAC cell line A549 (b), or human PDAC cell line CFPac1 (c) with or without SMYD3 depletion by stable shRNA (respective immunoblot in middle panels). d-f, SMYD3 depletion in CFPac1 attenuates tumor growth in mouse xenografts. d, Macroscopic picture of xenografts from control and SMYD3 knock-down tumors at the end of the experiment. Scale bar, 1 cm. e, Volume analysis shows that shSMYD3 significantly inhibits the expansion of pancreatic tumors (n=6 for each group). f, HE of the tumors and IHC confirmation of SMYD3 expression and knock-down. All scale bars, 50 μm. *: p-value<0.05; **: p-value<0.01; ***: p-value<0.001 (two-tailed unpaired Student's t-test). Data are represented as mean +/− SEM.
Extended Data Figure 5. Lentiviral reconstitution of SMYD3 in pancreatic acinar-to-ductal-metaplasia (ADM) assays and in lung cancer cells in vivo.
a, IHC analysis of SMYD3 reconstitution in the lung (from Figure 3a). b, Immunofluorescent detection of SMYD3 expression in wild-type and transduced acinar clusters (left panel). Acini (asterisk) transduced with lenti-Cre caring wild type SMYD3 but not catalytically inactive SMYD3F183A undergo ADM and form ducts (arrowhead) ex vivo. c, Quantitation of acinar and ductal clusters after lentiviral infection (each treatment represents four independent biological replicates). Data are represented as mean +/− SEM. *: p-value<0.05 (two-tailed unpaired Student's t-test).
Extended Data Figure 6. SMYD3 specifically methylates MAP3K2 at lysine 260 in vitro.
a, SMYD3 methylates MAP3K2 on protein arrays. Representative image (n=3 independent experiments) showing a SMYD3 methylation assay on a ProtoArray. The close-up shows the two independent MAP3K2 spots on the array being methylated. b, SMYD3 is detected in the cytoplasm and not the nucleus in LKR10 cells. Immunoblot analysis with the indicated antibodies of LKR10 cell lysates biochemically separated into cytoplasmic, nuclear, and chromatin fractions (see Methods). c, SMYD3 catalytic efficiency is two orders of magnitude greater on MAP3K2 than on H4. kcat, KM, and kcat/KM values of SMYD3 activity on recombinant H4 and MAP3K2 as substrates are shown. d, Schematic of the H3K4* mutant form used in (d). Note that the only lysine available to be methylated in H3 is present at K4. e, In vitro methylation assay on full-length recombinant MAP3K2, H3, or H3K4* with recombinant SMYD3 and PRDM9. Top panels: short and long exposure autoradiograms of the methylation assay. No signal was detected for SMYD3 on H3 and H3K4* after long exposures. The asterisk and line indicate breakdown products of MAP3K2 that contain K260 and can be detected in this methylation assay upon long exposure. Bottom panel: Coomassie stain of proteins in the reaction. f, Positive control of activity for enzymes used in Fig. 3f-g on their known respective substrates (MAP3K2, histone H3, nucleosome or RelA as indicated). g, In vitro methylation assays using MAP3K2 K260meo, me1, me2 or me3 peptides as SMYD3 substrates. Dot blot is shown as control of peptide's comparable concentration used for the methylation assay. h, Mass spectrometry analysis of SMYD3 methylation activity on unmodified MAP3K2 K260 peptide. i, Specificity of the indicated MAP3K2-K260me antibodies in dot blot assays using MAP3K2 K260meo, me1, me2 or me3 peptides. j, MAP3K2 is methylated in cells upon SMYD3 overexpression. Immunoblot analysis with the indicated antibodies from 293T cells lysates after Flag immunoprecipitation in cells overexpressing Flag-MAP3K2 and/or HA-SMYD3.
Extended Data Figure 7. SMYD3 and MAP3K2 knockdown both impair MAP Kinase signaling.
a-d, Immunoblot analysis with the indicated antibodies of LKR10 (a-b), A549 (c), and CFPac1 (d) lysates. Asterisk indicates slower migrating ERK5 species that is phosphorylated. Stimulation: 10% serum-complemented media for 15min (b) or EGF for 15min at 25ng/μl (a, c, d). Immunoblots are representative of 3 independant biological replicates. e-f, SMYD3 methylation of MAP3K2 does not alter the intrinsic kinase activity of MAP3K2. e, Immunoblot analysis with the indicated antibodies from lysates of 293T cells transfected with control vector, wild-type SMYD3, catalytically dead SMYD3F183A, wild-type MAP3K2, MAP3K2K260A, or kinase dead MAP3K2K385M. f, Methylation of MAP3K2 does not alter its in vitro kinase activity. In vitro kinase assays were performed with the indicated recombinant versions of MAP3K2 (wild-type, SMYD3-resistant K260A mutant, or kinase dead K385 mutant) pre-methylated with wild-type SMYD3 or as a control, inactive SMYD3, using MEK1 as a substrate. MEK1 phosphorylation was detected by immunoblot analysis with the indicated antibody.
Extended Data Figure 8. SMYD3 knockout augments the effects of the MEK1/2 inhibitor Trametinib (GSK1120212) in vivo.
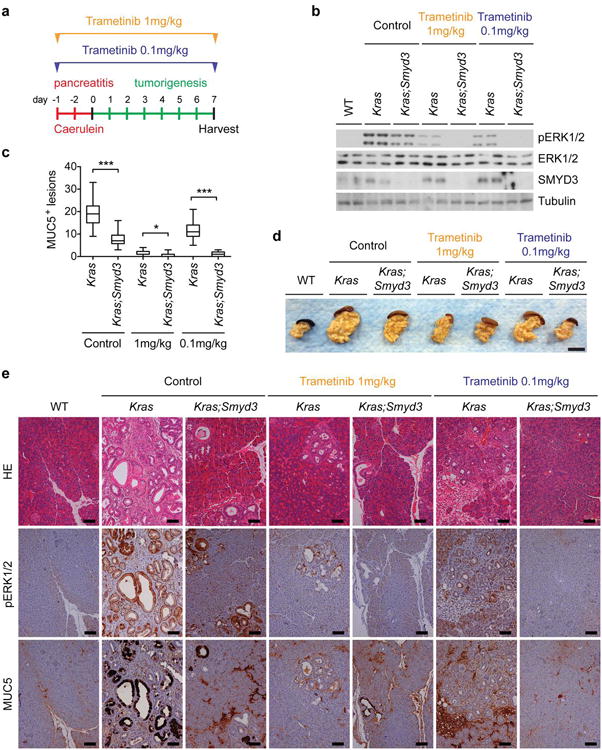
a, Schematic of the caerulein pancreatitis-induced tumorigenesis protocol. Mice were treated with a normal dose of Trametinib (1mg/kg IP daily) or a low dose (0.1mg/kg IP daily) or vehicle control. b, Immunoblot analysis with indicated antibodies of two independent pancreas biopsies per treatment group. c, Quantification of MUC5-positive lesions in caerulein-treated pancreata from Kras and Kras;Smyd3 mutant mice treated with Trametinib or vehicle control (n=5, each treatment). *: p-value<0.05; ***: p-value<0.001 (two-tailed unpaired Student's t-test). Data are represented as mean +/− SEM. d, Representative macroscopic pictures of pancreata from each treatment group. Scale bar, 1 cm. e, Representative serial HE staining and IHC for pERK1/2, a marker of Ras activity, and MUC5, a marker of PanIN lesions. All scale bars, 50 μm.
Extended Data Figure 9. SMYD3 depletion augments the effects of the MEK1/2 inhibitor Trametinib (GSK1120212) in Ras-driven cancer cells.
a-c, Relative cell proliferation rates (bottom panel) of murine LAC cell line LKR10 (a), human LAC cell line A549 (b), or human PDAC cell line CFPac1 (c) with or without SMYD3 depletion by stable shRNA (SMYD3 proteins levels are shown in top panel) in response to the indicated doses of Trametinib. Experiments shown represent an average of 3 independent experiments performed in triplicates for each cancer line. Values represent the number of cells relative to control shRNA cells without treatment at 48hrs. b, Constitutively active MEK1 (MEK1DD) increases EGF-mediated ERK1/2 activation in SMYD3 depleted-cells. Immunoblot analysis with the indicated antibodies using lysates from A549 cells stably expressing shControl or shSMYD3 and transfected with HA-MEK1DD. Stimulation: EGF treatment for 15min at 25ng/μl.
Extended Data Figure 10. Treatment with the PP2A inhibitor cantharidin phenocopies SMYD3 function in vivo.
a, Schematic of the caerulein pancreatitis-induced tumorigenesis protocol. Mice were treated with the PP2A inhibitor cantharidin (iPP2A, 0.15mg/kg IP twice a day) or vehicle control. b, Immunoblot analysis with indicated antibodies on two independent pancreas biopsies per treatment group. c, Macroscopic pictures of WT and Kras;Smyd3 mutant pancreata. Note that treatment with the PP2A inhibitor leads to the development of enlarged, “hard” pancreata characteristic of tumorigenic development even in Kras;Smyd3 mutant mice. Scale bar, 1 cm. d, Representative serial hematoxylin and eosin (HE) staining and IHC for pERK1/2, a marker of Ras activity, and MUC5, a marker of PanIN lesions. All scale bars, 50 μm. e, Summary model for SMYD3 regulation of MAP Kinase signaling after MAP3K2 methylation. Oncogenic Ras activates several kinase cascades that play important roles in pancreas and lung cancer development, including four major MAPK pathways (ERK1/2, ERK5, JNK, and p38) as well as AKT signaling. SMYD3 is frequently overexpressed in pancreatic and lung cancers, two cancer types that are commonly driven by oncogenic Ras signaling. Overexpression of SMYD3 and the resulting methylation of MAP3K2 at K260 potentiate activation of kinases like ERK1/2 and ERK5 in response to stimuli like oncogenic Ras. We postulate a mechanism in which the PP2A complex is unable to bind methylated MAP3K2, which decreases the ability of this enzyme to terminate activating phosphorylation events on MAP3K2 and/or MAP3K2 downstream targets. Under conditions with excessive SMYD3 protein, the physiologic relationship between PP2A and MAP3K2 is disrupted and results in an increased pathologic MAP3K2 signaling, which cooperates with Ras to promote tumorigenesis.
Acknowledgments
We thank members of the Gozani lab for critical reading of the manuscript and A. Smits for help with mass spectrometry data visualization. This work was supported in part by grants from the NIH to O.G. and J.S. (RO1 CA172560) and an NIH Innovator grant (DP2 OD007447) from the Office of the Director for B.A.G. M.V. was supported by a grant from NWO-VIDI, P.K.M. was supported by the Tobacco-Related Disease Research Program, a Dean's Fellowship from Stanford University, and the Child Health Research Institute and Lucile Packard Foundation for Children's Health at Stanford. N.R. was supported by a grant from the Fondation pour la Recherche Medicale.
Footnotes
Author Contributions: N.R. and P.K.M. contributed equally to this work and are listed alphabetically. They were responsible for the experimental design, execution, data analysis, and manuscript preparation. P.K. and A.J.B. performed the bioinformatics meta-analysis. P.J. and M.V. performed the SILAC experiments. S.L. and B.A.G. performed the methylated peptide mass spectrometry experiments. A.W. generated recombinant H3 and H3K4R protein. O.B., G.S.V., M.H., D.D. P.J.T. and R.G.K. generated SMYD3 and MAP3K2me antibodies, the MAP3K2 peptides, and determined the catalytic efficiency of SMYD3. O.G. and J.S. were equally responsible for supervision of research, data interpretation, and manuscript preparation.
References
- 1.Helin K, Dhanak D. Chromatin proteins and modifications as drug targets. Nature. 2013;502:480–488. doi: 10.1038/nature12751. [DOI] [PubMed] [Google Scholar]
- 2.Watanabe T, et al. Differential gene expression signatures between colorectal cancers with and without KRAS mutations: Crosstalk between the KRAS pathway and other signalling pathways. Eur J Cancer. 2011;47:1946–1954. doi: 10.1016/j.ejca.2011.03.029. [DOI] [PubMed] [Google Scholar]
- 3.Gaedcke J, et al. Mutated KRAS results in overexpression of DUSP4, a MAP-kinase phosphatase, and SMYD3, a histone methyltransferase, in rectal carcinomas. Genes Chromosomes Cancer. 2010;49:1024–1034. doi: 10.1002/gcc.20811. [DOI] [PMC free article] [PubMed] [Google Scholar]
- 4.Hamamoto R, et al. SMYD3 encodes a histone methyltransferase involved in the proliferation of cancer cells. Nature Cell Biol. 2004;6:731–740. doi: 10.1038/ncb1151. [DOI] [PubMed] [Google Scholar]
- 5.Pylayeva-Gupta Y, Grabocka E, Bar-Sagi D. RAS oncogenes: weaving a tumorigenic web. Nature Rev Cancer. 2011;11:761–774. doi: 10.1038/nrc3106. [DOI] [PMC free article] [PubMed] [Google Scholar]
- 6.Van Aller GS, et al. Smyd3 regulates cancer cell phenotypes and catalyzes histone H4 lysine 5 methylation. Epigenetics. 2012;7:340–343. doi: 10.4161/epi.19506. [DOI] [PMC free article] [PubMed] [Google Scholar]
- 7.Jackson EL, et al. Analysis of lung tumor initiation and progression using conditional expression of oncogenic K-ras. Genes Dev. 2001;15:3243–3248. doi: 10.1101/gad.943001. [DOI] [PMC free article] [PubMed] [Google Scholar]
- 8.Hingorani SR, et al. Preinvasive and invasive ductal pancreatic cancer and its early detection in the mouse. Cancer Cell. 2003;4:437–450. doi: 10.1016/s1535-6108(03)00309-x. [DOI] [PubMed] [Google Scholar]
- 9.Zhu L, Shi G, Schmidt CM, Hruban RH, Konieczny SF. Acinar cells contribute to the molecular heterogeneity of pancreatic intraepithelial neoplasia. Am J Pathol. 2007;171:263–273. doi: 10.2353/ajpath.2007.061176. [DOI] [PMC free article] [PubMed] [Google Scholar]
- 10.Guerra C, et al. Chronic pancreatitis is essential for induction of pancreatic ductal adenocarcinoma by K-Ras oncogenes in adult mice. Cancer Cell. 2007;11:291–302. doi: 10.1016/j.ccr.2007.01.012. [DOI] [PubMed] [Google Scholar]
- 11.Means AL, et al. Pancreatic epithelial plasticity mediated by acinar cell transdifferentiation and generation of nestin-positive intermediates. Development. 2005;132:3767–3776. doi: 10.1242/dev.01925. [DOI] [PubMed] [Google Scholar]
- 12.Morris JPt, Cano DA, Sekine S, Wang SC, Hebrok M. Beta-catenin blocks Kras-dependent reprogramming of acini into pancreatic cancer precursor lesions in mice. J Clin Invest. 2010;120:508–520. doi: 10.1172/JCI40045. [DOI] [PMC free article] [PubMed] [Google Scholar]
- 13.Bardeesy N, et al. Both p16(Ink4a) and the p19(Arf)-p53 pathway constrain progression of pancreatic adenocarcinoma in the mouse. Proc Natl Acad Sci USA. 2006;103:5947–5952. doi: 10.1073/pnas.0601273103. [DOI] [PMC free article] [PubMed] [Google Scholar]
- 14.Feldser DM, et al. Stage-specific sensitivity to p53 restoration during lung cancer progression. Nature. 2010;468:572–575. doi: 10.1038/nature09535. [DOI] [PMC free article] [PubMed] [Google Scholar]
- 15.Junttila MR, et al. Selective activation of p53-mediated tumour suppression in high-grade tumours. Nature. 2010;468:567–571. doi: 10.1038/nature09526. [DOI] [PMC free article] [PubMed] [Google Scholar]
- 16.Johnson L, et al. Somatic activation of the K-ras oncogene causes early onset lung cancer in mice. Nature. 2001;410:1111–1116. doi: 10.1038/35074129. [DOI] [PubMed] [Google Scholar]
- 17.Levy D, et al. A proteomic approach for the identification of novel lysine methyltransferase substrates. Epigenetics Chromatin. 2011;4:19. doi: 10.1186/1756-8935-4-19. [DOI] [PMC free article] [PubMed] [Google Scholar]
- 18.Maruyama T, et al. CHIP-dependent termination of MEKK2 regulates temporal ERK activation required for proper hyperosmotic response. EMBO J. 2010;29:2501–2514. doi: 10.1038/emboj.2010.141. [DOI] [PMC free article] [PubMed] [Google Scholar]
- 19.Sun W, et al. MEK kinase 2 and the adaptor protein Lad regulate extracellular signal-regulated kinase 5 activation by epidermal growth factor via Src. Mol Cell Biol. 2003;23:2298–2308. doi: 10.1128/MCB.23.7.2298-2308.2003. [DOI] [PMC free article] [PubMed] [Google Scholar]
- 20.Fanger GR, Johnson NL, Johnson GL. MEK kinases are regulated by EGF and selectively interact with Rac/Cdc42. EMBO J. 1997;16:4961–4972. doi: 10.1093/emboj/16.16.4961. [DOI] [PMC free article] [PubMed] [Google Scholar]
- 21.Choi MC, et al. A direct HDAC4-MAP kinase crosstalk activates muscle atrophy program. Mol Cell. 2012;47:122–132. doi: 10.1016/j.molcel.2012.04.025. [DOI] [PMC free article] [PubMed] [Google Scholar]
- 22.Matitau AE, Gabor TV, Gill RM, Scheid MP. MEKK2 kinase association with 14-3-3 protein regulates activation of c-Jun N-terminal kinase. J Biol Chem. 2013;288:28293–28302. doi: 10.1074/jbc.M113.511352. [DOI] [PMC free article] [PubMed] [Google Scholar]
- 23.Enomoto A, et al. Negative regulation of MEKK1/2 signaling by serine-threonine kinase 38 (STK38) Oncogene. 2008;27:1930–1938. doi: 10.1038/sj.onc.1210828. [DOI] [PubMed] [Google Scholar]
- 24.Brunet A, Pages G, Pouyssegur J. Constitutively active mutants of MAP kinase kinase (MEK1) induce growth factor-relaxation and oncogenicity when expressed in fibroblasts. Oncogene. 1994;9:3379–3387. [PubMed] [Google Scholar]
- 25.Raman M, Chen W, Cobb MH. Differential regulation and properties of MAPKs. Oncogene. 2007;26:3100–3112. doi: 10.1038/sj.onc.1210392. [DOI] [PubMed] [Google Scholar]
- 26.Eichhorn PJ, Creyghton MP, Bernards R. Protein phosphatase 2A regulatory subunits and cancer. Biochim Biophys Acta. 2009;1795:1–15. doi: 10.1016/j.bbcan.2008.05.005. [DOI] [PubMed] [Google Scholar]
- 27.Li YM, Casida JE. Cantharidin-binding protein: identification as protein phosphatase 2A. Proc Natl Acad Sci USA. 1992;89:11867–11870. doi: 10.1073/pnas.89.24.11867. [DOI] [PMC free article] [PubMed] [Google Scholar]
Extended Data References
- 28.Jonkers J, et al. Synergistic tumor suppressor activity of BRCA2 and p53 in a conditional mouse model for breast cancer. Nat Genet. 2001;29:418–425. doi: 10.1038/ng747. [DOI] [PubMed] [Google Scholar]
- 29.Kawaguchi Y, et al. The role of the transcriptional regulator Ptf1a in converting intestinal to pancreatic progenitors. Nat Genet. 2002;32:128–134. doi: 10.1038/ng959. [DOI] [PubMed] [Google Scholar]
- 30.Van Aller GS, et al. Smyd3 regulates cancer cell phenotypes and catalyzes histone H4 lysine 5 methylation. Epigenetics : official journal of the DNA Methylation Society. 2012;7:340–343. doi: 10.4161/epi.19506. [DOI] [PMC free article] [PubMed] [Google Scholar]
- 31.Hruban RH, et al. Pathology of genetically engineered mouse models of pancreatic exocrine cancer: consensus report and recommendations. Cancer Res. 2006;66:95–106. doi: 10.1158/0008-5472.CAN-05-2168. [DOI] [PubMed] [Google Scholar]
- 32.DuPage M, Dooley AL, Jacks T. Conditional mouse lung cancer models using adenoviral or lentiviral delivery of Cre recombinase. Nat Protoc. 2009;4:1064–1072. doi: 10.1038/nprot.2009.95. [DOI] [PMC free article] [PubMed] [Google Scholar]
- 33.Winslow MM, et al. Suppression of lung adenocarcinoma progression by Nkx2-1. Nature. 2011;473:101–104. doi: 10.1038/nature09881. [DOI] [PMC free article] [PubMed] [Google Scholar]
- 34.Tiscornia G, Singer O, Verma IM. Production and purification of lentiviral vectors. Nat Protoc. 2006;1:241–245. doi: 10.1038/nprot.2006.37. [DOI] [PubMed] [Google Scholar]
- 35.Heid I, et al. Early requirement of Rac1 in a mouse model of pancreatic cancer. Gastroenterology. 2011;141:719–730. doi: 10.1053/j.gastro.2011.04.043. [DOI] [PubMed] [Google Scholar]
- 36.Mazur PK, et al. Notch2 is required for progression of pancreatic intraepithelial neoplasia and development of pancreatic ductal adenocarcinoma. Proc Natl Acad Sci USA. 2010;107:13438–13443. doi: 10.1073/pnas.1002423107. [DOI] [PMC free article] [PubMed] [Google Scholar]
- 37.Khatri P, et al. A common rejection module (CRM) for acute rejection across multiple organs identifies novel therapeutics for organ transplantation. J Exp Med. 2013;201:2205–2221. doi: 10.1084/jem.20122709. [DOI] [PMC free article] [PubMed] [Google Scholar]
- 38.Storey JD. A direct approach to false discovery rates. Journal of the Royal Statistical Society: Series B (Statistical Methodology) 2002;64:479–498. [Google Scholar]
- 39.Dyer PN, et al. Reconstitution of nucleosome core particles from recombinant histones and DNA. Meth Enzym. 2004;375:23–44. doi: 10.1016/s0076-6879(03)75002-2. [DOI] [PubMed] [Google Scholar]
- 40.Brown MA, Sims RJ, 3rd, Gottlieb PD, Tucker PW. Identification and characterization of Smyd2: a split SET/MYND domain-containing histone H3 lysine 36-specific methyltransferase that interacts with the Sin3 histone deacetylase complex. Mol Cancer. 2006;5:26. doi: 10.1186/1476-4598-5-26. [DOI] [PMC free article] [PubMed] [Google Scholar]
- 41.Green EM, Mas G, Young NL, Garcia BA, Gozani O. Methylation of H4 lysines 5, 8 and 12 by yeast Set5 calibrates chromatin stress responses. Nat Struct Mol Bio. 2012;19:361–363. doi: 10.1038/nsmb.2252. [DOI] [PMC free article] [PubMed] [Google Scholar]
- 42.Grey C, et al. Mouse PRDM9 DNA-binding specificity determines sites of histone H3 lysine 4 trimethylation for initiation of meiotic recombination. PLoS Biology. 2011;9:e1001176. doi: 10.1371/journal.pbio.1001176. [DOI] [PMC free article] [PubMed] [Google Scholar]
- 43.Kuo AJ, et al. NSD2 links dimethylation of histone H3 at lysine 36 to oncogenic programming. Mol Cell. 2011;44:609–620. doi: 10.1016/j.molcel.2011.08.042. [DOI] [PMC free article] [PubMed] [Google Scholar]
- 44.Levy D, et al. Lysine methylation of the NF-kappaB subunit RelA by SETD6 couples activity of the histone methyltransferase GLP at chromatin to tonic repression of NF-kappaB signaling. Nat Immunol. 2011;12:29–36. doi: 10.1038/ni.1968. [DOI] [PMC free article] [PubMed] [Google Scholar]
- 45.Moore KE, et al. A general molecular affinity strategy for global detection and proteomic analysis of lysine methylation. Mol Cell. 2013;50:444–456. doi: 10.1016/j.molcel.2013.03.005. [DOI] [PMC free article] [PubMed] [Google Scholar]
- 46.Saddic LA, et al. Methylation of the retinoblastoma tumor suppressor by SMYD2. The J Biol Chem. 2010;285:37733–37740. doi: 10.1074/jbc.M110.137612. [DOI] [PMC free article] [PubMed] [Google Scholar]
- 47.Shi X, et al. Modulation of p53 function by SET8-mediated methylation at lysine 382. Mol Cell. 2007;27:636–646. doi: 10.1016/j.molcel.2007.07.012. [DOI] [PMC free article] [PubMed] [Google Scholar]
- 48.Strahl BD, et al. Set2 is a nucleosomal histone H3-selective methyltransferase that mediates transcriptional repression. Molecular and cellular biology. 2002;22:1298–1306. doi: 10.1128/mcb.22.5.1298-1306.2002. [DOI] [PMC free article] [PubMed] [Google Scholar]
- 49.Tachibana M, Sugimoto K, Fukushima T, Shinkai Y. Set domain-containing protein, G9a, is a novel lysine-preferring mammalian histone methyltransferase with hyperactivity and specific selectivity to lysines 9 and 27 of histone H3. J Biol Chem. 2001;276:25309–25317. doi: 10.1074/jbc.M101914200. [DOI] [PubMed] [Google Scholar]