

Abstract
The tonotopic map of the mammalian cochlea is commonly thought to be determined by the passive mechanical properties of the basilar membrane. The other tissues and cells that make up the organ of Corti also have passive mechanical properties; however, their roles are less well understood. In addition, active forces produced by outer hair cells (OHCs) enhance the vibration of the basilar membrane, termed cochlear amplification. Here, we studied how these biomechanical components interact using optical coherence tomography, which permits vibratory measurements within tissue. We measured not only classical basilar membrane tuning curves, but also vibratory responses from the rest of the organ of Corti within the mouse cochlear apex in vivo. As expected, basilar membrane tuning was sharp in live mice and broad in dead mice. Interestingly, the vibratory response of the region lateral to the OHCs, the “lateral compartment,” demonstrated frequency-dependent phase differences relative to the basilar membrane. This was sharply tuned in both live and dead mice. We then measured basilar membrane and lateral compartment vibration in transgenic mice with targeted alterations in cochlear mechanics. Prestin499/499, Prestin−/−, and TectaC1509G/C1509G mice demonstrated no cochlear amplification but maintained the lateral compartment phase difference. In contrast, SfswapTg/Tg mice maintained cochlear amplification but did not demonstrate the lateral compartment phase difference. These data indicate that the organ of Corti has complex micromechanical vibratory characteristics, with passive, yet sharply tuned, vibratory characteristics associated with the supporting cells. These characteristics may tune OHC force generation to produce the sharp frequency selectivity of mammalian hearing.
Keywords: cochlea, hair cell, cochlear amplifier, biomechanics, electromotility, hearing, hearing loss
sound pressure waves propagate up the length of the cochlea in the form of a traveling wave due to gradients in basilar membrane stiffness and mass that create a series of cascading, overlapping band-pass filters (von Bekesy 1960). The peak location of the traveling wave varies according to the tonotopic map defined by these passive mechanical gradients. High frequencies are represented at the base, and low frequencies are represented at the apex. Active processes within outer hair cells (OHCs) associated with somatic electromotility (Brownell et al. 1985) and/or stereociliary bundle motility (Nin et al. 2012) generate force to amplify and sharpen the traveling wave. Sound stimulation of the basilar membrane can produce >1,000× larger vibratory responses and >15× sharper tuning in living compared with dead animals (Nuttall and Dolan 1996; Rhode 1971; Robles and Ruggero 2001). Eliminating the power to drive OHC motility by removing the endocochlear potential (Ruggero and Rich 1991), removing OHC stimulation by removing the tectorial membrane (Legan et al. 2000), or inactivating the OHC motor protein prestin (Dallos et al. 2008) all reduce basilar membrane sensitivity and tuning sharpness to levels similar to those in dead animals. These data indicate that the underlying mechanisms for both high sensitivity and sharp tuning of the basilar membrane are intimately coupled, and that OHCs are required for both features of cochlear amplification (Neely and Kim 1986; Zweig 1991).
However, the concept that OHCs simply amplify the broadly tuned traveling wave as defined by the passive mechanics of the basilar membrane is not adequate to explain the exquisite sharpness of basilar membrane tuning that has been measured (Allen and Fahey 1993; Robles and Ruggero 2001). An additional filter within the organ of Corti has been proposed as a way to sharpen tuning (Evans and Klinke 1982; Markin and Hudspeth 1995; Mountain et al. 1983). A simple way to describe this theory is that OHC force production would only be in phase with basilar membrane vibration near the frequency tuned to that tonotopic location, whereas at lower and higher frequencies, force production would not be in phase with basilar membrane vibration. The phase characteristics of this additional filtering would thus increase the sharpness of basilar membrane tuning because OHCs could only provide positive feedback over a narrow bandwidth. Consistent with this hypothesis, a frequency-dependent phase difference between the basilar membrane and the reticular lamina has been demonstrated in the base of the guinea pig cochlea using optical coherence tomography (OCT) (Chen et al. 2011; Zha et al. 2012). Similarly, the electric field emanating from the receptor potential within the OHCs demonstrates a frequency-dependent phase shift relative to basilar membrane vibration (Dong and Olson 2013).
Various components of the organ of Corti have been advocated to provide this additional filtering, including the tectorial membrane (Geisler and Sang 1995; Gummer et al. 1996; Hubbard 1993; Legan et al. 2000; Russell et al. 2007; Zwislocki and Kletsky 1979), fluid within the tunnel of Corti (Karavitaki and Mountain 2007a), the Deiters' cells (Soons et al. 2013), the stereociliary bundle (Peng and Ricci 2011), and the OHCs themselves (Mountain and Hubbard 1994; Song and Santos-Sacchi 2013; Weitzel et al. 2003). Here, we used a custom spectral domain OCT system (Gao et al. 2013) to further study this issue. Our system is unique in that it permits vibratory measurements within the intact (i.e., unopened) mouse cochlear apex. Because it has good axial resolution, we could noninvasively measure sound-induced vibrations not only within the basilar membrane, but throughout the organ of Corti. We hypothesized that, if additional filtering exists, there should be a region within the tissues of the organ of Corti that has frequency-dependent phase characteristics different than that of the basilar membrane. Furthermore, because our system permits the use of mice, we could study not only wild-type CBA mice, but also several transgenic mouse strains in which specific biomechanical components of the organ of Corti were altered in a targeted manner.
MATERIALS AND METHODS
Animal preparation.
The study protocol was approved by the Stanford Institutional Animal Care and Use Committee. Adult mice of either sex were used. Mouse strains studied included wild-type CBA, Prestin499/499 (Dallos et al. 2008), Prestin−/− (Liberman et al. 2002), TectaC1509G/C1509G (Xia et al. 2010), and SfswapTg/Tg (Moayedi et al. 2014). Most mice were age postnatal days (P) 28–50; however, SfswapTg/Tg mice were age P60–120.
Each mouse was anesthetized with ketamine-xylazine, and its left middle ear bulla surgically opened to visualize the cochlear apex. A calibrated sound delivery system was connected to the ear canal and controlled by custom software (MATLAB 2012b, The Mathworks, Natick, MA). The approach did not alter auditory brain stem responses or distortion product otoacoustic emissions, as determined by measuring thresholds before and after the opening (n > 10). This was expected as only the middle ear was opened, not the cochlea. Our laboratory routinely performs an identical approach to measure compound action potentials, cochlear microphonics, endocochlear potentials, and electrically evoked otoacoustic emissions to assess cochlear function in mice (Cho et al. 2013; Choi and Oghalai 2008; Liu et al. 2011; Xia et al. 2007, 2010, 2013). Vibratory measurements were made using the OCT system and then the mouse was killed by ketamine-xylazine overdose. This did not cause movement of the head. Postmortem measurements were then collected after waiting 10 min. Finally, vibratory measurements from the orbicular apophysis of the malleus (the middle ear ossicular chain) were made.
Scanning spectral domain OCT system.
The concept of Doppler OCT, as well as the specific design of our system, has been previously reported (Chen et al. 1997; Choma et al. 2005; Gao et al. 2013). It is an alternative implementation of a broad-band interferometry technique that has been used to measure vibratory responses at different depth locations within the organ of Corti (Chen et al. 2011; Ren and He 2011) (Fig. 1). Briefly, it is a custom-built spectral domain OCT system based on a broadband light source with a center wavelength of 935 nm with software for data collection and analysis written in MATLAB. The light was directed through an upright microscope onto the structure to be imaged. The reflected light from the sample, when path matched with a reference beam, creates an interference pattern that can be recorded by a custom spectrometer based on a linear camera. With this technique, two fast Fourier transforms (FFTs) are performed. The first FFT is performed on the interferogram, with the magnitude providing the depth-resolved sample reflectivity. An X-Y scan mirror incorporated into the beam path allows for stepping the light across tissue. Scanning in one direction allows for the generation of cross-sectional images. The second FFT step is used only for vibrometry and is discussed in the next section.
Fig. 1.
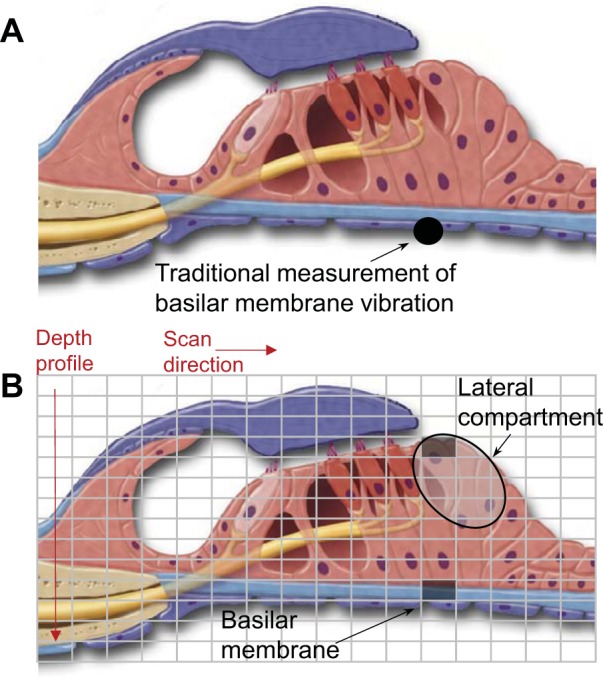
Schematic depiction of the vibrometry methodology. A: with traditional vibrometry methodology, a point measurement of basilar membrane vibration in response to sound stimulation is performed. This is most commonly performed by opening the cochlea, placing a reflective glass bead on the underside of the basilar membrane, and then measuring vibrations of the bead using a laser Doppler vibrometer. B: with the optical coherence tomography (OCT) technique we used, the cochlea was left unopened. The light was scanned over the tissue in the radial direction while collecting depth profiles. Thus vibrometry data were collected from every point in the grid over the organ of Corti. We analyzed vibration of the basilar membrane in the traditional manner by referencing a point measurement (dark rectangle on basilar membrane) to the sound input measured at the ossicular chain. We analyzed the vibration of the lateral compartment of the organ of Corti (large oval) by referencing a point measurement at the apical portion (dark rectangle at top of the lateral compartment) to that of the basilar membrane (dark rectangle on basilar membrane).
In air, the axial resolution of the OCT system, as determined by the full width at half-maximum of the depth-resolved sample reflectivity of a mirrored surface, was 9.4 μm. The lateral resolution of the OCT system was 18 μm, as determined by imaging an US Air Force resolution target and determining the minimum bar width that could be visually distinguished. To investigate the resolution of a structure surrounded by fluid (which has a higher index of refraction than air) and after imaging through the cochlear bone (which scatters light), we removed the apical bone from a mouse cochlea and placed it in a drop of water on top of the mirrored surface and resolution target. Under these conditions, the axial resolution was 6.3 μm, whereas the lateral resolution was 35 μm. For all experiments, we oversampled when collecting cross-sectional data to provide spatial averaging with pixel dimensions of 2.4 μm axially and 15 μm laterally.
Vibrometry with OCT.
At each x–y position, 10,000 images of the spectrally interfered signal were collected at a rate of 16 kHz using a linear camera during the application of sound stimuli to the ear. We used our previously published interleaved sampling technique to double the effective sampling rate to 32 kHz (Applegate et al. 2011). The first FFT was performed on the interferogram for each of the 10,000 images. For each bin in the FFT (i.e., each depth location), the phase information from the first FFT was further analyzed by a second FFT over the 10,000 images to calculate the vibratory magnitude and phase. Because vibratory data come from analyzing the phase of the spectrally interfered signal, the vibration resolution of the system is much better than its image resolution. On a perfect reflector, the measureable vibratory response is on the order of a few picometers. In vivo at the organ of Corti, the signal-to-noise ratio is reduced by 50 to 70 dB because the tissue does not reflect as well and the light has to pass through the otic capsule bone in both directions. As a result, we averaged up to 50 stimulus repetitions to lower the noise floor. This allowed us to measure vibrations as low as 0.2 nm within the mouse organ of Corti. Furthermore, we only considered the vibratory responses at the same frequency as the stimulus frequency that were above a noise threshold, which we defined as the mean plus three times the standard deviation of the noise at nearby frequencies.
Data analysis.
We divided the displacement of the basilar membrane by the displacement of the ossicular chain to determine basilar membrane sensitivity. This ratio is dimensionless. The best frequency, gain, and Q10dB were then calculated from the basilar membrane sensitivity data. The best frequency was the frequency of maximum sensitivity for a given stimulus level. The gain was calculated as the ratio of the peak sensitivities in the live and dead mouse. However, since the sensitivities in the dead mouse were independent of stimulus intensity, we used either the same stimulus level or the lowest measureable stimulus level. The basilar membrane in the dead mouse did not move as much as in the live mouse because there was no cochlear amplification. Therefore, we often could not measure vibration above the noise floor with the quietest stimulus levels. For example, we often had to ratio the peak sensitivity of the live mouse measured using a 40-dB sound pressure level (SPL) stimulus intensity to 1/10th of that measured in the dead mouse using a 60-dB SPL stimulus intensity. The Q10dB was the best frequency divided by the bandwidth 10 dB from the peak response. If data were not present for one side of the tuning curve 10 dB down from the peak response, the bandwidth was extrapolated. If data were not present for either intersection, the Q10dB was not calculated.
The phase of the basilar membrane response was calculated by averaging the phase of all voxels within a 20-μm region of the basilar membrane. The phase of the lateral compartment response (defined in Fig. 1B) was calculated by averaging the phase of all voxels within a 10-μm region, starting at the reticular lamina and extending downward at the same location of the basilar membrane measurement. We then subtracted the phase of the basilar membrane response from that of the lateral compartment to get the phase difference. Values were unwrapped as necessary.
We analyzed the phase difference between the lateral compartment and the basilar membrane by fitting the data to that of a second-order band-pass filter. The rationale for this analysis paradigm is given in the results section (Lateral compartment vibratory measurements). The phase fitting was performed as follows (Sigmaplot 12.5, Systat Software, San Jose, CA):
| 1 |
where ∠H(f) is phase in degrees, f is frequency, Fc is the center frequency, D is a constant to shift the phase data to the +90° and −90° range, and Q is Fc divided by the bandwidth measured between +45° and −45°. From these parameters, the magnitude ∣H(f)∣ was then calculated as follows:
| 2 |
Since most auditory research papers report Q10dB values, rather than the Q value (Q3dB) provided by this equation, we converted all Q values to Q10dB for comparison. This was done by solving Eq. 2 to find the bandwidth between the upper and lower frequency where the magnitude was 10 dB down from the peak magnitude. Dividing the bandwidth by Fc thus provided the Q10dB value.
Histology.
Plastic-embedded sections were made and imaged using previously described techniques (Cho et al. 2013). Similarly, whole mount fluorescence preparations were created and imaged under confocal microscopy using previously published techniques (Xia et al. 2008, 2013). Actin was labeled with phalloidin (Life Technologies, catalog no. A12379), and prestin was immunolabeled (primary antibody: Santa Cruz Biotechnology, catalog no. sc-22692; secondary antibody: Life Technologies, catalog no. A-21082).
Statistics.
Experiments were performed without randomization or blinding. We decided on the number of animals to study based on preliminary data indicating that adequate power could be achieved with the use of at least four animals. The collected data were normally distributed and plotted as means ± SE. When comparing more than two groups, we first performed a one-way ANOVA before using two-tailed Student's t-tests. Paired t-tests were used to compare repeated measures from the same mouse. In some cohorts, we could not record all of the desired measurements from every animal, and so fewer animals were included in the analysis. For these cases, and when comparing data between cohorts, nonpaired t-tests were used.
RESULTS
Traditional basilar membrane vibratory measurements.
To validate the vibratory measurement capabilities of our OCT system, we recorded classical basilar membrane tuning curves from wild-type CBA mice in vivo. For each mouse, cross-sectional imaging was performed to identify the organ of Corti within the apical turn of the cochlea (Fig. 2, A and B). The optical path was then positioned to cross the basilar membrane near its midpoint. Pure tone stimuli of varying frequency and intensity were presented. Vibratory responses were averaged and measured along a ∼20-μm depth within the basilar membrane to produce tuning curves (Fig. 2, C and D). The response of the middle ear ossicular chain was measured to define the sound input to the cochlea. These data were used to normalize the basilar membrane magnitude and phase (Fig. 2, E and F). As expected, the vibration of the basilar membrane exhibited a progressive phase lag as the sound frequency was increased, consistent with traveling wave propagation. In dead mice, the sensitivity and tuning of basilar membrane vibration did not change with stimulus intensity, whereas in live mice both increased as the stimulus intensity decreased. Thus there was more gain with lower stimulus intensities. In addition, the frequency of maximal vibrational amplitude (the best frequency) shifted toward higher frequencies as the stimulus intensity was lowered, ranging from 6 to 9 kHz in the measured region. Lastly, the sharpness of frequency tuning, calculated as the best frequency divided by the bandwidth 10 dB down from the peak (the Q10dB), increased as the stimulus intensity was lowered.
Fig. 2.
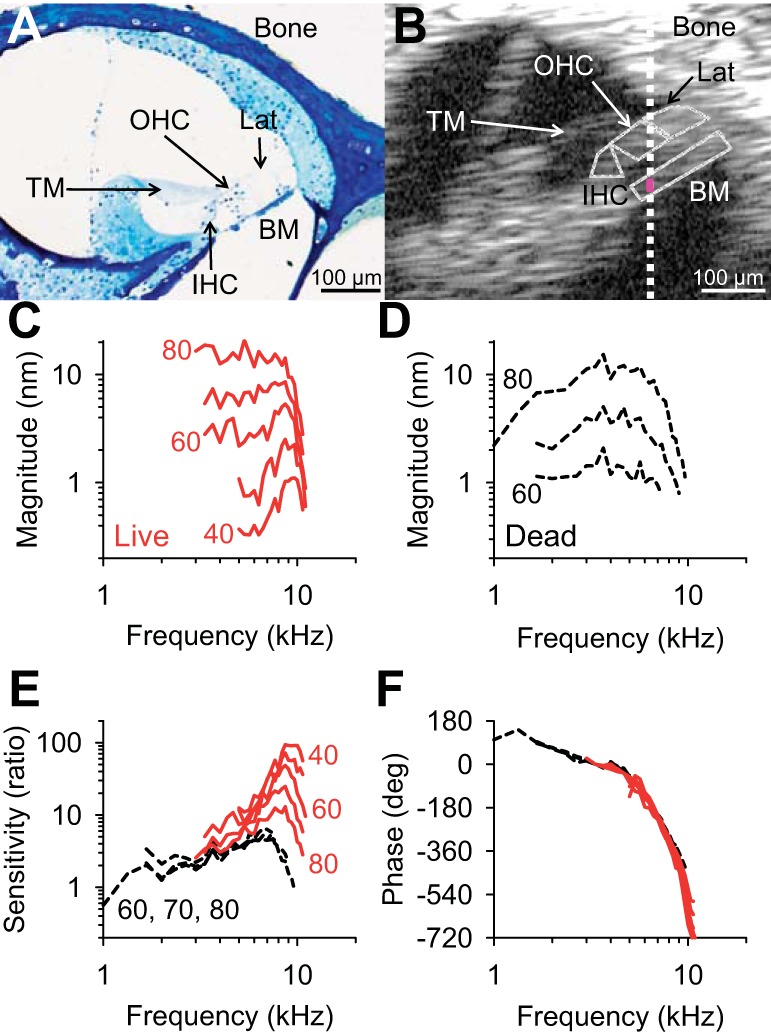
Basilar membrane tuning curves in a representative CBA mouse. A: plastic-embedded section of the mouse cochlea at the location we studied. B: in vivo OCT cross-sectional image from a representative mouse. The rough locations of the key structures within the organ of Corti are outlined (yellow). TM, tectorial membrane; BM, basilar membrane; OHC, outer hair cell region; IHC, inner hair cell region; Lat, lateral compartment of the organ of Corti (which contains Hensen’s, Boettcher's, and Claudius' cells). The white dotted line denotes the beam position for BM vibration measurements. The BM response was the average vibration along a 20-μm region (pink segment). C: raw BM vibration magnitudes from the live mouse. The numbers denote the stimulus intensities in dB sound pressure level (SPL). D: raw BM vibration magnitudes from the same mouse postmortem. E: BM sensitivity ratios in the same mouse, where BM vibration magnitude was normalized to that of the ossicular chain in the living (red) and dead (black) conditions. F: BM phase responses from the same mouse in the living (red) and dead (black) conditions. The phase was referenced to the ossicular chain.
Basilar membrane vibrometry recordings from multiple mice demonstrated consistent results. Representative magnitude and phase data recorded from five different mice are shown for comparison (Fig. 3). The degree of gain and sharpness of frequency tuning in both live and dead mice are consistent with previous findings in other animals (Cooper and Rhode 1995; Ren and Nuttall 2001; Ruggero et al. 1997) (Table 1). The consistency in the data collected from different mice and with previously published data in different animal models demonstrates the soundness of our technical approach.
Fig. 3.
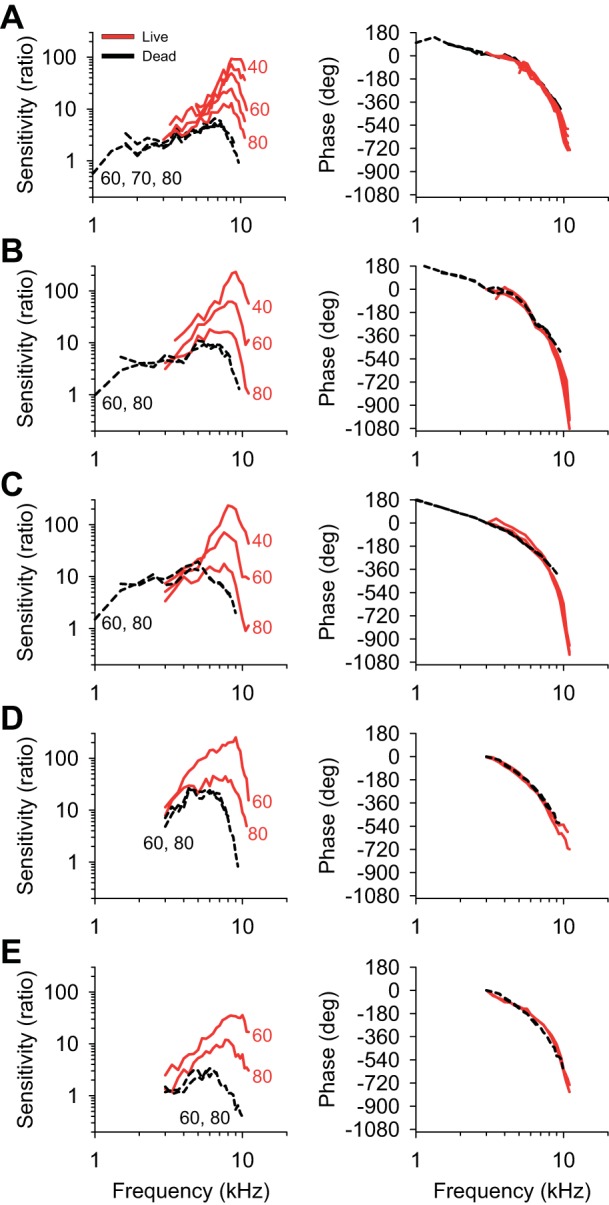
Comparison of BM sensitivity and phase measurements from five different mice. All data were normalized to the middle ear response. A: the data from the mouse presented in Fig. 2. B–E: data from four additional mice.
Table 1.
Quantitative analyses of basilar membrane vibratory responses
| Mouse Apex | n | Chinchilla Base | Gerbil Base | Guinea Pig Apex | |
|---|---|---|---|---|---|
| Live | |||||
| Best frequency, 40-dB SPL, kHz | 8.75 ± 0.28 | 4 | 9.5 | 13 | 0.6 |
| Best frequency, 60-dB SPL, kHz | 8.31 ± 0.23 | 8 | 8 | 13 | |
| Best frequency, 80-dB SPL, kHz | 6.85 ± 0.41 | 8 | 6.5 | 12.5 | |
| Q10dB for 40-dB SPL | 2.17 ± 0.16 | 4 | 3.9 | 3.6 | <2 |
| Q10dB for 60-dB SPL | 1.65 ± 0.14 | 8 | 2 | 2.9 | |
| Q10dB for 80-dB SPL | 1.11 ± 0.08 | 8 | 1.3 | 1.3 | |
| Dead | |||||
| Best frequency, 60-dB SPL, kHz | 5.29 ± 0.31 | 8 | 9 | ||
| Best frequency, 80-dB SPL, kHz | 5.37 ± 0.36 | 8 | 9 | ||
| Q10dB for 60-dB SPL | 0.95 ± 0.06 | 8 | 0.9 | ||
| Q10dB for 80-dB SPL | 0.95 ± 0.06 | 8 | 0.9 | ||
| Cochlear gain (live vs. dead) | |||||
| Gain 40-dB SPL, dB | 23.80 ± 1.02 | 4 | 20.6 | 21.9 | |
| Gain 60-dB SPL, dB | 15.57 ± 1.22 | 8 | 11.6 | 12.4 | |
| Gain 80-dB SPL, dB | 4.31 ± 1.73 | 8 | 1 | 1.6 |
Values are means ± SE; n, no. of mice. Where possible, previously published data from the chinchilla base (Ruggero et al. 1997), gerbil base (Ren and Nuttall 2001), and guinea pig apex (Cooper and Rhode 1995) are shown. SPL, sound pressure level; Q10dB, best frequency divided by the bandwidth 10 dB from the peak response.
Organ of Corti vibratory measurements.
We then collected vibratory data across the organ of Corti in living and dead mice at two different frequencies: one below the best frequency and one near the best frequency (Fig. 4). We used sound stimuli with an intensity of 80-dB SPL. The displacement data were thresholded; only voxels with vibratory magnitudes >1 nm were plotted. The magnitude data were then pseudocolored to cover the range of the measured vibratory magnitudes within the image in a linear (not log) scale. To assess for phase differences within the organ of Corti that differed from that of the basilar membrane, we set the phase of the midpoint of the basilar membrane to 0° and referenced every other pixel in each image to it. The rest of the phase data within the image were then pseudocolored to the range of −180° to +180°. Finally, rough estimates of the locations of various substructures of the organ of Corti were drawn in by hand to aid understanding of the images. These substructures included the basilar membrane region, the inner hair cell region, OHC region, and the lateral compartment region. The boundaries were created by eye, based on the anatomic images, the vibratory magnitude images, and the vibratory phase images.
Fig. 4.

Representative displacement measurements across the organ of Corti in the CBA mouse. Left: anatomic image. Center: magnitude response. Right: phase response. A and B: magnitude and phase responses to 5- and 8-kHz stimuli superimposed on the anatomic OCT image using pseudo-color in a live mouse. The beam path for simultaneous phase measurements (dotted line) and the specific positions analyzed for the data in Fig. 5 (Lat and BM) are shown. Scale bar, 50 μm. C and D: magnitude and phase responses to 5- and 8-kHz stimuli superimposed on the anatomic OCT image using pseudo-color in a postmortem mouse. The estimated locations of various organ of Corti substructures, including the BM region, the IHC region, OHC region, and the Lat region, were drawn for the anatomic image in A and for all magnitude and phase images to aid data interpretation.
The structure with the largest displacement magnitude in both living and dead mice, at both 5 and 8 kHz, using the 80-dB SPL intensity stimulus was the basilar membrane. This was largest in the middle of the basilar membrane and decreased radially to either side. In both living and dead mice, the region lateral to the OHCs obviously vibrated out of phase with the rest of the organ of Corti at 8 kHz (pink region in the right panels of Fig. 4, B and D). This region consists of Hensen's, Boettcher's, and Claudius' cells; for simplicity, we have termed this region the “lateral compartment.” The finding of a frequency-dependent phase difference between the lateral compartment and the basilar membrane suggested that this region may provide a way to assess filtering within the organ of Corti relevant to frequency tuning.
Lateral compartment vibratory measurements.
We then further characterized this phenomenon by directly measuring the displacement of the lateral compartment and the basilar membrane simultaneously (arrows along the dotted line in Fig. 4A), while varying the frequency of the sound stimulus. Basilar membrane and lateral compartment displacement magnitudes both demonstrated gain in the living mouse (Fig. 5, A and B). No gain was present in either the basilar membrane or the lateral compartment postmortem. The displacement magnitude of the basilar membrane was sharper than that of the lateral compartment.
Fig. 5.
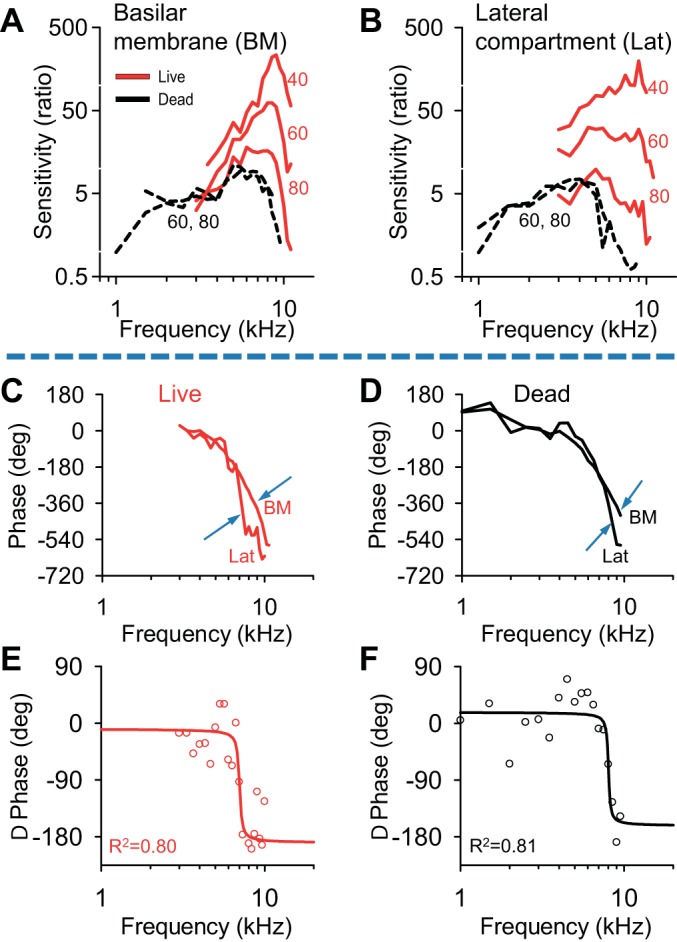
Comparison of BM and Lat vibratory responses. A: the magnitude of BM displacement in one representative mouse (the same mouse from Fig. 3B) after normalization to the middle ear response. B: the normalized magnitude of the Lat displacement measured simultaneously. C: the phase of the Lat and the BM measured simultaneously from the living mouse, using a stimulus intensity of 80 dB. The phase values were referenced to the phase of the ossicular chain. Around 7–8 kHz, a difference in the phase of the two locations was noted (blue arrows). D: the phase of the Lat and the BM in the same mouse postmortem. The same phase difference noted in the live mouse exists in the dead mouse (blue arrows). E and F: the difference between the phase of the Lat and the phase of the BM for both the live (E) and dead (F) conditions (red and black circles, respectively). These data were fit with a second-order band-pass filter model (lines).
When referenced to the ossicular chain, the phase of the lateral compartment tracked that of the basilar membrane at lower frequencies (Fig. 5C), but demonstrated greater phase lags at higher frequencies (arrows). This phase difference reached ∼180° before the magnitude of vibration dropped off so much that it was below the detection limit of our system. A similar finding was seen in dead mice (Fig. 5D). To better visualize this phase difference, we subtracted the phase of the basilar membrane from that of the lateral compartment (Fig. 5, E and F). The phase difference occurred near the best frequency.
It is possible that the frequency dependence of the lateral compartment phase difference correlates with the range of positive feedback from OHC force production and hence may be linked to the bandwidth of basilar membrane tuning. Thus a steeper phase difference vs. frequency curve (e.g., Fig. 5, E and F) would be associated with sharper tuning. Defining this relationship between the phase difference and OHC force production is not trivial, because the complex biomechanics of the cochlea define its vibratory characteristics. Nevertheless, several cochlear models incorporate one or more second-order band-pass filters to represent some or all of this additional filtering process (for reviews, see Allen and Neely 1992; Olson et al. 2012). Therefore, we used this concept to analyze the frequency-dependent phase difference between the lateral compartment and the basilar membrane that we measured. We recorded from six live and five dead CBA mice, and fit each dataset to the phase equation of a second-order band-pass filter (see materials and methods for details). The fits had reasonably good R2 values (representative examples are shown by the lines in Fig. 5, E and F; average values were 0.82 ± 0.05 and 0.80 ± 0.05, means ± SE, respectively), indicating that roughly 80% of the location-dependent differences in both the in vivo and postmortem phase measurements could be explained by this model. We attribute the remaining 20% of the variability to measurement noise and less than precise modeling of the complex biomechanics of the cochlea with this approach. Nevertheless, the quality of the fits supports our rationale for using this approach to interpret the data.
We then assessed the relationship between tuning of the basilar membrane magnitude responses and the fit of the phase difference between the lateral compartment and the basilar membrane. This was done by comparing the Q10dB and best frequency measured using classical basilar membrane tuning curves to the Q10dB and the Fc provided by the phase fit calculations. The Q10dB values based on lateral compartment phase fits in live and dead mice were similar and were greater than those measured from basilar membrane vibration magnitude data using suprathreshold stimulus intensities (Fig. 6A). Importantly, however, these values were not significantly different than the Q10dB of auditory nerve fibers measured at threshold (Taberner and Liberman 2005). The Fc of the phase fits was between the best frequencies of basilar membrane tuning in dead and live mice (Fig. 6B).
Fig. 6.
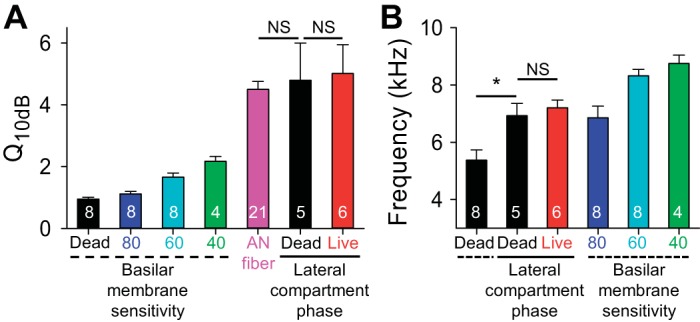
Comparison of averaged BM sensitivity and Lat phase differences in CBA mice. A: BM tuning curve sharpness [best frequency divided by the bandwidth 10 dB from the peak response (Q10dB)] was lowest in dead mice. In living mice, it increased as the stimulus intensity decreased, from 80- to 60- to 40-dB SPL. Published auditory nerve (AN) data (Taberner and Liberman 2005) collected at threshold had higher Q10dB values and fit the exponential trend line. The Q10dB values calculated from fits of the phase difference between the Lat and the BM in both living and dead mice were similar to the AN data. B: the center frequencies (Fc) of the Lat phase fits were between the best frequencies of dead mice and living mice measured by BM vibratory magnitudes. Values are means ± SE. Numbers of mice (or nerve fibers) are labeled in the bar graph. *P < 0.05. NS, not significant. Student's t-tests were performed after a one-way ANOVA.
It is important to note that these data do not demonstrate whether the cells of the lateral compartment provide additional filtering that is important for cochlear amplification, whether the measured phase difference is an epiphenomenon of additional filtering provided by another region of the organ of Corti, or whether the measured phase difference reflects an additional filtering process that is unrelated to cochlear amplification. However, a correspondence between the phase difference and basilar membrane tuning does exist. Thus these findings are consistent with the concept that filtering within the organ of Corti, in addition to that provided by the basilar membrane and surrounding fluid, contributes to tuning curve sharpness in the mouse cochlear apex. It is also reasonable to conclude that, since the lateral compartment phase difference is similar in live and dead mice, active processes requiring electrical and/or chemical gradients are not required to produce this effect.
Studies of transgenic mice.
To assess what structures contribute to produce the additional filtering detectable by measuring the phase difference between the lateral compartment and the basilar membrane, we studied several different strains of transgenic mice. Each strain had a different alteration in organ of Corti mechanics. We compared the relationship between gain and tuning using both classical basilar membrane tuning curve measurements (Figs. 7 and 8) and the new lateral compartment phase measurement technique (Figs. 9 and 10). We fit the phase difference between the lateral compartment and the basilar membrane using the strategy described earlier for each transgenic strain. The fitting parameters and the R2 values for the fits are provided (Table 2).
Fig. 7.

BM tuning curves from representative transgenic mice. Illustrations are of organ of Corti behavior (left), BM sensitivity curves from representative mice (middle), and BM phase curves after referencing to the ossicular chain (right). These studies were performed in wild-type CBA (same mouse presented in Fig. 5; A), Prestin499/499 (B), Prestin−/− (C), TectaC1509G/C1509G (D), and SfswapTg/Tg mice (E). For the illustrations, BM motion in the vertical direction (black arrows) leads to horizontal deflection of stereocilia (red arrows), resulting in OHC force production back in the vertical direction (cyan arrows). No OHC force production occurs in Prestin499/499, Prestin−/−, or TectaC1509G/C1509G mice (cyan lines without arrows). Reduced OHC length and stiffness are found in Prestin−/− mice (dashed cyan lines).
Fig. 8.
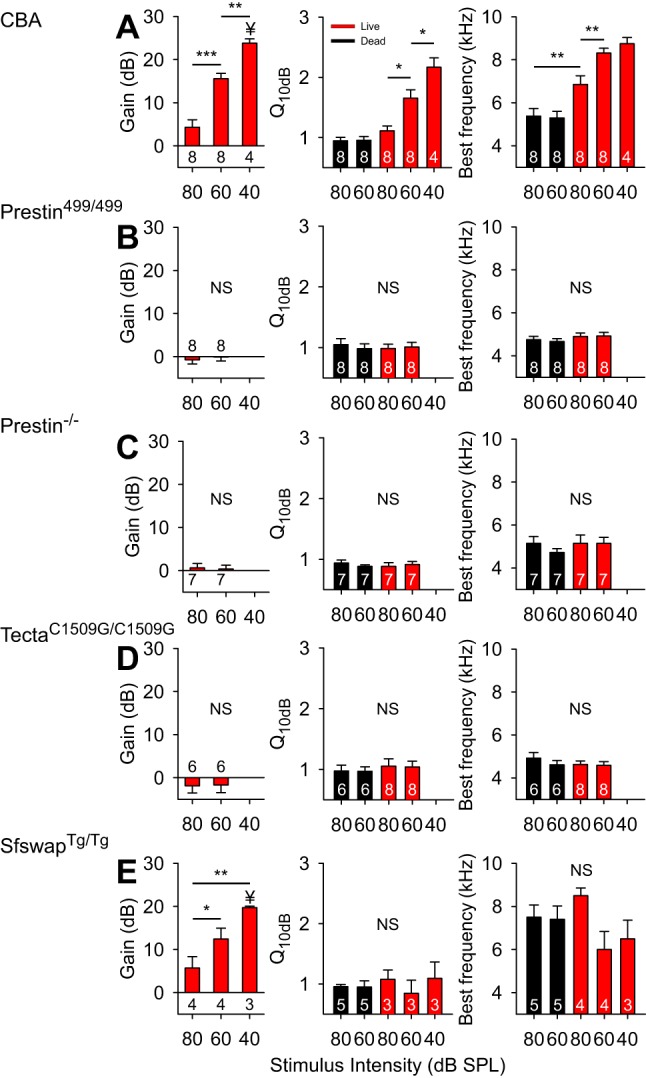
Average BM vibratory gain, tuning curve sharpness (Q10dB), and best frequency from transgenic mice. These studies were performed in wild-type CBA (A), Prestin499/499 (B), Prestin−/− (C), TectaC1509G/C1509G (D), and SfswapTg/Tg mice (E). Values are means ± SE. Number of mice is indicated in the bar graphs. *P < 0.05; **P < 0.01; ***P < 0.001; Student's t-test after one-way ANOVA. ¥P < 0.05; nonpaired Student's t-test between CBA and SfswapTg/Tg cohorts.
Fig. 9.

Organ of Corti measurements from representative transgenic mice. These studies were performed in wild-type CBA (A), Prestin499/499 (B), Prestin−/− (C), TectaC1509G/C1509G (D), and SfswapTg/Tg mice (E). Scale bar, 50 μm. Pseudo-colored organ of Corti vibratory phases (first column) were collected near the best frequency of that cochlear location using an 80-dB stimulus. The displacement magnitudes of the Lat region to different stimulus intensities are provided (second column). The raw phase data from the Lat and the BM are also shown (third column). The phase differences between the Lat and the BM (circles, fourth column) and phase fits to the data (lines, fourth column) are given. All phase data are from live mice with 80-dB SPL stimuli.
Fig. 10.
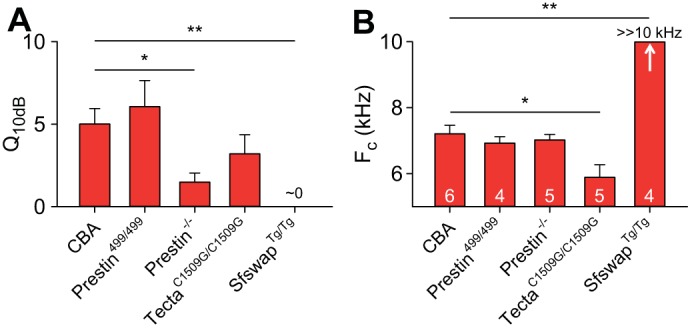
Comparison of fitting parameters of the frequency-dependent phase difference between the Lat and the BM in transgenic mice. The average sharpness (Q10dB; A) and Fc (B) from the fits are shown. Values are means ± SE. Numbers of mice are labeled in the Fc graph. *P < 0.05; **P < 0.01; Student's t-tests were performed after a one-way ANOVA.
Table 2.
Quantitative analyses of the frequency-dependent phase difference between the lateral compartment and the basilar membrane
| CBA Dead | CBA Live | Prestin499/499 Live | Prestin−/− Live | TectaC1509G/C1509G Live | SfswapTg/Tg Live | |
|---|---|---|---|---|---|---|
| Q10dB | 4.79 ± 1.21 | 5.01 ± 0.93 | 6.06 ± 1.59 | 1.48 ± 0.55 | 3.21 ± 1.16 | ∼0 |
| Fc, kHz | 6.92 ± 0.43 | 7.21 ± 0.26 | 6.93 ± 0.20 | 7.02 ± 0.17 | 5.89 ± 0.39 | >>10 |
| R2 | 0.82 ± 0.05 | 0.80 ± 0.04 | 0.94 ± 0.01 | 0.76 ± 0.08 | 0.87 ± 0.04 | 0.03 ± 0.02 |
| n | 5 | 6 | 4 | 5 | 5 | 4 |
Values are means ± SE; n, no. of mice included in each cohort. Average Q10dB, Fc, and R2 values from the fits of the phase difference are given.
In wild-type CBA mice (Fig. 7A), as has been previously shown, basilar membrane vibration demonstrated the traditional features of cochlear amplification. The key findings were that lowering the stimulus intensity led to increased gain, increased Q10dB, and a higher best frequency (Fig. 8A). Lateral compartment vibration, as already shown, demonstrated increasing displacement sensitivity as the stimulus intensity was lowered (Fig. 9A). The fit to the frequency-dependent phase difference between the lateral compartment and the basilar membrane demonstrated a Q10dB value of 5.01 ± 0.93 and an Fc of 7.21 ± 0.26 kHz (n = 6) (Fig. 10). As a reference, the Q10dB and Fc values of the phase difference between the lateral compartment and the basilar membrane in dead CBA mice were not significantly different from the values in live mice (Table 2). The normal responses in live CBA mice were then compared with those of the transgenic mice.
Prestin is a protein unique to OHCs that is necessary for normal hearing (Liberman et al. 2002). It undergoes conformational changes in response to variations in the transmembrane voltage resulting in OHC length changes (termed electromotility) (Zheng et al. 2000). Prestin499/499 mice contain inactivated prestin, do not have OHC electromotility, and therefore have hearing loss (Dallos et al. 2008). Similar to previously published data (Weddell et al. 2011), basilar membrane tuning curves measured in live mice demonstrated no gain, no increase in Q10dB, and no stimulus level-dependent shift in best frequency, and thus were no different than those of dead mice (Figs. 7B and 8B). The displacement of the lateral compartment had no gain; however, the frequency-dependent phase difference between the lateral compartment and the basilar membrane persisted (Fig. 9B). The Q10dB and Fc values from the fits to these phase difference data were no different than the values measured in live CBA mice (Fig. 10). This means that, even though OHC electromotility is needed for gain, it is not needed to produce this phase difference within the organ of Corti. This finding is consistent with the fact that the phase difference remained present in postmortem CBA mice.
Prestin−/− mice do not have somatic electromotility, like Prestin499/499 mice, but in addition their OHCs are shorter (Liberman et al. 2002) and have a substantially reduced passive stiffness to about 20% of normal (Dallos et al. 2008). As with Prestin499/499 mice, basilar membrane tuning curves in live Prestin−/− mice demonstrated no gain, no increase in Q10dB, and no stimulus level-dependent shift in best frequency, and were indistinguishable from those of dead mice (Figs. 7C and 8C). Similarly, the displacement of the lateral compartment of the organ of Corti demonstrated no gain over postmortem mice, yet it still showed a frequency-dependent phase difference with the basilar membrane (Fig. 9C). However, the Q10dB values from the fits to these data were lower than those from live CBA mice, even though the Fc values were no different (Fig. 10). These data suggest that reducing OHC size and stiffness, i.e., altering passive cellular mechanics, reduces (but does not eliminate) the filtering process that affects the lateral compartment differently than the basilar membrane.
TectaC1509G/C1509G mice have a malformed and disorganized tectorial membrane that does not attach to the OHC stereocilia; thus the OHC force generating mechanisms are not activated (Xia et al. 2010). Basilar membrane tuning curves measured in live mice demonstrated no gain, no increase in Q10dB, and no stimulus level-dependent shift in best frequency, and thus were no different than those of dead mice (Figs. 7D and 8D). The displacement of the lateral compartment did not demonstrate any gain, yet the frequency-dependent phase difference between the lateral compartment and the basilar membrane remained (Fig. 9D). While the Q10dB values from the fits to these data were not statistically different from those from live CBA mice, the Fc values were lower (Fig. 10). These data suggest that the passive mechanics of the tectorial membrane contribute to setting the Fc associated with the additional filtering within the organ of Corti, but have little to no effect on the bandwidth of the filter. In addition, these data argue that hair bundle mechanics are not critical to this filtering process, since OHC stereocilia are not stimulated in this mouse model.
Finally, SfswapTg/Tg mice have patterning defects within the organ of Corti that produce mild hearing loss (Moayedi et al. 2014). At the apical position from which we recorded, they were missing the third row of OHCs and their underlying third row of Deiters' cells (Fig. 11). Basilar membrane tuning curves demonstrated increased gain as the stimulus intensity was lowered, although the amount of gain at a stimulus level of 40-dB SPL was 4.1 dB lower than in CBA mice (Figs. 7E and 8E). Importantly, there were no systematic changes in sharpness or best frequency with the stimulus intensity. Additionally, the progressive phase lag associated with the traveling wave as defined by the basilar membrane was reduced at higher frequencies compared with wild-type mice (Fig. 7E, right). The displacement of the lateral compartment demonstrated increasing gain as the stimulus intensity was decreased, similar to the basilar membrane response (Fig. 9E, center). However, the phase difference between the lateral compartment and the basilar membrane demonstrated no frequency dependence in SfswapTg/Tg mice (Fig. 9E). Fitting these phase data produced Q10dB and Fc values that were significantly different than those of live CBA controls (Fig. 10). The lack of frequency-dependent phase differences between the lateral compartment and the basilar membrane indicates that there was no detectable additional filtering within the organ of Corti of this mouse strain. Together with the loss of this additional filtering, there was a reduction in the sharpness of frequency tuning of the basilar membrane with only a minimal loss of gain. Thus patterning defects, which alter the passive mechanics of the organ of Corti by altering its structure, change organ of Corti vibratory patterns and reduce the sharpness of basilar membrane frequency with only a minimally loss of gain.
Fig. 11.

The organ of Corti in the apical turn of CBA and SfswapTg/Tg mice. A and B: top-down three-dimensional reconstruction of immunofluorescence images of the cochlear epithelium labeled with actin (green) and prestin (blue). C and D: cross-sectional images at the level of OHCs. Prestin is only in the cell membrane of OHCs. The IHCs and OHCs are labeled. The rows of OHCs are indicated by numbers. The arrows point to actin within the phalangeal process of Deiters' cells. Scale bars, 10 μm.
DISCUSSION
The cochlea provides gain and tuning to achieve the wide dynamic range and exquisite frequency selectivity that distinguish mammalian hearing from that of other animals (Glasberg and Moore 1990; Moore 2004). Both characteristics of basilar membrane tuning manifest in the response pattern of the auditory nerve (Kiang et al. 1986; Narayan et al. 1998) and ultimately impact auditory perception. While most previous data have come from point measurements of basilar membrane vibration or excised cochlear preparations, we used OCT to measure vibration throughout the mouse apical organ of Corti. Our data were collected in vivo, in an unopened cochlea, and in response to sound (rather than electrical) stimuli. This approach allowed us to identify a region within the organ of Corti, the lateral compartment, which demonstrates a frequency-dependent phase difference with the basilar membrane. The frequency dependence of this phase difference correlated with the frequency tuning of basilar membrane displacement. Therefore, these findings support the concept that additional filtering within the organ of Corti beyond that of the basilar membrane tunes the cochlear amplifier. Furthermore, our data suggest that the passive mechanics of the supporting cells are primarily responsible for tuning this additional filtering process. The passive stiffness of the OHCs plays a role as well, although to a lesser degree.
Several key pieces of previously published data support these concepts. For example, using a similar OCT technique in the opened guinea pig cochlear base in vivo, phase differences between the reticular lamina and the basilar membrane were demonstrated (Chen et al. 2011; Zha et al. 2012). While the source of these phase differences was not identified, the phase difference increased with lower intensity stimuli and disappeared postmortem. These relationships indicate that the phase difference was related to cochlear amplification. Our finding of a phase difference between the lateral compartment and the basilar membrane that was the same in the live and dead conditions does not contradict this finding. While the position where we made the lateral compartment measurements was directly adjacent to the position where the previously published reticular lamina measurements were made, the organ of Corti cross-sectional phase measurements (Fig. 4, right) demonstrate that these two locations vibrate quite differently in the CBA mouse. In addition, it is important to note that the frequency-dependent phase difference between the lateral compartment and the basilar membrane that we found is not an artifact of our measurement technique, as it was not present in SfswapTg/Tg mice.
In the gerbil base, simultaneous in vivo measurements of the intracochlear voltage and pressure revealed frequency-dependent phase differences (Dong and Olson 2013). Since the electric field represents primarily the OHC receptor potential, this finding suggests that the phase of OHC stimulation is tuned to localize and sharpen the frequency tuning of cochlear amplification. Our results are highly consistent with this finding. In particular, the bandwidth and Fc of the fits to the phase difference we identified between the lateral compartment and the basilar membrane are strikingly similar to those published data (compare Fig. 5, E and F, in this manuscript to Fig. 5E in Dong and Olson 2013).
Furthermore, many publications support the concept of complex vibratory motion within the organ of Corti (for a review, see Guinan 2012), although the most clear demonstrations of this finding come from ex vivo experiments. In the gerbil hemi-cochlea preparation, optical images of cross-sectional cuts through the cochlea revealed substantial differences in the vibratory patterns of inner hair cells, OHCs, pillar cells, and the tectorial membrane (Cai et al. 2003; Hu et al. 1999). Similar findings were noted in the apex of the guinea pig cochlea using a stroboscopic confocal imaging approach (Fridberger et al. 2004). In addition, electrically evoked movements within the excised gerbil cochlea when visualized using stroboscopic video microscopy demonstrated a complex pivoting motion of the organ of Corti relative to the reticular lamina (Karavitaki and Mountain 2007b). This would create the potential for significant phase variation throughout the organ of Corti when studied with our vibratory technique, which only allows the measurement of motion in one direction (vertically along the path of the light). Lastly, tectorial membrane and reticular lamina vibration demonstrate significant phase differences in their transverse and radial components, as well as from the basilar membrane, when measured in excised guinea pig cochlear preparations (Gummer et al. 1996; Nowotny and Gummer 2006).
Whether the phase difference between the lateral compartment and the basilar membrane that we identified in CBA mice is responsible for tuning the process of cochlear amplification or is simply an unrelated epiphenomenon of the three-dimensional mechanical vibrations within organ of Corti is unclear. However, this phase difference correlated with well-established measures of auditory frequency tuning, such as basilar membrane vibration and auditory nerve tuning curves. In an effort to better understand the relevance of the phase difference between the lateral compartment and the basilar membrane to cochlear physiology, we, therefore, used transgenic mice with targeted changes in organ of Corti biomechanics. We found that this phase difference persisted without the presence of force production by OHCs (prestin mutants) or a functional tectorial membrane (tecta mutant). Conversely, when the passive mechanics were substantially altered through the induction of patterning defects (Sfswap mutant), the phase difference was lost while force production by OHCs remained. Thus the data argue against properties intrinsic to the OHCs being solely responsible for defining the frequency range over which OHCs inject energy and amplify the traveling wave. This is consistent with ex vivo studies demonstrating that the ability of OHCs to produce force is broad-band, without evidence of tuning (Frank et al. 1999).
Therefore, these data support a concept whereby the force production of OHCs is tuned to be most effective over a specific frequency range defined by the filtering of the passive micromechanics of the surrounding organ of Corti cellular structures. However, in addition to the specialized force-generating OHC, the mammalian cochlea also evolved a highly structured framework of cells that sits on top of the basilar membrane (Manley 2012). These cells (including Deiters', pillar, Hensen's, Boettcher's, and Claudius' cells) not only support and orient the hair cells, but also form a cross-linked, trusslike network in both the radial and longitudinal directions (Geisler 1998; Spicer and Schulte 1994). In live mice, these biomechanical filtering properties are amplified by OHCs, producing sharply tuned basilar membrane deflections. However, in dead mice, the lack of force production by the OHCs means that this additional filtering is not translated into sharp tuning of the basilar membrane.
There are caveats to consider when interpreting these data. While our system could detect frequency-dependent phase differences within the organ of Corti, and our use of a second-order band-pass filter provided reasonably good fits of the data, this concept of auditory frequency tuning is undoubtedly simplified. The three-dimensional fluid-filled coupling along the cochlea, together with the intricate network of cellular and acellular structures that compose the organ of Corti, make mathematical modeling of its tuning and phase characteristics a challenging undertaking (Gavara et al. 2011). In addition, we have only studied the apical turn of the cochlea, and this region may function in a physiologically different manner than the basal turn of larger animals (Cooper and Rhode 1995, 1997), where most previous work has been performed. Even in mice, there appear to be key differences between the base and apex. For example, the tectorial membrane has been shown to be involved in sharpening tuning within the base of the mouse cochlea (Ghaffari et al. 2010; Russell et al. 2007), while our data suggest that it has a minimal role in the apex. Lastly, the results found here may not be representative of the results that would be found in the apex of larger animals, such as the guinea pig and chinchilla, which are tuned to much lower frequencies (<1 kHz) (Cooper and Rhode 1997; 1995; Khanna and Hao 1999; Zinn et al. 2000).
Why might sharp frequency tuning have evolved to be controlled by a different mechanism than gain? Separating these features eliminates some of the downsides that would occur if a single active process provided both gain and tuning. The benefits of cochlear gain are that it improves the ability to hear quieter sounds and it extends the bandwidth of hearing to higher frequencies. However, without sharp frequency filtering before the amplification step, background noise would be increased together with the desired signal. Feedback would also be more of a problem. In fact, both of these problems are the major concerns of patients who try hearing aids, which primarily provide gain (McCormack and Fortnum 2013). Even so, preamplification filtering is commonly used in hearing aid technology to reduce feedback and improve hearing in noisy background environments (Kates 2005). Our data suggest that a normal-functioning cochlea has the ability to sharply filter a sound signal before the OHCs amplify it, thereby providing excellent frequency selectivity, even in noisy background environments. Further studies will be needed to prove or disprove this concept. If true, OHC stereociliary displacement in the postmortem mouse cochlea should demonstrate sharp frequency tuning, albeit with very low magnitudes. Unfortunately, the optical capabilities of our spectral-domain OCT system do not currently permit detection of structures at this resolution to test this hypothesis.
GRANTS
This project was funded by Department of Defense Grant W81XWH-11-2-0004 and National Institute on Deafness and Other Communications Disorders Grant P30-DC-010363.
DISCLOSURES
No conflicts of interest, financial or otherwise, are declared by the author(s).
AUTHOR CONTRIBUTIONS
Author contributions: S.S.G., Y.M., A.K.G., J.Z., B.E.A., and J.S.O. conception and design of research; S.S.G., R.W., P.D.R., and J.S.O. performed experiments; S.S.G., B.E.A., and J.S.O. analyzed data; S.S.G., B.E.A., and J.S.O. interpreted results of experiments; S.S.G. and J.S.O. prepared figures; S.S.G. and J.S.O. drafted manuscript; S.S.G. and J.S.O. edited and revised manuscript; S.S.G., R.W., P.D.R., Y.M., A.K.G., J.Z., B.E.A., and J.S.O. approved final version of manuscript.
ACKNOWLEDGMENTS
We thank Drs. Anthony Ricci, Kuni Iwasa, William Brownell, Robert Raphael, Charles Steele, Sunil Puria, Heeyoon Lee for very helpful advice. Artwork is by Scott Weldon and Chris Gralapp.
REFERENCES
- Allen JB, Fahey PF. A second cochlear-frequency map that correlates distortion product and neural tuning measurements. J Acoust Soc Am 94: 809–816, 1993 [DOI] [PubMed] [Google Scholar]
- Allen JB, Neely ST. Micromechanical models of the cochlea. Phys Today 45: 40–47, 1992 [Google Scholar]
- Applegate BE, Shelton RL, Gao SS, Oghalai JS. Imaging high-frequency periodic motion in the mouse ear with coherently interleaved optical coherence tomography. Opt Lett 36: 4716–4718, 2011 [DOI] [PMC free article] [PubMed] [Google Scholar]
- Brownell WE, Bader CR, Bertrand D, de Ribaupierre Y. Evoked mechanical responses of isolated cochlear outer hair cells. Science 227: 194–196, 1985 [DOI] [PubMed] [Google Scholar]
- Cai H, Richter CP, Chadwick RS. Motion analysis in the hemicochlea. Biophys J 85: 1929–1937, 2003 [DOI] [PMC free article] [PubMed] [Google Scholar]
- Chen F, Zha D, Fridberger A, Zheng J, Choudhury N, Jacques SL, Wang RK, Shi X, Nuttall AL. A differentially amplified motion in the ear for near-threshold sound detection. Nat Neurosci 14: 770–774, 2011 [DOI] [PMC free article] [PubMed] [Google Scholar]
- Chen Z, Milner TE, Dave D, Nelson JS. Optical Doppler tomographic imaging of fluid flow velocity in highly scattering media. Opt Lett 22: 64–66, 1997 [DOI] [PubMed] [Google Scholar]
- Cho SI, Gao SS, Xia A, Wang R, Salles FT, Raphael PD, Abaya H, Wachtel J, Baek J, Jacobs D, Rasband MN, Oghalai JS. Mechanisms of hearing loss after blast injury to the ear. PLos One 8: e67618, 2013 [DOI] [PMC free article] [PubMed] [Google Scholar]
- Choi CH, Oghalai JS. Perilymph osmolality modulates cochlear function. Laryngoscope 118: 1621–1629, 2008 [DOI] [PMC free article] [PubMed] [Google Scholar]
- Choma MA, Ellerbee AK, Yang C, Creazzo TL, Izatt JA. Spectral-domain phase microscopy. Opt Lett 30: 1162–1164, 2005 [DOI] [PubMed] [Google Scholar]
- Cooper NP, Rhode WS. Mechanical responses to two-tone distortion products in the apical and basal turns of the mammalian cochlea. J Neurophysiol 78: 261–270, 1997 [DOI] [PubMed] [Google Scholar]
- Cooper NP, Rhode WS. Nonlinear mechanics at the apex of the guinea-pig cochlea. Hear Res 82: 225–243, 1995 [DOI] [PubMed] [Google Scholar]
- Dallos P, Wu X, Cheatham MA, Gao J, Zheng J, Anderson CT, Jia S, Wang X, Cheng WH, Sengupta S, He DZ, Zuo J. Prestin-based outer hair cell motility is necessary for mammalian cochlear amplification. Neuron 58: 333–339, 2008 [DOI] [PMC free article] [PubMed] [Google Scholar]
- Dong W, Olson ES. Detection of cochlear amplification and its activation. Biophys J 105: 1067–1078, 2013 [DOI] [PMC free article] [PubMed] [Google Scholar]
- Evans EF, Klinke R. The effects of intracochlear and systemic furosemide on the properties of single cochlear nerve fibres in the cat. J Physiol 331: 409–427, 1982 [DOI] [PMC free article] [PubMed] [Google Scholar]
- Frank G, Hemmert W, Gummer AW. Limiting dynamics of high-frequency electromechanical transduction of outer hair cells. Proc Natl Acad Sci U S A 96: 4420–4425, 1999 [DOI] [PMC free article] [PubMed] [Google Scholar]
- Fridberger A, Widengren J, Boutet de Monvel J. Measuring hearing organ vibration patterns with confocal microscopy and optical flow. Biophys J 86: 535–543, 2004 [DOI] [PMC free article] [PubMed] [Google Scholar]
- Gao SS, Raphael PD, Wang R, Park J, Xia A, Applegate BE, Oghalai JS. In vivo vibrometry inside the apex of the mouse cochlea using spectral domain optical coherence tomography. Biomed Opt Express 4: 230–240, 2013 [DOI] [PMC free article] [PubMed] [Google Scholar]
- Gavara N, Manoussaki D, Chadwick RS. Auditory mechanics of the tectorial membrane and the cochlear spiral. Curr Opin Otolaryngol Head Neck Surg 19: 382–387, 2011 [DOI] [PMC free article] [PubMed] [Google Scholar]
- Geisler CD. From Sound to Synapse: Physiology of the Mammalian Ear. New York: Oxford University Press, 1998, p. xiv, 381 [Google Scholar]
- Geisler CD, Sang C. A cochlear model using feed-forward outer-hair-cell forces. Hear Res 86: 132–146, 1995 [DOI] [PubMed] [Google Scholar]
- Ghaffari R, Aranyosi AJ, Richardson GP, Freeman DM. Tectorial membrane travelling waves underlie abnormal hearing in Tectb mutant mice. Nat Commun 1: 96, 2010 [DOI] [PMC free article] [PubMed] [Google Scholar]
- Glasberg BR, Moore BC. Derivation of auditory filter shapes from notched-noise data. Hear Res 47: 103–138, 1990 [DOI] [PubMed] [Google Scholar]
- Guinan JJ., Jr How are inner hair cells stimulated? Evidence for multiple mechanical drives. Hear Res 292: 35–50, 2012 [DOI] [PMC free article] [PubMed] [Google Scholar]
- Gummer AW, Hemmert W, Zenner HP. Resonant tectorial membrane motion in the inner ear: its crucial role in frequency tuning. Proc Natl Acad Sci U S A 93: 8727–8732, 1996 [DOI] [PMC free article] [PubMed] [Google Scholar]
- Hu X, Evans BN, Dallos P. Direct visualization of organ of corti kinematics in a hemicochlea. J Neurophysiol 82: 2798–2807, 1999 [DOI] [PubMed] [Google Scholar]
- Hubbard A. A traveling-wave amplifier model of the cochlea. Science 259: 68–71, 1993 [DOI] [PubMed] [Google Scholar]
- Karavitaki KD, Mountain DC. Evidence for outer hair cell driven oscillatory fluid flow in the tunnel of corti. Biophys J 92: 3284–3293, 2007a [DOI] [PMC free article] [PubMed] [Google Scholar]
- Karavitaki KD, Mountain DC. Imaging electrically evoked micromechanical motion within the organ of corti of the excised gerbil cochlea. Biophys J 92: 3294–3316, 2007b [DOI] [PMC free article] [PubMed] [Google Scholar]
- Kates JM. Principles of digital dynamic-range compression. Trends Amplif 9: 45–76, 2005 [DOI] [PMC free article] [PubMed] [Google Scholar]
- Khanna SM, Hao LF. Reticular lamina vibrations in the apical turn of a living guinea pig cochlea. Hear Res 132: 15–33, 1999 [DOI] [PubMed] [Google Scholar]
- Kiang NY, Liberman MC, Sewell WF, Guinan JJ. Single unit clues to cochlear mechanisms. Hear Res 22: 171–182, 1986 [DOI] [PubMed] [Google Scholar]
- Legan P, Lukashkina V, Goodyear R, Kossi M, Russell I, Richardson G. A targeted deletion in alpha-tectorin reveals that the tectorial membrane is required for the gain and timing of cochlear feedback. Neuron 28: 273–285, 2000 [DOI] [PubMed] [Google Scholar]
- Liberman M, Gao J, He D, Wu X, Jia S, Zuo J. Prestin is required for electromotility of the outer hair cell and for the cochlear amplifier. Nature 419: 300–304, 2002 [DOI] [PubMed] [Google Scholar]
- Liu CC, Gao SS, Yuan T, Steele C, Puria S, Oghalai JS. Biophysical mechanisms underlying outer hair cell loss associated with a shortened tectorial membrane. J Assoc Res Otolaryngol 12: 577–594, 2011 [DOI] [PMC free article] [PubMed] [Google Scholar]
- Manley GA. Evolutionary paths to mammalian cochleae. J Assoc Res Otolaryngol 13: 733–743, 2012 [DOI] [PMC free article] [PubMed] [Google Scholar]
- Markin VS, Hudspeth AJ. Modeling the active process of the cochlea: phase relations, amplification, and spontaneous oscillation. Biophys J 69: 138–147, 1995 [DOI] [PMC free article] [PubMed] [Google Scholar]
- McCormack A, Fortnum H. Why do people fitted with hearing aids not wear them? Int J Audiol 52: 360–368, 2013 [DOI] [PMC free article] [PubMed] [Google Scholar]
- Moayedi Y, Basch ML, Pacheco NL, Gao SS, Wang R, Harrison W, Xiao N, Oghalai JS, Overbeek PA, Mardon G, Groves AK. The candidate splicing factor sfswap regulates growth and patterning of inner ear sensory organs. PLoS Genet 10: e1004055, 2014 [DOI] [PMC free article] [PubMed] [Google Scholar]
- Moore BC. An Introduction to the Psychology of Hearing. London: Elsevier Academic, 2004 [Google Scholar]
- Mountain DC, Hubbard AE. A piezoelectric model of outer hair cell function. J Acoust Soc Am 95: 350–354, 1994 [DOI] [PubMed] [Google Scholar]
- Mountain DC, Hubbard AE, McMullen TA. Electromechanical processes in the cochlea. In: Mechanics of Hearing, edited by de B, oer E, Viergever MA. Delft, the Netherlands: Delft University Press, 1983, p. 119–126 [Google Scholar]
- Narayan SS, Temchin AN, Recio A, Ruggero MA. Frequency tuning of basilar membrane and auditory nerve fibers in the same cochleae. Science 282: 1882–1884, 1998 [DOI] [PMC free article] [PubMed] [Google Scholar]
- Neely ST, Kim DO. A model for active elements in cochlear biomechanics. J Acoust Soc Am 79: 1472–1480, 1986 [DOI] [PubMed] [Google Scholar]
- Nin F, Reichenbach T, Fisher JA, Hudspeth AJ. Contribution of active hair-bundle motility to nonlinear amplification in the mammalian cochlea. Proc Natl Acad Sci U S A 109: 21076–21080, 2012 [DOI] [PMC free article] [PubMed] [Google Scholar]
- Nowotny M, Gummer AW. Nanomechanics of the subtectorial space caused by electromechanics of cochlear outer hair cells. Proc Natl Acad Sci U S A 103: 2120–2125, 2006 [DOI] [PMC free article] [PubMed] [Google Scholar]
- Nuttall AL, Dolan DF. Steady-state sinusoidal velocity responses of the basilar membrane in guinea pig. J Acoust Soc Am 99: 1556–1565, 1996 [DOI] [PubMed] [Google Scholar]
- Olson ES, Duifhuis H, Steele CR. Von Bekesy and cochlear mechanics. Hear Res 293: 31–43, 2012 [DOI] [PMC free article] [PubMed] [Google Scholar]
- Peng AW, Ricci AJ. Somatic motility and hair bundle mechanics, are both necessary for cochlear amplification? Hear Res 273: 109–122, 2011 [DOI] [PMC free article] [PubMed] [Google Scholar]
- Ren T, Nuttall AL. Basilar membrane vibration in the basal turn of the sensitive gerbil cochlea. Hear Res 151: 48–60, 2001 [DOI] [PubMed] [Google Scholar]
- Ren TY, He WX. Measurement of basilar membrane, reticular lamina, and tectorial membrane vibrations in the intact mouse cochlea. In: What Fire Is in Mine Ears: Progress in Auditory Biomechanics. Melville, NY: AIP, 2011, p. 1403 [Google Scholar]
- Rhode WS. Observations of the vibration of the basilar membrane in squirrel monkeys using the Mossbauer technique. J Acoust Soc Am 2: 1218, 1971 [DOI] [PubMed] [Google Scholar]
- Robles L, Ruggero MA. Mechanics of the mammalian cochlea. Physiol Rev 81: 1305–1352, 2001 [DOI] [PMC free article] [PubMed] [Google Scholar]
- Ruggero MA, Rich NC. Furosemide alters organ of corti mechanics: evidence for feedback of outer hair cells upon the basilar membrane. J Neurosci 11: 1057–1067, 1991 [DOI] [PMC free article] [PubMed] [Google Scholar]
- Ruggero MA, Rich NC, Recio A, Narayan SS, Robles L. Basilar-membrane responses to tones at the base of the chinchilla cochlea. J Acoust Soc Am 101: 2151–2163, 1997 [DOI] [PMC free article] [PubMed] [Google Scholar]
- Russell IJ, Legan PK, Lukashkina VA, Lukashkin AN, Goodyear RJ, Richardson GP. Sharpened cochlear tuning in a mouse with a genetically modified tectorial membrane. Nat Neurosci 10: 215–223, 2007 [DOI] [PMC free article] [PubMed] [Google Scholar]
- Song L, Santos-Sacchi J. Disparities in voltage-sensor charge and electromotility imply slow chloride-driven state transitions in the solute carrier SLC26a5. Proc Natl Acad Sci U S A 110: 3883–3888, 2013 [DOI] [PMC free article] [PubMed] [Google Scholar]
- Soons J, Puria S, Steele CR. Finite element model of feed-forward/feed-backward amplification in the mouse cochlea. J Acoust Soc Am 134: 4063, 2013 [Google Scholar]
- Spicer SS, Schulte BA. Differences along the place-frequency map in the structure of supporting cells in the gerbil cochlea. Hear Res 79: 161–177, 1994 [DOI] [PubMed] [Google Scholar]
- Taberner AM, Liberman MC. Response properties of single auditory nerve fibers in the mouse. J Neurophysiol 93: 557–569, 2005 [DOI] [PubMed] [Google Scholar]
- von Bekesy G. Experiments in Hearing. New York: McGraw-Hill, 1960 [Google Scholar]
- Weddell TD, Mellado-Lagarde M, Lukashkina VA, Lukashkin AN, Zuo J, Russell IJ. Prestin links extrinsic tuning to neural excitation in the mammalian cochlea. Curr Biol 21: R682–R683, 2011 [DOI] [PMC free article] [PubMed] [Google Scholar]
- Weitzel EK, Tasker R, Brownell WE. Outer hair cell piezoelectricity: frequency response enhancement and resonance behavior. J Acoust Soc Am 114: 1462–1466, 2003 [DOI] [PMC free article] [PubMed] [Google Scholar]
- Xia A, Gao SS, Yuan T, Osborn A, Bress A, Pfister M, Maricich SM, Pereira FA, Oghalai JS. Deficient forward transduction and enhanced reverse transduction in the alpha tectorin C1509G human hearing loss mutation. Dis Model Mech 3: 209–223, 2010 [DOI] [PMC free article] [PubMed] [Google Scholar]
- Xia A, Song Y, Wang R, Gao SS, Clifton W, Raphael P, Chao SI, Pereira FA, Groves AK, Oghalai JS. Prestin regulation and function in residual outer hair cells after noise-induced hearing loss. PLos One 8: e82602, 2013 [DOI] [PMC free article] [PubMed] [Google Scholar]
- Xia A, Visosky AM, Cho JH, Tsai MJ, Pereira FA, Oghalai JS. Altered traveling wave propagation and reduced endocochlear potential associated with cochlear dysplasia in the BETA2/NeuroD1 null mouse. J Assoc Res Otolaryngol 8: 447–463, 2007 [DOI] [PMC free article] [PubMed] [Google Scholar]
- Xia A, Wooltorton JR, Palmer DJ, Ng P, Pereira FA, Eatock RA, Oghalai JS. Functional prestin transduction of immature outer hair cells from normal and prestin-null mice. J Assoc Res Otolaryngol 9: 307–320, 2008 [DOI] [PMC free article] [PubMed] [Google Scholar]
- Zha D, Chen F, Ramamoorthy S, Fridberger A, Choudhury N, Jacques SL, Wang RK, Nuttall AL. In vivo outer hair cell length changes expose the active process in the cochlea. PLos One 7: e32757, 2012 [DOI] [PMC free article] [PubMed] [Google Scholar]
- Zheng J, Shen W, He DZ, Long KB, Madison LD, Dallos P. Prestin is the motor protein of cochlear outer hair cells. Nature 405: 149–155, 2000 [DOI] [PubMed] [Google Scholar]
- Zinn C, Maier H, Zenner H, Gummer AW. Evidence for active, nonlinear, negative feedback in the vibration response of the apical region of the in-vivo guinea-pig cochlea. Hear Res 142: 159–183, 2000 [DOI] [PubMed] [Google Scholar]
- Zweig G. Finding the impedance of the organ of Corti. J Acoust Soc Am 89: 1229–1254, 1991 [DOI] [PubMed] [Google Scholar]
- Zwislocki JJ, Kletsky EJ. Tectorial membrane: a possible effect on frequency analysis in the cochlea. Science 204: 639–641, 1979 [DOI] [PubMed] [Google Scholar]