

Abstract
What is the relationship between language and other high-level cognitive functions? Neuroimaging studies have begun to illuminate this question, revealing that some brain regions are quite selectively engaged during language processing, whereas other “multiple-demand” (MD) regions are broadly engaged by diverse cognitive tasks. Nonetheless, the functional dissociation between the language and MD systems remains controversial. Here, we tackle this question with a synergistic combination of functional MRI methods: we first define candidate language-specific and MD regions in each subject individually (using functional localizers) and then measure blood oxygen level-dependent signal fluctuations in these regions during two naturalistic conditions (“rest” and story-comprehension). In both conditions, signal fluctuations strongly correlate among language regions as well as among MD regions, but correlations across systems are weak or negative. Moreover, data-driven clustering analyses based on these inter-region correlations consistently recover two clusters corresponding to the language and MD systems. Thus although each system forms an internally integrated whole, the two systems dissociate sharply from each other. This independent recruitment of the language and MD systems during cognitive processing is consistent with the hypothesis that these two systems support distinct cognitive functions.
Keywords: functional connectivity, language, multiple demand system
although the key brain regions engaged in language processing have been known since Broca (1861/2006) and Wernicke (1874/1969), debates continue on whether and to what extent they overlap with regions engaged in other cognitive processes. Many neuroimaging studies have reported that brain regions that process language [particularly Broca's (1861/2006) area] also engage in many nonlinguistic processes, including arithmetic (Dehaene et al. 1999; Stanescu-Cosson et al. 2000), music perception (Koelsch et al. 2002; Maess et al. 2001), working memory, and cognitive control (Blumstein 2009; Hein and Knight 2008; January et al. 2009; Kaan and Swaab 2002; Koechlin and Jubault 2006). Yet other studies have found that regions activated during nonlinguistic tasks are distinct from language-processing regions (Fedorenko et al. 2011, 2012; Monti and Osherson 2012; Monti et al. 2009, 2012). Specifically, many cognitively demanding tasks activate a set of frontal and parietal regions known as the “multiple-demand” (MD) system (Braver et al. 2003; Cole and Schneider 2007; Dosenbach et al. 2008; Duncan 2010; Duncan and Owen 2000; Fedorenko et al. 2013; Miller and Cohen 2001), which does not overlap with the classic fronto-temporal language system. Nonetheless, the dissociation between a putatively language-specific system and this domain-general MD system remains controversial (Blumstein and Amso 2013; Thompson-Schill et al. 2005).
To test for this dissociation, here, we compared the blood oxygenation level-dependent (BOLD) signal time courses of candidate language and MD regions by synergistically combining two functional MRI (fMRI) methods: functional localizers and functional correlations. First, we functionally localized candidate regions of interest (ROIs) in each subject (Fedorenko et al. 2010, 2013) using tasks that target linguistic processing (language localizer) and cognitive effort (MD localizer). Next, subjects were scanned during a “rest” period or during a story-comprehension task (conditions that are independent of and less constrained than the localizers). The time course of BOLD signal fluctuations during these two conditions was then extracted from each functionally defined region. Finally, we measured the pairwise correlations between time courses of different regions (separately for each condition). This approach enabled us to answer three questions. 1) To what extent do candidate language regions form a functionally integrated system (Cordes et al. 2000; Hampson et al. 2002; Newman et al. 2013; Turken and Dronkers 2011; Yue et al. 2013), as indexed by high correlations among these regions? 2) To what extent do candidate MD regions similarly form an integrated system (Dosenbach et al. 2007; Hampshire et al. 2012; Seeley et al. 2007)? 3) Critically, how functionally dissociable are language and MD regions from each other, as indexed by weak (or negative) correlations between pairs of regions straddling the two systems?
The current approach harnesses the complementary strengths of functional localizers and functional correlations. First, the rest and story-comprehension conditions allow us to sample a broader, more naturalistic range of cognitive processes compared with task-based studies. Second, functional correlations allow us to use not only hypothesis-driven methods but also data-driven clustering to discover the relationship between language and MD regions based on the covariation of their respective signal time courses. Third, we can straightforwardly interpret the emerging clusters in terms of their functionally characterized constituents, because our ROIs are functionally localized. Therefore, we do not have to rely on “reverse inference” from stereotaxic coordinates (Poldrack 2006), which is inevitable when no functional localizers are used (Lee et al. 2012; Mantini et al. 2013; Tie et al. 2012; Yeo et al. 2011).
MATERIALS AND METHODS
Subjects
Eighteen adult subjects (six men), aged 18–30, participated in a resting-state scan. Ten subjects (three men), aged 18–30, were scanned during a story-comprehension task (six of these also participated in the resting-state scan). All 22 subjects also completed independent localizer runs that were used to define candidate language and MD regions. Subjects were right handed and native speakers of English from Massachusetts Institute of Technology (MIT; Cambridge, MA) and the surrounding Cambridge community. All provided informed consent and were paid for participating in the study. The protocol was approved by the Internal Review Board at MIT.
Functional Localization of Candidate Language and MD Regions
Data acquisition.
Structural and functional data were collected on a whole-body 3 Tesla Siemens Trio scanner with a 32-channel head coil at the Athinoula A. Martinos Imaging Center at the McGovern Institute for Brain Research at MIT. T1-weighted structural images were collected in 176 sagittal slices [1 mm isotropic voxels; repetition time (TR) = 2,530 ms; echo time (TE) = 3.48 ms]. Functional BOLD data were acquired using an echo planar imaging sequence with a flip angle of 90° and applying generalized autocalibrating partially parallel acquisition with an acceleration factor of two. Images were collected in 31 near-axial slices, acquired in an interleaved order with a 10% distance factor [in-plane resolution: 2.1 × 2.1 mm; slice thickness: 4 mm; field of view: 200 mm in the phase encoding anterior to posterior (A > P) direction; matrix size: 96 mm × 96 mm; TR: 2,000 ms; TE: 30 ms]. Prospective acquisition correction (Thesen et al. 2000) was used to adjust the positions of the gradients based on the subject's head motion one TR back. The first 10 s of each run was excluded to allow for steady-state magnetization.
Design.
Candidate language and MD ROIs were functionally defined. The language localizer has been demonstrated previously to identify language-selective brain regions (Fedorenko et al. 2011) sensitive to high-level linguistic information, including syntax and lexical semantics (Fedorenko et al. 2012), and accordingly, contrasted reading of sentences with reading of sequences of pronounceable nonwords (presented one word/nonword at a time). After each sentence/nonword sequence, a probe word/nonword appeared, and subjects had to decide whether the probe item appeared in the preceding stimulus. Each of our 22 subjects completed two to four runs of the localizer, with Sentences and Nonwords blocks lasting either 24 s (four blocks/condition/run in a 336-s run, four subjects) or 18 s (eight blocks/condition/run in a 378-s run, 12 subjects; or six blocks/condition/run in a 396-s run, six subjects). The order of Sentences and Nonwords blocks was counterbalanced across runs and subjects. This localizer (available from http://web.mit.edu/evelina9/www/funcloc/funcloc_localizers.html) is robust to changes in materials, task, and modality of presentation (Fedorenko et al. 2010).
For the MD localizer, subjects performed a spatial working memory task that we have found to activate the MD system broadly and robustly (Fedorenko et al. 2013). Subjects had to keep track of four (easy condition) or eight (hard condition) locations in a 3 × 4 grid (Fedorenko et al. 2011). In both conditions, subjects performed a two-alternative, forced-choice task at the end of each trial to indicate the set of locations that they just saw. The contrast Hard > Easy targets brain regions engaged in cognitively demanding tasks. Fedorenko et al. (2013) have shown that the regions activated by this task are also activated by a wide range of other tasks contrasting a difficult vs. an easy condition. Each of our 22 subjects completed one to three runs of this MD localizer, with Hard and Easy blocks lasting 34 s (five blocks/condition/run in a 436-s run, 10 subjects), 32 s (six blocks/condition/run in a 448-s run, 11 subjects), or 18 s (six blocks/condition/run in a 288-s run, one subject). The order of Hard and Easy blocks was counterbalanced across runs and subjects.
Spatial image preprocessing and localizer task analysis.
MRI data were spatially preprocessed using SPM5 (http://www.fil.ion.ucl.ac.uk/spm; Statistical Parametric Mapping). To reduce data transformations, we performed all analyses in native, functional space. Each subject's functional data were motion corrected and then smoothed with a 4-mm full width at half-maximum Gaussian filter. In addition, the anatomical image of each subject was segmented into three probability maps, denoting areas of gray matter, white matter, and cerebrospinal fluid (CSF; see Functional Correlation Analysis), and these maps were then coregistered to the native functional space. The anatomical images were also further used for cortical surface reconstruction (see next section). The data for the localizer tasks were modeled using a general linear model with a boxcar regressor convolved with a canonical hemodynamic response function.
Definition of group-constrained, subject-specific fROIs.
For each subject, functional ROIs (fROIs) were defined by combining two sources of information (Fedorenko et al. 2010; Julian et al. 2012): 1) the subject's own activation map from the localizer runs and 2) group-level constraints (“masks”). The latter demarcated brain areas within which most or all individuals in prior studies showed activity for the localizer contrasts (Table 1).
Table 1.
Functional regions of interest (fROIs)
| Candidate Language Regions | Candidate MD Regions | ||||||
|---|---|---|---|---|---|---|---|
| Left Hemisphere | Right Hemisphere | Left Hemisphere | Right Hemisphere | ||||
| 1 | MidPostTemp | 9 | MidPostTemp | 17 | IFGop | 26 | IFGop |
| 2 | PostTemp | 10 | PostTemp | 18 | MFG | 27 | MFG |
| 3 | MidAntTemp | 11 | MidAntTemp | 19 | MFGOrb | 28 | MFGOrb |
| 4 | AntTemp | 12 | AntTemp | 20 | ParInf | 29 | ParInf |
| 5 | IFG | 13 | IFG | 21 | ParSup | 30 | ParSup |
| 6 | IFGOrb | 14 | IFGOrb | 22 | ACC | 31 | ACC |
| 7 | MFG | 15 | MFG | 23 | Insula | 32 | Insula |
| 8 | AngG | 16 | AngG | 24 | SMA | 33 | SMA |
| 25 | PrecG | 34 | PrecG | ||||
MD, multiple-demand; MidPostTemp, middle-posterior temporal lobe; PostTemp, posterior temporal lobe; MidAntTemp, middle-anterior temporal lobe; AntTemp, anterior temporal lobe; IFG, inferior frontal gyrus; IFGOrb, orbital-IFG; MFG, middle frontal gyrus; AngG, angular gyrus; IFGop, opercular IFG; MFGOrb, orbital-MFG; ParInf, inferior parietal lobe; ParSup, superior parietal lobe; ACC, anterior cingulate cortex; Insula, insular cortex; SMA, supplementary and presupplementary motor area; PrecG, precentral gyrus.
For the language fROIs, we used masks derived from a group-level representation of data for the Sentences > Nonwords contrast in an independent group of subjects (Fedorenko et al. 2010) (masks available for download at http://web.mit.edu/evelina9/www/funcloc/funcloc_parcels.html). Following Fedorenko et al. (2011), eight masks were used for defining fROIs in the left hemisphere, including regions in the posterior temporal lobe (PostTemp) and middle-PostTemp, anterior and middle-anterior temporal lobe, inferior frontal gyrus (IFG) and orbital-IFG, middle frontal gyrus (MFG), and angular gyrus (AngG). These masks were mirror projected onto the right hemisphere to create eight homologous masks, resulting in a total of 16 language masks. As the masks (illustrated in Fig. 1) cover significant parts of the cortex, their mirrored version is likely to encompass the right-hemisphere homologues of the left-hemispheric, language-selective regions, despite possible hemispheric asymmetries in their precise anatomical location.
Fig. 1.
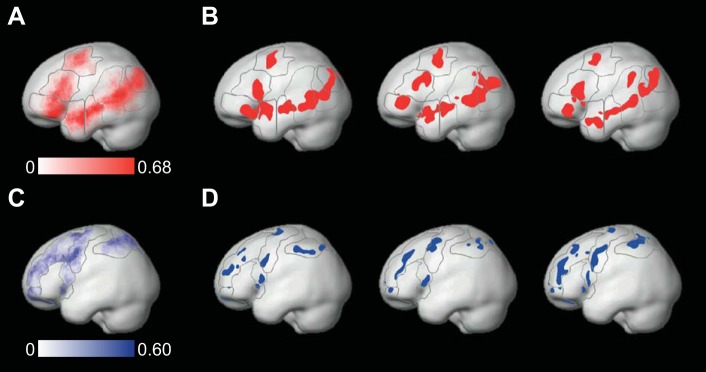
Group-constrained, subject-specific functional regions of interest (fROIs). A and C: probability maps of the locations of fROIs across subjects, for the language (red) and multiple-demand (MD; blue) systems, respectively. Higher color saturation corresponds to a higher number of subjects having a significant activation in the relevant voxel. Apparent overlap between fROIs is only at the group level, not the individual subject level. B and D: candidate language fROIs (red) and candidate MD fROIs (blue) in the left hemisphere of 3 representative subjects. In all subfigures, dark gray lines demarcate the masks used to constrain the location of fROIs (see Definition of group-constrained, subject-specific fROIs). All subfigures are in Montreal Neurological Institute space for illustration purposes only (fROI definition and functional correlation analyses were carried out in the native functional space of each individual subject). Apparent overlap between different fROIs only results from the projection of fROIs onto the cortical surface.
The right-hemisphere homologues were included for two reasons. First, these regions appear to be activated during at least some aspects of language processing, albeit usually not as strongly as the typical, left-lateralized language regions (Chiarello et al. 2003; Jung-Beeman 2005). Second, given that left-hemisphere damage, but typically not right-hemisphere damage, leads to difficulties in language production and comprehension (Damasio 1992; Geschwind 1970), we wanted to examine hemispheric differences in functional correlations. For example, we wanted to see whether left-hemisphere language regions would show stronger inter-region correlations, which might be expected of a core language system (cf. the MD regions, which are strongly bilateral and should thus show similarly strong inter-region correlations in the left and right hemispheres).
For the MD fROIs, we used anatomical masks (Tzourio-Mazoyer et al. 2002) that included the main regions linked to MD activity in prior work, following the methods of Fedorenko et al. (2013) [for a similar approach, see Fedorenko et al. (2012)]. Eighteen masks were used, nine in each hemisphere, including regions in the opercular IFG, MFG, including its orbital part, insular cortex (Insula), precentral gyrus, supplementary and presupplementary motor area (SMA), inferior and superior parietal lobe, and anterior cingulate cortex (ACC).
These group-level masks, in the form of binary maps, were used to constrain systematically the selection of subject-specific fROIs. Thus for each subject, 16 candidate language fROIs were created by intersecting the subject's unthresholded t-map for the Sentences > Nonwords contrast with the language masks. For each subject and for each mask, the 10% of voxels with the highest t-values in the intersection image was then used to define a fROI (note that the voxels included in the right-hemisphere fROIs were not constrained to be mirrored versions of their left-hemisphere counterparts but were only constrained to land within a mirrored version of the broad masks). Similarly, 18 candidate MD fROIs were created for each subject by intersecting the subject's unthresholded t-map for the Hard > Easy contrast with the MD masks, again selecting the 10% of voxels with the highest t-values within each mask. Finally, we excluded a small set of voxels that was contained in more than one fROI, due to small spatial overlap between language and MD activation maps. Across subjects, these excluded voxels comprised 1.67% (2.60) of our fROIs (for all subjects, 16 fROIs had no voxels excluded from them; each of the remaining 18 fROIs had <7% excluded voxels).
The definition of fROIs as the 10% of voxels with the highest t-values for a localizer contrast in a given mask balances the trade-off between: 1) choosing only voxels with a BOLD time course that strongly covaries with the localizer conditions (Sentences > Nonwords or Hard > Easy) and 2) having a sufficient number of voxels in the fROI. In addition, this procedure ensures that each fROI has a constant size across subjects. However, we obtained similar results to those reported below when fROIs were instead defined by intersecting the language or MD masks with a thresholded t-map for the language or MD contrasts, respectively (P = 0.001, uncorrected).
The language and MD masks used here were originally created in Montreal Neurological Institute (MNI) space. Therefore, before defining fROIs, the masks had to be projected onto each subject's native functional space. This was done in two steps: first, combined volume and surface registration (Postelnicu et al. 2009) was used to estimate the transformation of an MNI anatomical (T1) template to the native anatomical space of each subject, and the resulting transformation was applied to the masks. Second, affine coregistration was used to project the masks from native anatomical space onto native functional space. Only then were the masks intersected with subjects' t-maps from the functional localizers.
The localizer effects were highly reliable in all fROIs. Reliability was tested via an n-fold, leave-one-out cross-validation across runs: for each subject, we defined fROIs based on all localizer runs but one and then derived estimates of the localizer contrast effect for the left-out run in these fROIs. The contrast effect estimates were averaged across all possible left-out runs and then tested for significance across subjects [false discovery rate (FDR) corrected for the number of regions]. For all left-hemisphere candidate language regions, t(21) > 6.47, P < 10−5; for all right-hemisphere candidate language regions, t(21) > 2.70, P < 0.007; and for all candidate MD fROIs, t(19) > 5.64, P < 10−4. Figure 1 shows the language and MD fROIs in the left hemisphere of three representative subjects, as well as probability maps of fROI locations across all subjects.
Functional Correlation Analysis
Data acquisition.
Functional data were collected using the same parameters as for the functional localizers.
Design.
In the resting-state condition, subjects were instructed to close their eyes but to remain awake and let their mind wonder for 5 min. In the story-comprehension condition, subjects listened to four to six stories over the scanner-safe headphones (Sensimetrics, Malden, MA). Each story lasted between 4.5 and 6 min. Stories were constructed from existing, publicly available texts (fairy tales, short stories, and Wikipedia articles) but edited so as to include a variety of linguistically interesting phenomena that do not occur with sufficiently high frequency in natural texts (e.g., infrequent words, nonlocal syntactic dependencies, unusual syntactic constructions, temporary ambiguity, etc.; for examples, see Table 2). (The motivation for editing the stories had to do with the use of these materials in another project aimed at understanding the processing of different kinds of linguistic complexity.) The stories were then recorded by two native English speakers (one man and one woman). After each story, subjects answered six comprehension questions, presented in a two-alternative, forced-choice format. For each subject, accuracy on these questions was significantly above chance, as indicated by the binomial test [for all tests, P < 10−11, Bonferroni corrected for the number of subjects; mean accuracy across subjects: 83.09% (10)].
Table 2.
Linguistic materials used in the story-comprehension task
| Examples | |
|---|---|
| Infrequent words | “Autosomal” |
| “Brunt” | |
| “Conjectured” | |
| Nonlocal syntactic dependencies | “The kindly Lord of the Manor who the people had often asked for help…” |
| “The severity of the problem the people faced…” | |
| “The water snail that she had discovered a couple of days ago…” | |
| Unusual syntactic constructions | “A source of great trouble to the local folk the boar was…” |
| “It was the first huntsman who was…” | |
| “Into vapor the water drops that danced in the ocean had been changed…” | |
| Temporary ambiguity | “The huntsman questioned by the Lord…” |
| “The matron understood my idea was something that I was excited about…” | |
| “Abby's mom denied Abby's version of the story was true…” |
Spatial image preprocessing.
Functional data were spatially preprocessed using the same procedure applied for the localizer runs.
Temporal preprocessing.
Temporal preprocessing was carried out using the CONN toolbox (Whitfield-Gabrieli and Nieto-Castanon 2012) with default parameters, unless specified otherwise. First, noise introduced by signal fluctuations originating from non-neuronal sources (e.g., respiratory and cardiac activity) was removed. To this end, the first five temporal principal components of the BOLD signal time course extracted from the white matter were regressed out of each voxel's time course; signal originating in the CSF was similarly regressed out. White matter and CSF voxels were identified based on segmentation of the anatomical image (Behzadi et al. 2007). The first six principal components of the six motion parameters estimated during offline motion correction were also regressed out, as well as their first time derivative. Second, the residual signal was bandpass filtered (0.008–0.09 Hz) to preserve only low-frequency signal fluctuations (Cordes et al. 2001).
Data analysis.
Analysis of functional correlations was carried out separately for each of the two experimental conditions (resting-state and story-comprehension). For each subject, we averaged the BOLD signal time course across all voxels in each fROI. For each pair of fROIs, Pearson's moment correlation coefficient was then computed between their respective time courses. These correlations were Fisher transformed to improve normality, and three one-way, repeated-measures ANOVAs were then performed on the data to assess whether different regions showed different patterns of functional correlations. First, we compared the average correlation within the candidate language system (i.e., the average of all 120 pairwise correlations among the 16 language fROIs), the average correlation within the candidate MD system (i.e., the average of all 153 pairwise correlations among the 18 MD fROIs), and the average correlation across the two systems (i.e., the average of all 288 pairwise correlations between a language fROI and a MD fROI). Second, for the language system, we compared the mean correlation within the left hemisphere (averaging across all 28 pairwise correlations among the eight language fROIs in the left hemisphere), the analogous mean correlation within the right hemisphere, and the mean correlation across the two hemispheres (averaging across 64 pairwise correlations). Third, the same within-hemisphere vs. across-hemispheres comparison was carried out for the MD system.
For visualization purposes, we also created two group-level matrices of fROI-to-fROI correlations, one for each experimental condition. Specifically, the Fisher-transformed correlation between each pair of fROIs was averaged across subjects (the Fisher transform decreases the bias in averaging) (Silver and Dunlap 1987), and the resulting average correlations were then inverse Fisher transformed. The two group-level fROI-to-fROI correlation matrices are presented in Fig. 2. However, to ensure that the patterns of functional correlations reported here were observed consistently across individual subjects, the majority of our analyses did not use these average correlation matrices but was instead performed within subjects (e.g., the repeated-measures ANOVAs described above). Only the hierarchical clustering analysis (see below) relied on group-level average correlations.
Fig. 2.

Matrices of fROI-to-fROI functional correlations, for (A) the resting-state condition and (C) the story-comprehension condition. Matrices in B and D present the same data as A and C, respectively, but show only significant correlations [α = 0.05, false discovery rate (FDR) corrected]. Nonsignificant correlations are colored in black. The order of fROIs across rows (and columns) follows Table 1, where regions are sorted by system (language, then MD). Within each system, fROIs are sorted by hemisphere [left hemisphere (LH), then right hemisphere (RH)]. Thick, white lines separate these subsets of fROIs.
Controlling for the effects of head motion.
Head-motion artifacts have been reported to affect functional correlations (Power et al. 2012; Satterthwaite et al. 2012; Van Dijk et al. 2010). To ensure that such artifacts could not account for the results reported here, we performed two control analyses. First, for each experimental run of each subject, time points with excessive head motion (“motion spikes”) were identified using the Artifact Detection Toolbox implemented in Matlab (available for download at http://www.nitrc.org/projects/artifact_detect/). Each motion spike was then included as a regressor during temporal preprocessing (see above), thus removing the effects of these time points on our residual BOLD time courses (Lemieux et al. 2007; Satterthwaite et al. 2013). This control analysis and our original analysis (without “spike regression”) resulted in qualitatively similar patterns of functional correlations. To minimize data manipulations, we report the results of our original analysis.
Second, we tested whether individual differences in estimated head motion could explain individual differences in functional correlation patterns. First, each subject's six motion parameters were collapsed to a single value, mean relative displacement (MRD) (Jenkinson et al. 2002). Then, we computed the Pearson correlation across subjects, between MRD, and each of three measures described above: 1) the mean functional correlation within the language system, 2) the mean functional correlation within the MD system, and 3) the mean functional correlation across the two systems. None of these measures was correlated significantly with MRD (FDR corrected) in either the resting-state or the story-comprehension condition (the correlations that were significant before FDR correction were opposite in direction to our reported effects). On average, individual differences in head motion explained 5% of the individual differences in functional correlation patterns. We then repeated this analysis using the point biserial correlation instead of the Pearson correlation by splitting our sample into a “high MRD” half and a “low MRD” half. Whereas the two halves differed significantly in MRD, they did not differ in their functional correlation patterns. We therefore conclude that our results reported below cannot result from a head-motion artifact.
Clustering Analyses
k-Means.
To reveal the dominant patterns of functional correlations across our fROIs in a relatively data-driven fashion, we submitted, separately for each subject, the average BOLD signal time courses from candidate language and MD fROIs to the k-means clustering algorithm from Matlab. To ensure that the choice of k did not impose on the data an implicitly hypothesized division into language and MD systems, separate analyses were run with values of k ranging from two to six clusters. The pairwise distance measure used for clustering was defined as one minus the correlation between different time courses. To choose the initial cluster centroids, k time courses out of a subject's data were sampled randomly, and this procedure was repeated 50 times to generate multiple clustering solutions. To pool the resulting data, we then computed, for each pair of fROIs, the probability (percentage of solutions across random initializations and subjects) that the two fROIs would both be assigned to the same cluster. Such pooling provides a straightforward way to collapse results across subjects with different cluster solutions or cluster numbering (i.e., order; such pooling is also known as “consensus clustering”) [see Bassett et al. (2013); Lancichinetti and Fortunato (2012)].
We assessed the significance of our clustering results with a permutation test. For each subject, we created a surrogate BOLD signal time course for each fROI by phase-shuffling its original time course (i.e., reassigning the phases of different frequencies uniformly at random with replacement). The 34 surrogate time courses of each subject were then clustered, and the clustering solutions were pooled across subjects, using the same procedures described above. We repeated this permutation procedure 1,000 times, generating for each pair of fROIs a null distribution of the probability that they would be assigned to the same cluster. The true probability, based on clustering the real data, was compared against this distribution to produce a two-tailed P value. Multiple comparisons were FDR corrected (Benjamini and Yekutieli 2001) separately for each fROI (each pair of the 34 fROIs was assigned a P value, so each fROI had 33 P values associated with it). This test yielded results similar to those obtained when we shuffled the original time courses across fROIs instead of generating surrogate time courses.
In the previous analysis, the clustering algorithm was data driven in the sense that it was not provided with information about which fROIs were candidate language regions and which were candidate MD regions. Nonetheless, the analysis was still constrained to treat each fROI as a distinct entity, as the clustering was run on time courses that were averaged across all voxels within each fROI. To relax this constraint partially, our next analysis clustered the BOLD signal time courses of individual voxels across all fROIs. As in the previous analysis, 50 clustering solutions were generated for each subject, where randomly sampled time courses served as initial cluster centroids. For each clustering solution, we then performed the following computation: first, we examined each set of voxels, originating from within a single fROI, to determine its “dominant cluster” (i.e., the cluster that had the largest number of voxels in that fROI assigned to it). Then, for each pair of fROIs, we computed the percentage of voxels in the first fROI assigned to the cluster that was dominant in the second fROI (this resulted in two measures, depending on which fROI was “first” and which was “second”). This procedure provided, for each pair of fROIs, a voxel-wise measure of cluster similarity, which was then averaged across random initializations and subjects. To test the significance of this cluster similarity measure for each pair of fROIs, we applied a phase-shuffling permutation test following the same procedure as described above.
This second analysis used data from single voxels rather than fROIs, yet the similarity measure that we computed for pooling the results across subjects still referred to the original grouping of voxels into fROIs. However, this measure was only computed after voxel-wise clustering had taken place. We chose this measure because our data did not allow for comparing single voxels across subjects: as fROIs were defined in a subject-specific manner, voxels falling within a fROI for one subject might not have fallen within any fROI for another subject, thus entering the clustering analysis for the former subject but not the latter.
Hierarchical clustering.
Hierarchical clustering is an algorithm that creates a binary tree structure connecting elements in a set, such that the length of branches on the tree approximates the distances among the elements, as provided by the user (Hartigan 1975). The clustering together of elements, whose connecting path on the tree is shorter than a chosen length, therefore creates a partition of the element set without prespecifying the number of resulting clusters (in contrast to k-means). We performed hierarchical clustering on our fROIs, providing the group-level fROI-to-fROI correlation matrix as input so that the distance between two fROIs was defined as one minus their correlation. Clustering was based on average linkage so that two clusters were merged into a bigger cluster based on the mean distance between their respective members.
The optimal partition of fROIs, based on the resulting tree, was identified via a measure of modularity (Newman and Girvan 2004). First, by gradually decreasing the path length used as a criterion for clustering fROIs, we generated the set of all possible partitions licensed by our hierarchical clustering solution (the longest path length generates a single cluster consisting of all 34 fROIs; the shortest path length generates 34 singleton clusters). Then, for each partition, we computed a reformulated modularity measure that is appropriate for detecting clusters in correlated data (Gómez et al. 2009). High modularity values indicate clustering solutions, where within each cluster, the positive functional correlations are stronger (and the negative functional correlations are weaker) compared with what is expected under a null model. The null model is a random fROI-to-fROI correlation matrix that preserves, for each fROI, the sum of its positive correlations and the sum of its negative correlations with the other fROIs.
RESULTS
Functional Correlation Analysis: Comparing Systems and Hemispheres
Comparison of the language and MD systems.
Figure 2 presents, for the resting-state and story-comprehension conditions, matrices of pairwise correlations between candidate language and MD fROIs computed on the time courses of BOLD signal fluctuations. A clear partition of the fROIs is visually evident before any statistical analysis: most pairs of language fROIs are strongly and positively correlated with each other (cf. top-left quadrant of the correlation matrices), and most pairs of MD ROIs are also strongly and positively correlated with each other (cf. bottom-right quadrant of the correlation matrices); but correlations of most pairs consisting of a language fROI and a MD fROI are noticeably weaker (cf. bottom-left and top-right quadrants of the correlation matrices). Moreover, during story comprehension, there are significant, negative correlations between candidate left-hemisphere language fROIs and right-hemisphere MD fROIs. These results indicate a functional architecture comprised of two systems, one consisting of language regions and the other consisting of MD regions. BOLD signal fluctuations within each system are highly synchronized, but the two systems are functionally dissociated.
To test quantitatively for the language-MD functional dissociation, we compared the average pairwise correlation within the language system (across all fROI pairs) with the average pairwise correlation within the MD system and the average pairwise correlation across the two systems (Fig. 3; averages were computed based on Fisher-transformed correlations; see materials and methods). Specifically, a one-way, repeated-measures ANOVA was carried out to compare functional correlations among these three levels (“within language,” “within MD,” and “across systems”). Consistent with our qualitative observations, a highly robust effect was revealed in both conditions [resting-state: F(2,34) = 62.84, P < 10−11; story-comprehension: F(2,18) = 78.56, P < 10−8]. In the resting-state condition, post hoc pairwise comparisons (Bonferroni corrected, for all that follow) showed that the average correlation across the two systems (r = 0.03, SD 0.11 across subjects) was weaker than the average correlation within the language system (r = 0.38, SD 0.13) and within the MD system [r = 0.41, SD 0.09; for both tests, t(17) > 8.47, P < 10−6]. Similarly, in the story-comprehension condition, the average correlation across the two systems (r = −0.03, SD 0.10) was weaker than the average correlation within the MD system (r = 0.37, SD 0.11), which was, in turn, weaker than the average correlation within the language system [r = 0.49, SD 0.08; for both tests, t(9) > 3.68, P < 0.016].
Fig. 3.
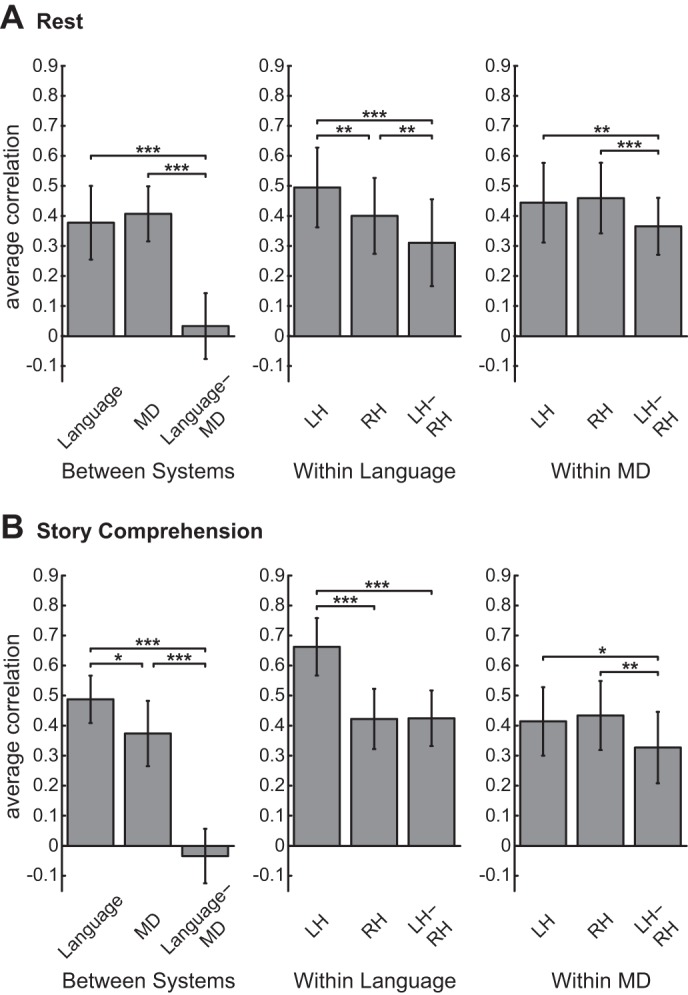
Comparisons of average correlations within and across systems and hemispheres for (A) the resting-state condition and (B) the story-comprehension condition. Three repeated-measures comparisons are presented. Left: comparison of the average pair-wise correlation within the language system (i.e., across all language fROI pairs), the average correlation within the MD system (i.e., across all MD fROI pairs), and the average correlation between the 2 systems (i.e., across all pairs of a language fROI and a MD fROI). Middle: comparison of the average pairwise correlation within the LH, within the RH, and between hemispheres in the language system. Right: comparison of the average pairwise correlation within the LH, within the RH, and between hemispheres in the MD system. Error bars show SDs across subjects; *P < 0.05, **P < 0.01, ***P < 0.001 (Bonferroni corrected for multiple comparisons).
Within-system and between-system correlations were also compared while controlling for the effect of anatomical distance among fROIs. To this end, we computed the Euclidean distances between each pair of ipsilateral fROIs, based on either their respective center-of-mass coordinates or their point of maximal proximity. Then, for each fROI, its distances from all other ipsilateral fROIs were regressed out from the corresponding functional correlations (separate analyses were performed for the two distance measures). For each fROI, we then tested whether its residual correlations with other fROIs that belonged to its own system were stronger than its residual correlations with fROIs that belonged to the other system. We found that correlations within each system remained stronger than correlations across the two systems. This difference in correlation strength reached significance for all fROIs (Bonferroni corrected for multiple comparisons) except for two language fROIs in the right hemisphere: the AngG (in both the resting-state and story-comprehension conditions) and the MFG (in the resting-state condition).
Comparison of the left and right hemispheres.
We next compared, for each of the language and MD systems, the average pairwise correlation within the left hemisphere with the average pairwise correlation within the right hemisphere and the average pairwise correlation across the two hemispheres (Fig. 3). Specifically, a one-way, repeated-measures ANOVA was carried out to compare functional correlations among these three levels (“within right hemisphere,” “within left hemisphere,” and “across hemispheres”).
For the language system, a significant hemispheric difference was revealed in both the resting-state [F(2,34) = 28.97, P < 10−7] and the story-comprehension [F(1.11, 9.99) = 63.95, P < 10−5, Greenhouse-Geisser corrected for nonsphericity] conditions. In the resting-state condition, post hoc pairwise comparisons showed that the average correlation in the left hemisphere (r = 0.50, SD 0.14) was stronger than the average correlation in the right hemisphere (r = 0.40, SD 0.13), which was, in turn, higher than the average correlation across hemispheres [r = 0.31, SD 0.15; for all tests, t(17) > 3.61, P < 0.007]. In the story-comprehension condition, post hoc pairwise comparisons showed that the average correlation within the left hemisphere (r = 0.66, SD 0.10) was stronger than the average correlation in the right hemisphere (r = 0.42, SD 0.11), as well as across hemispheres [r = 0.43, SD 0.10; for both tests, t(9) > 7.54, P < 0.001], but the latter two did not differ significantly.
In the MD system, significant hemispheric effects were also revealed in the resting-state [F(1.22 20.69) = 8.19, P = 0.007, Greenhouse-Geisser corrected] and story-comprehension [F(2,18) = 13.51, P < 0.001] conditions. In the resting-state condition, post hoc pairwise comparisons showed that the average correlation across hemispheres (r = 0.37, SD 0.10) was weaker than the average correlation within the left hemisphere (r = 0.44, SD 0.14) and within the right hemisphere [r = 0.46, SD 0.12; for both tests, t(17) > 4.27, P < 0.002]. Similar results were found for the story-comprehension condition [across hemispheres: r = 0.33, SD 0.13; left hemisphere: r = 0.42, SD 0.12; right hemisphere: r = 0.43, SD 0.12; for both tests, t(9) > 3.88, P < 0.012].
k-Means
Clustering fROIs.
We clustered fROIs based on the correlations among their respective average BOLD signal time courses, separately for each subject. For both the resting-state and the story-comprehension conditions, clustering the fROIs into k = 2 clusters revealed a clear partition between the language system and the MD system (Fig. 4A). Across subjects in the resting-state condition, an average of 14.24 (1.44) fROIs out of the 16 candidate language fROIs, or 89% (0.09), was grouped into one cluster, whereas an average of 16.39 (1.32) fROIs out of the 18 candidate MD fROIs, or 91% (0.07), was grouped into a different cluster. Similarly, across subjects in the story-comprehension condition, an average of 14.59 (1.00) fROIs out of the 16 candidate language fROIs, or 91% (0.06), was grouped into one cluster, whereas an average of 16.49 (1.80) fROIs out of the 18 candidate MD fROIs, or 92% (0.1), was grouped into a different cluster. A notably inconclusive clustering pattern was only observed for two candidate, right-hemisphere, homologue-language fROIs, namely the right AngG and MFG. Across subjects in the resting-state condition, these two regions were assigned to the language-dominant cluster only on 57.2% (47) and 51.8% (48) of the clustering solutions, respectively. Across subjects in the story-comprehension condition, these two regions were assigned to the language-dominant cluster only on 63.5% (28) and 50.5% (34) of the clustering solutions, respectively. Importantly, the separation between language and MD systems did not result from constraining the algorithm to generate exactly two clusters; a similar pattern was obtained for values of k ranging from three to six clusters, where candidate language fROIs were still clustered with each other more often than with MD fROIs and vice versa (Fig. 5).
Fig. 4.

k-Means clustering results for the resting-state (left) and story-comprehension (right) conditions, with k = 2 clusters. A and D: the average blood oxygenation level-dependent (BOLD) signal time course of each fROI was extracted, and the resulting time courses were clustered. In the fROI-to-ROI similarity matrices plotted here, the color of an entry (i,j) for a given pair of fROIs represents the probability (percentage of clustering solutions across subjects and initializations) that the 2 fROIs would both be assigned to the same cluster. B and E: BOLD signal time courses of all voxels falling within our fROIs were clustered. For each fROI, its “dominant cluster” was then defined as the cluster to which most of the voxels originating within that fROI were assigned. In the fROI-to-ROI similarity matrices plotted here, the color of an entry (i,j) for a given pair of fROIs represents the percentage of voxels in fROI j that was assigned to the dominant cluster of fROI i (note that this is not symmetrical). Percentages are averaged across subjects and initializations. In all matrices (A–D), only significant entries are shown (as assessed with a permutation test, based on phase-shuffling of the original BOLD time courses; α = 0.05, FDR corrected). Nonsignificant entries are colored in black. The order of fROIs across rows (and columns) follows Table 1, where regions are sorted by system (language, then MD). Within each system, fROIs are sorted by hemisphere (LH, then RH). Thick, white lines separate these subsets of fROIs. C and F: same data as in B and E, respectively. The proportion of “language voxels” and “MD voxels” from each hemisphere that were assigned to each cluster is presented (across the 2 clusters, bars of the same color add to 100%). Error bars show SDs across subjects.
Fig. 5.

k-Means clustering results of functional correlation data as a function of k. Conventions are the same as in Fig. 4.
The partition of fROIs into a language cluster and a MD cluster was not expected to occur at random, as indicated by a permutation test using surrogate BOLD time courses (created via phase-shuffling of the original data). Out of the 91 possible pairs of 14 language fROIs (excluding the right AngG and MFG), 86 pairs (94.5%) in the resting-state condition and 91 pairs (100%) in the story-comprehension condition were jointly clustered significantly more often than expected by chance. Similarly, out of the 153 possible pairs of 18 MD fROIs, 137 pairs (89.5%) in the resting-state condition and 153 pairs (100%) in the story-comprehension condition were jointly clustered significantly more often than expected by chance. Conversely, out of 288 possible pairs consisting of a language fROI and a MD fROI, 285 pairs (99%) in the resting-state condition and 288 pairs (100%) in the story-comprehension condition were jointly clustered less often than expected by chance.
Clustering individual voxels.
When BOLD time courses from all individual voxels within our fROIs were clustered into k = 2 clusters, a “language-dominant” cluster and a “MD-dominant” cluster again emerged. Namely, a high percentage of voxels originating within language fROIs was assigned to one cluster [resting-state: 76.59% (9.11); story-comprehension: 83.76% (6.44); averaged across subjects], but this same cluster consisted of much fewer voxels originating within MD fROIs [resting state: 19.66% (7.67); story comprehension: 19.38% (9.14)]. This cluster was hence language dominant, with the other cluster showing the opposite, MD-dominant pattern. The difference between the percentage of language voxels assigned to a cluster and the percentage of MD voxels assigned to the same cluster was significant [resting-state: t(17) = 16.61, P < 10−11; story-comprehension: t(9) = 15.28, P < 10−7; Fig. 4, C and F].
When we compared, for every given pair of fROIs, the assignments of their constituent voxels into the two clusters, we observed a clustering pattern similar to that reported for fROI-wise clustering. Namely, in both the resting-state and the story-comprehension conditions, a partition between the language and MD systems again emerged (Fig. 4, B and E). Thus the majority of voxels originating in language fROIs were assigned to the same cluster, whereas the majority of voxels originating in MD fROIs were assigned to the other cluster. The least conclusive clustering pattern was again observed for the right AngG and MFG (candidate, right-homologue language fROIs). Only about one-half of the voxels originating in these fROIs was assigned to the language-dominant cluster, whereas the other half was assigned to the MD-dominant cluster. Out of the 91 possible pairs of the remaining 14 language fROIs, 86 pairs (94.5%) in the resting-state condition and 91 pairs (100%) in the story-comprehension condition had their voxels jointly clustered significantly more often than expected by chance. Similarly, out of the 153 possible pairs of the 18 MD fROIs, 140 pairs (91.5%) in the resting-state condition and 153 pairs (100%) in the story-comprehension condition had their voxels jointly clustered significantly more often than expected by chance. Conversely, out of the 288 possible pairs consisting of a language fROI and a MD fROI, 286 pairs (99.3%) in the resting-state condition and 287 pairs (99.7%) in the story-comprehension condition had their voxels jointly clustered less often than expected by chance. As was the case for fROI-wise clustering, the general patterns of voxel-wise clustering also did not depend on the choice of k (Fig. 5).
Hierarchical Clustering
Tree structures (dendrograms) of fROIs, constructed based on their correlations, revealed a functional architecture dominated by the partition into language and MD systems (Fig. 6). In both the resting-state and the story-comprehension conditions, the top-most branching of the tree already separated the set of candidate language fROIs from the set of candidate MD fROIs. Thus the clustering together of regions whose distance was shorter than the height of the first branching partitioned the data into language and MD systems. In both experimental conditions, this partition into two clusters had the highest modularity value compared with all other possible partitions licensed by the hierarchical tree, suggesting that the functional dissociation between the language and MD systems is the key organizational principle underlying the data.
Fig. 6.

Results of hierarchical clustering for (A) the resting-state condition and (B) the story-comprehension condition. Hierarchical clustering creates a binary tree, with branch length (here, horizontal lines) corresponding to the similarity between fROIs (or sets of fROIs). Above each hierarchical tree, modularity is plotted for all fROI partitions licensed by the tree. Each point on the modularity plot corresponds to a partition generated by drawing an imaginary vertical line from that point through the tree and clustering together only those fROIs that are merged to the left of this line (fROIs that are merged to the right of the line remain in separate clusters). Sample vertical lines are drawn for the maximal modularity, which corresponds to a partition of the data into 2 clusters, 1 consisting of language fROIs and the other consisting of MD fROIs. R, right; L, left; Supp., supplementary; Insula, insular cortex.
The organization of fROIs within each of the two systems provides further clues into their functional architecture. This organization could be characterized by using a short-distance threshold for clustering regions into small subgroups and then slowly increasing the threshold so that they merge into larger subgroups. The functional organization thus revealed was largely similar across the resting-state and story-comprehension conditions.
In the language system, especially during rest, clustering was dominated by hemisphere, and within each hemisphere, regions were clustered according to their lobe. Namely, left-temporal regions were clustered together and only then merged with left-frontal regions. Next, these left-hemisphere regions were merged with right-hemisphere regions, which themselves also formed temporal and frontal subsets. The right AngG and MFG were among the last to merge with the rest of the language system (consistent with our k-means results), along with the left AngG and right PostTemp.
In the MD system, clustering was sometimes dominated by hemisphere and sometimes by interhemispheric homology. Namely, most frontal and parietal regions tended to merge with each other ipsilaterally before merging across hemispheres. However, the Insula, SMA, ACC, and MFG were each first clustered with their contralateral homologue and only then merged with each other and with the former “fronto-parietal” subset.
DISCUSSION
The findings reported here demonstrate that fMRI BOLD signal fluctuations are strongly correlated among different brain regions of the language system, as well as among different regions of the MD system, but correlations across these two systems are weak or negative. These results are robust, generalizing across two conditions: rest, where signal fluctuations are not driven by an external task, and story comprehension, where signal fluctuations are task evoked; and they arise in similar form from both hypothesis-driven and data-driven analyses. These data provide powerful, new evidence that each of these systems forms a cohesive, integrated whole, yet the two systems are functionally dissociated from each other.
Previous studies that used data-driven clustering of voxels across the brain, based on resting-state functional data, provided the groundwork for the present study and even revealed systems that approximately resemble the language and MD systems investigated here (Lee et al. 2012; Mantini et al. 2013; Tie et al. 2012; Yeo et al. 2011). However, the only way to link the clusters that emerged in those studies to the wealth of knowledge about the functions of different brain regions is through reverse inference, based on stereotaxic coordinates (Poldrack 2006). Such anatomy-based inferences are particularly challenging for the language and MD systems, because the mapping between stereotaxic coordinates and functional regions is degraded by both the high variability across subjects in the anatomical locations of each region (Amunts et al. 1999; Frost and Goebel 2012; Juch et al. 2005; Paus et al. 1996; Tahmasebi et al. 2012; Tomaiuolo et al. 1999) and the frequent proximity of language and MD regions (Fedorenko et al. 2012). Here, we circumvented these problems by performing our clustering analyses on regions (and voxels) that were defined functionally within each subject, thereby allowing a direct interpretation of the resulting clusters in terms of specific functional hypotheses.
The combination of a subject-specific, functional localization approach with an analysis of functional correlations has been applied previously to the ventral visual pathway (Turk-Browne et al. 2010; Zhen et al. 2013; Zhu et al. 2011) and other regions (Harmelech et al. 2013; Heinzle et al. 2012). In fact, this method was used by the first paper to report resting-state functional correlations (Biswal et al. 1995). However, no prior study has used this method to study the functional relationship between the language and MD systems. Specifically, whereas a few prior functional correlation studies did use functional localizers for defining either language (Makuuchi and Friederici 2013; Newman et al. 2013) or MD (Dosenbach et al. 2007; Seeley et al. 2007) regions, most of these studies used group-level analyses of the localizer data (or coordinates from prior studies, cf. Turken and Dronkers 2011), again with the potential shortcomings described above. The few studies that did define candidate language regions in individual subjects (Hampson et al. 2002; Morgan et al. 2009) have focused on small subsets of the language network rather than providing wide coverage of ROIs.
The current study therefore provides new support for the hypothesis that the language and MD systems are dissociable from each other and are recruited for distinct cognitive processes. Our findings complement prior evidence from neuroimaging studies that used standard functional contrasts (Fedorenko et al. 2011, 2012; Monti and Osherson 2012; Monti et al. 2009, 2012), as well as evidence from double dissociations in the patient literature (Apperly et al. 2006; Bek et al. 2010; Broca 1861/2006; Butterworth 2000; Happé et al. 1999; Klessinger et al. 2007; Luria et al. 1965; Peretz and Coltheart 2003; Varley et al. 2005; Varley and Siegal 2000; Wernicke 1874/1969).
Remaining Questions
A crucial question for further investigation concerns the fine-grained functional organization within the language system and within the MD system. Although each system is highly integrated, as indexed by the strong correlations among its constituent regions found here, further functional subdivisions within each system are likely. Indeed, our clustering results already capture some possible subdivisions within each system, and some of these appear to correspond to those suggested in prior studies. Namely, within the MD system, our hierarchical clustering analyses revealed two subsets that may correspond to the previously identified fronto-parietal and “cingulo-opercular” networks (Dosenbach et al. 2006, 2007; Koechlin et al. 1999; Mantini et al. 2013; Nomura et al. 2010; Power et al. 2011). These two networks are hypothesized to be differently recruited to control task-relevant, cognitive strategies [for a review, see Power and Petersen (2013)]. Within the language system, our hierarchical clustering revealed frontal and temporal subsets in each hemisphere, consistent with previous results from both aphasic patients (Geschwind 1970; Gorno-Tempini et al. 2004) and fMRI studies (Hagoort 2003, 2005; Snijders et al. 2009; Tie et al. 2012). The current approach of combining functional correlation measures with functional localizers that target specific cognitive functions is likely to prove powerful in further elucidating these hypothesized subdivisions within the language and MD systems.
A second unanswered question concerns the neurobiological significance of functional correlations across brain regions. It has been suggested that these correlations may, in part, reflect: 1) anatomical connectivity (direct and indirect) and/or 2) history of coactivation (Deco and Corbetta 2011; Deco et al. 2010, 2013) [for reviews and additional accounts, see He et al. (2008); Keller et al. (2011); Matsui et al. (2011); Schölvinck et al. (2010); Shmuel and Leopold (2008)]. The extent to which the patterns of correlations reported here correspond to direct anatomical connections therefore remains to be discovered. Although evidence from diffusion imaging is generally consistent with resting functional correlation measures (Hermundstad et al. 2013), neither is a perfect measure of structural connectivity (Uğurbil et al. 2013), posing substantial challenges for a definitive answer to this question. Moreover, some functional correlations are critically task dependent (Hermundstad et al. 2013). Thus although the functional dissociation between the language and MD systems generalized across resting state and story comprehension, it is possible that this dissociation would be modulated under other cognitive states.
Third, although our data indicate that the language and MD regions are independently recruited during cognitive processing, this conclusion need not imply that the two systems can never be engaged simultaneously. Indeed, many previous fMRI studies have reported activations in MD regions during some language-processing tasks, especially when such processing is effortful (January et al. 2009; Kuperberg et al. 2003; McMillan et al. 2012, 2013; Meltzer et al. 2010; Nieuwland et al. 2012; Novais-Santos et al. 2007; Rodd et al. 2005; Wild et al. 2012). These findings suggest that the domain-general, cognitive-control mechanisms associated with the MD system may play a role in language processing [E. Fedorenko, unpublished observations; Fedorenko and Thompson-Schill (2014)] and hence, that the MD and language systems may coactivate in some circumstances. Interactions between these two systems, however, may be more pronounced on a fast millisecond-level time scale and therefore, may not be detectable in the BOLD signal fluctuations measured here, given the low temporal resolution of this signal. Thus an important question for future research concerns the frequency, nature, and functional importance of interactions and coactivations of the language and MD systems.
Conclusions
Our results support a functional dissociation between the language and MD systems: each system is strongly correlated within itself, but pairs of regions straddling the two systems show weak (or negative) correlations. The robustness of this dissociation across conditions and analyses suggests that it reflects a deep principle of the functional organization of the human brain. Thus the current data help resolve the controversy in the prior neuroimaging literature (Blumstein and Amso 2013; Thompson-Schill et al. 2005) in favor of the hypothesis that at least some of the neural mechanisms used for high-level language processing are distinct from those that support other cognitive functions.
GRANTS
Support for this research was provided by the following funding sources: grant EY13455 to N. Kanwisher, a grant from the Ellison Medical Foundation to N. Kanwisher, a seed grant from the Simons Center for the Social Brain to N. Kanwisher, and Eunice Kennedy Shriver National Institute of Child Health and Human Development Award K99 HD-057522 to E. Fedorenko.
DISCLOSURES
No conflicts of interest, financial or otherwise, are declared by the authors.
AUTHOR CONTRIBUTIONS
Author contributions: N.K. and E.F. conception and design of research; E.F. performed experiments; I.B. and E.F. analyzed data; I.B., N.K., and E.F. interpreted results of experiments; I.B. prepared figures; I.B. drafted manuscript; I.B., N.K., and E.F. edited and revised manuscript; I.B., N.K., and E.F. approved final version of manuscript.
ACKNOWLEDGMENTS
The authors thank Susan Whitfield-Gabrieli for valuable advice on connectivity analysis in the CONN toolbox and Terri Lynn Scott for generating fROIs in native functional space. The authors are also grateful to Anastasia Vishnevetsky, Steve Piantadosi, and Ted Gibson for help in constructing and recording the materials for the story-comprehension task and to Eyal Dechter and Alex Kell for help with the script for the stories experiment. For technical support during scanning, the authors thank Christina Triantafyllou, Steve Shannon, and Sheeba Arnold. We also acknowledge the Athinoula A. Martinos Imaging Center at the McGovern Institute for Brain Research, MIT.
REFERENCES
- Amunts K, Schleicher A, Bürgel U, Mohlberg H, Uylings H, Zilles K. Broca's region revisited: cytoarchitecture and intersubject variability. J Comp Neurol 412: 319–341, 1999 [DOI] [PubMed] [Google Scholar]
- Apperly IA, Samson D, Carroll N, Hussain S, Humphreys G. Intact first- and second-order false belief reasoning in a patient with severely impaired grammar. Soc Neurosci 1: 334–348, 2006 [DOI] [PubMed] [Google Scholar]
- Bassett DS, Porter MA, Wymbs NF, Grafton ST, Carlson JM, Mucha PJ. Robust detection of dynamic community structure in networks. Chaos 23: 013142, 2013 [DOI] [PMC free article] [PubMed] [Google Scholar]
- Behzadi Y, Restom K, Liau J, Liu TT. A component based noise correction method (CompCor) for BOLD and perfusion based fMRI. Neuroimage 37: 90–101, 2007 [DOI] [PMC free article] [PubMed] [Google Scholar]
- Bek J, Blades M, Siegal M, Varley RA. Language and spatial reorientation: evidence from severe aphasia. J Exp Psychol 36: 646, 2010 [DOI] [PubMed] [Google Scholar]
- Benjamini Y, Yekutieli D. The control of the false discovery rate in multiple testing under dependency. Ann Statist 29: 1165–1188, 2001 [Google Scholar]
- Biswal B, Zerrin Yetkin F, Haughton VM, Hyde JS. Functional connectivity in the motor cortex of resting human brain using echo-planar MRI. Magn Reson Med 34: 537–541, 1995 [DOI] [PubMed] [Google Scholar]
- Blumstein SE. Reflections on the cognitive neuroscience of language. In: The Cognitive Neurosciences, edited by Gazzaniga M. Cambridge, MA: MIT Press, 2009, p. 1235–1240 [Google Scholar]
- Blumstein SE, Amso D. Dynamic functional organization of language: insights from functional neuroimaging. Perspect Psychol Sci 8: 44–48, 2013 [DOI] [PMC free article] [PubMed] [Google Scholar]
- Braver TS, Reynolds JR, Donaldson DI. Neural mechanisms of transient and sustained cognitive control during task switching. Neuron 39: 713–726, 2003 [DOI] [PubMed] [Google Scholar]
- Broca P. Comments regarding the seat of the faculty of spoken language, followed by an observation of aphemia (loss of speech). In: Broca's Region, edited by Grodzinsky Y, Amunts K. New York: Oxford University Press, 1861/2006, p. 291–304 [Google Scholar]
- Butterworth B. The Mathematical Brain. London: Macmillan, 2000 [Google Scholar]
- Chiarello C. Parallel systems for processing language: hemispheric complementarity in the normal brain. In: Mind, Brain, and Language: Multidisciplinary Perspectives, edited by Banich M, Mack M. Oxon, UK: Psychology, 2003, p. 229–247 [Google Scholar]
- Cole MW, Schneider W. The cognitive control network: integrated cortical regions with dissociable functions. Neuroimage 37: 343–360, 2007 [DOI] [PubMed] [Google Scholar]
- Cordes D, Haughton VM, Arfanakis K, Carew JD, Turski PA, Moritz CH, Quigley MA, Meyerand ME. Frequencies contributing to functional connectivity in the cerebral cortex in “resting-state” data. Am J Neuroradiol 22: 1326–1333, 2001 [PMC free article] [PubMed] [Google Scholar]
- Cordes D, Haughton VM, Arfanakis K, Wendt GJ, Turski PA, Moritz CH, Quigley MA, Meyerand ME. Mapping functionally related regions of brain with functional connectivity MR imaging. Am J Neuroradiol 21: 1636–1644, 2000 [PMC free article] [PubMed] [Google Scholar]
- Damasio AR. Aphasia. N Engl J Med 326: 531–539, 1992 [DOI] [PubMed] [Google Scholar]
- Deco G, Corbetta M. The dynamical balance of the brain at rest. Neuroscientist 17: 107–123, 2011 [DOI] [PMC free article] [PubMed] [Google Scholar]
- Deco G, Jirsa VK, Mcintosh AR. Emerging concepts for the dynamical organization of resting-state activity in the brain. Nat Rev Neurosci 12: 43–56, 2010 [DOI] [PubMed] [Google Scholar]
- Deco G, Jirsa VK, Mcintosh AR. Resting brains never rest: computational insights into potential cognitive architectures. Trends Neurosci 36: 268–274, 2013 [DOI] [PubMed] [Google Scholar]
- Dehaene S, Spelke E, Pinel P, Stanescu R, Tsivkin S. Sources of mathematical thinking: behavioral and brain-imaging evidence. Science 284: 970–974, 1999 [DOI] [PubMed] [Google Scholar]
- Dosenbach NU, Fair DA, Cohen AL, Schlaggar BL, Petersen SE. A dual-networks architecture of top-down control. Trends Cogn Sci 12: 99–105, 2008 [DOI] [PMC free article] [PubMed] [Google Scholar]
- Dosenbach NU, Fair DA, Miezin FM, Cohen AL, Wenger KK, Dosenbach RA, Fox MD, Snyder AZ, Vincent JL, Raichle ME. Distinct brain networks for adaptive and stable task control in humans. Proc Natl Acad Sci USA 104: 11073–11078, 2007 [DOI] [PMC free article] [PubMed] [Google Scholar]
- Dosenbach NU, Visscher KM, Palmer ED, Miezin FM, Wenger KK, Kang HC, Burgund ED, Grimes AL, Schlaggar BL, Petersen SE. A core system for the implementation of task sets. Neuron 50: 799–812, 2006 [DOI] [PMC free article] [PubMed] [Google Scholar]
- Duncan J. The multiple-demand (MD) system of the primate brain: mental programs for intelligent behaviour. Trends Cogn Sci 14: 172–179, 2010 [DOI] [PubMed] [Google Scholar]
- Duncan J, Owen AM. Common regions of the human frontal lobe recruited by diverse cognitive demands. Trends Neurosci 23: 475–483, 2000 [DOI] [PubMed] [Google Scholar]
- Fedorenko E, Behr MK, Kanwisher N. Functional specificity for high-level linguistic processing in the human brain. Proc Natl Acad Sci USA 108: 16428–16433, 2011 [DOI] [PMC free article] [PubMed] [Google Scholar]
- Fedorenko E, Duncan J, Kanwisher N. Broad domain generality in focal regions of frontal and parietal cortex. Proc Natl Acad Sci USA 110: 16616–16621, 2013 [DOI] [PMC free article] [PubMed] [Google Scholar]
- Fedorenko E, Duncan J, Kanwisher N. Language-selective and domain-general regions lie side by side within Broca's area. Curr Biol 22: 2059–2062, 2012 [DOI] [PMC free article] [PubMed] [Google Scholar]
- Fedorenko E, Hsieh PJ, Nieto-Castañón A, Whitfield-Gabrieli S, Kanwisher N. New method for fMRI investigations of language: defining ROIs functionally in individual subjects. J Neurophysiol 104: 1177–1194, 2010 [DOI] [PMC free article] [PubMed] [Google Scholar]
- Fedorenko E, Nieto-Castanon A, Kanwisher N. Lexical and syntactic representations in the brain: an fMRI investigation with multi-voxel pattern analyses. Neuropsychologia 50: 499–513, 2012 [DOI] [PMC free article] [PubMed] [Google Scholar]
- Fedorenko E, Thompson-Schill SL. Reworking the language network. Trends Cogn Sci 18: 120–126, 2014 [DOI] [PMC free article] [PubMed] [Google Scholar]
- Frost MA, Goebel R. Measuring structural-functional correspondence: spatial variability of specialised brain regions after macro-anatomical alignment. Neuroimage 59: 1369–1381, 2012 [DOI] [PubMed] [Google Scholar]
- Geschwind N. The organization of language and the brain. Science 170: 940–944, 1970 [DOI] [PubMed] [Google Scholar]
- Gómez S, Jensen P, Arenas A. Analysis of community structure in networks of correlated data. Phys Rev E Stat Nonlin Soft Matter Phys 80: 016114, 2009 [DOI] [PubMed] [Google Scholar]
- Gorno-Tempini ML, Dronkers NF, Rankin KP, Ogar JM, Phengrasamy L, Rosen HJ, Johnson JK, Weiner MW, Miller BL. Cognition and anatomy in three variants of primary progressive aphasia. Ann Neurol 55: 335–346, 2004 [DOI] [PMC free article] [PubMed] [Google Scholar]
- Hagoort P. How the brain solves the binding problem for language: a neurocomputational model of syntactic processing. Neuroimage 20: S18–S29, 2003 [DOI] [PubMed] [Google Scholar]
- Hagoort P. On Broca, brain, and binding: a new framework. Trends Cogn Sci 9: 416–423, 2005 [DOI] [PubMed] [Google Scholar]
- Hampshire A, Highfield RR, Parkin BL, Owen AM. Fractionating human intelligence. Neuron 76: 1225–1237, 2012 [DOI] [PubMed] [Google Scholar]
- Hampson M, Peterson BS, Skudlarski P, Gatenby JC, Gore JC. Detection of functional connectivity using temporal correlations in MR images. Hum Brain Mapp 15: 247–262, 2002 [DOI] [PMC free article] [PubMed] [Google Scholar]
- Happé F, Brownell H, Winner E. Acquired ‘theory of mind’ impairments following stroke. Cognition 70: 211–240, 1999 [DOI] [PubMed] [Google Scholar]
- Harmelech T, Preminger S, Wertman E, Malach R. The day-after effect: long term, Hebbian-like restructuring of resting-state fMRI patterns induced by a single epoch of cortical activation. J Neurosci 33: 9488–9497, 2013 [DOI] [PMC free article] [PubMed] [Google Scholar]
- Hartigan JA. Clustering Algorithms. New York: John Wiley & Sons, 1975 [Google Scholar]
- He BJ, Snyder AZ, Zempel JM, Smyth MD, Raichle ME. Electrophysiological correlates of the brain's intrinsic large-scale functional architecture. Proc Natl Acad Sci USA 105: 16039–16044, 2008 [DOI] [PMC free article] [PubMed] [Google Scholar]
- Hein G, Knight RT. Superior temporal sulcus—it's my area: or is it? J Cogn Neurosci 20: 2125–2136, 2008 [DOI] [PubMed] [Google Scholar]
- Heinzle J, Wenzel MA, Haynes JD. Visuomotor functional network topology predicts upcoming tasks. J Neurosci 32: 9960–9968, 2012 [DOI] [PMC free article] [PubMed] [Google Scholar]
- Hermundstad AM, Bassett DS, Brown KS, Aminoff EM, Clewett D, Freeman S, Frithsen A, Johnson A, Tipper CM, Miller MB. Structural foundations of resting-state and task-based functional connectivity in the human brain. Proc Natl Acad Sci USA 110: 6169–6174, 2013 [DOI] [PMC free article] [PubMed] [Google Scholar]
- January D, Trueswell JC, Thompson-Schill SL. Co-localization of stroop and syntactic ambiguity resolution in Broca's area: implications for the neural basis of sentence processing. J Cogn Neurosci 21: 2434–2444, 2009 [DOI] [PMC free article] [PubMed] [Google Scholar]
- Jenkinson M, Bannister P, Brady M, Smith S. Improved optimization for the robust and accurate linear registration and motion correction of brain images. Neuroimage 17: 825–841, 2002 [DOI] [PubMed] [Google Scholar]
- Juch H, Zimine I, Seghier ML, Lazeyras F, Fasel JH. Anatomical variability of the lateral frontal lobe surface: implication for intersubject variability in language neuroimaging. Neuroimage 24: 504–514, 2005 [DOI] [PubMed] [Google Scholar]
- Julian J, Fedorenko E, Webster J, Kanwisher N. An algorithmic method for functionally defining regions of interest in the ventral visual pathway. Neuroimage 60: 2357–2364, 2012 [DOI] [PubMed] [Google Scholar]
- Jung-Beeman M. Bilateral brain processes for comprehending natural language. Trends Cogn Sci 9: 512–518, 2005 [DOI] [PubMed] [Google Scholar]
- Kaan E, Swaab TY. The brain circuitry of syntactic comprehension. Trends Cogn Sci 6: 350–356, 2002 [DOI] [PubMed] [Google Scholar]
- Keller CJ, Bickel S, Entz L, Ulbert I, Milham MP, Kelly C, Mehta AD. Intrinsic functional architecture predicts electrically evoked responses in the human brain. Proc Natl Acad Sci USA 108: 10308–10313, 2011 [DOI] [PMC free article] [PubMed] [Google Scholar]
- Klessinger N, Szczerbinski M, Varley RA. Algebra in a man with severe aphasia. Neuropsychologia 45: 1642–1648, 2007 [DOI] [PubMed] [Google Scholar]
- Koechlin E, Basso G, Pietrini P, Panzer S, Grafman J. The role of the anterior prefrontal cortex in human cognition. Nature 399: 148–151, 1999 [DOI] [PubMed] [Google Scholar]
- Koechlin E, Jubault T. Broca's area and the hierarchical organization of human behavior. Neuron 50: 963–974, 2006 [DOI] [PubMed] [Google Scholar]
- Koelsch S, Gunter TC, Zysset S, Lohmann G, Friederici AD. Bach speaks: a cortical “language-network” serves the processing of music. Neuroimage 17: 956–966, 2002 [PubMed] [Google Scholar]
- Kuperberg GR, Holcomb PJ, Sitnikova T, Greve D, Dale AM, Caplan D. Distinct patterns of neural modulation during the processing of conceptual and syntactic anomalies. J Cogn Neurosci 15: 272–293, 2003 [DOI] [PubMed] [Google Scholar]
- Lancichinetti A, Fortunato S. Consensus clustering in complex networks. Sci Rep 2: 336, 2012 [DOI] [PMC free article] [PubMed] [Google Scholar]
- Lee MH, Hacker CD, Snyder AZ, Corbetta M, Zhang D, Leuthardt EC, Shimony JS. Clustering of resting state networks. PloS One 7: e40370, 2012 [DOI] [PMC free article] [PubMed] [Google Scholar]
- Lemieux L, Salek-Haddadi A, Lund TE, Laufs H, Carmichael D. Modelling large motion events in fMRI studies of patients with epilepsy. Magn Reson Imaging 25: 894–901, 2007 [DOI] [PubMed] [Google Scholar]
- Luria AR, Tsvetkova LS, Futer D. Aphasia in a composer. J Neurol Sci 2: 288–292, 1965 [DOI] [PubMed] [Google Scholar]
- Maess B, Koelsch S, Gunter TC, Friederici AD. Musical syntax is processed in Broca's area: an MEG study. Nat Neurosci 4: 540–545, 2001 [DOI] [PubMed] [Google Scholar]
- Makuuchi M, Friederici AD. Hierarchical functional connectivity between the core language system and the working memory system. Cortex 49: 2416–2423, 2013 [DOI] [PubMed] [Google Scholar]
- Mantini D, Corbetta M, Romani GL, Orban GA, Vanduffel W. Evolutionarily novel functional networks in the human Brain? J Neurosci 33: 3259–3275, 2013 [DOI] [PMC free article] [PubMed] [Google Scholar]
- Matsui T, Tamura K, Koyano KW, Takeuchi D, Adachi Y, Osada T, Miyashita Y. Direct comparison of spontaneous functional connectivity and effective connectivity measured by intracortical microstimulation: an fMRI study in macaque monkeys. Cereb Cortex 21: 2348–2356, 2011 [DOI] [PubMed] [Google Scholar]
- McMillan CT, Clark R, Gunawardena D, Ryant N, Grossman M. fMRI evidence for strategic decision-making during resolution of pronoun reference. Neuropsychologia 50: 674–687, 2012 [DOI] [PMC free article] [PubMed] [Google Scholar]
- McMillan CT, Coleman D, Clark R, Liang TW, Gross RG, Grossman M. Converging evidence for the processing costs associated with ambiguous quantifier comprehension. Front Psychol 4: 153, 2013 [DOI] [PMC free article] [PubMed] [Google Scholar]
- Meltzer JA, Mcardle JJ, Schafer RJ, Braun AR. Neural aspects of sentence comprehension: syntactic complexity, reversibility, and reanalysis. Cereb Cortex 20: 1853–1864, 2010 [DOI] [PMC free article] [PubMed] [Google Scholar]
- Miller EK, Cohen JD. An integrative theory of prefrontal cortex function. Annu Rev Neurosci 24: 167–202, 2001 [DOI] [PubMed] [Google Scholar]
- Monti MM, Osherson DN. Logic, language and the brain. Brain Res 1428: 33–42, 2012 [DOI] [PubMed] [Google Scholar]
- Monti MM, Parsons LM, Osherson DN. The boundaries of language and thought in deductive inference. Proc Natl Acad Sci USA 106: 12554–12559, 2009 [DOI] [PMC free article] [PubMed] [Google Scholar]
- Monti MM, Parsons LM, Osherson DN. Thought beyond language neural dissociation of algebra and natural language. Psychol Sci 23: 914–922, 2012 [DOI] [PubMed] [Google Scholar]
- Morgan VL, Mishra A, Newton AT, Gore JC, Ding Z. Integrating functional and diffusion magnetic resonance imaging for analysis of structure-function relationship in the human language network. PloS One 4: e6660, 2009 [DOI] [PMC free article] [PubMed] [Google Scholar]
- Newman AJ, Kenny S, Saint-Aubin J, Klein RM. Can skilled readers perform a second task in parallel? A functional connectivity MRI study. Brain Lang 124: 84–95, 2013 [DOI] [PubMed] [Google Scholar]
- Newman ME, Girvan M. Finding and evaluating community structure in networks. Phys Review E Stat Nonlin Soft Matter Phys 69: 026113, 2004 [DOI] [PubMed] [Google Scholar]
- Nieuwland MS, Martin AE, Carreiras M. Brain regions that process case: evidence from basque. Hum Brain Mapp 33: 2509–2520, 2012 [DOI] [PMC free article] [PubMed] [Google Scholar]
- Nomura EM, Gratton C, Visser RM, Kayser A, Perez F, D'esposito M. Double dissociation of two cognitive control networks in patients with focal brain lesions. Proc Natl Acad Sci USA 107: 12017–12022, 2010 [DOI] [PMC free article] [PubMed] [Google Scholar]
- Novais-Santos S, Gee J, Shah M, Troiani V, Work M, Grossman M. Resolving sentence ambiguity with planning and working memory resources: evidence from fMRI. Neuroimage 37: 361–378, 2007 [DOI] [PubMed] [Google Scholar]
- Paus T, Tomaiuolo F, Otaky N, MacDonald D, Petrides M, Atlas J, Morris R, Evans AC. Human cingulate and paracingulate sulci: pattern, variability, asymmetry, and probabilistic map. Cereb Cortex 6: 207–214, 1996 [DOI] [PubMed] [Google Scholar]
- Peretz I, Coltheart M. Modularity of music processing. Nat Neurosci 6: 688–691, 2003 [DOI] [PubMed] [Google Scholar]
- Poldrack RA. Can cognitive processes be inferred from neuroimaging data? Trends Cogn Sci 10: 59–63, 2006 [DOI] [PubMed] [Google Scholar]
- Postelnicu G, Zollei L, Fischl B. Combined volumetric and surface registration. IEEE Trans Med Imaging 28: 508–522, 2009 [DOI] [PMC free article] [PubMed] [Google Scholar]
- Power JD, Barnes KA, Snyder AZ, Schlaggar BL, Petersen SE. Spurious but systematic correlations in functional connectivity MRI networks arise from subject motion. Neuroimage 59: 2142–2154, 2012 [DOI] [PMC free article] [PubMed] [Google Scholar]
- Power JD, Cohen AL, Nelson SM, Wig GS, Barnes KA, Church JA, Vogel AC, Laumann TO, Miezin FM, Schlaggar BL. Functional network organization of the human brain. Neuron 72: 665–678, 2011 [DOI] [PMC free article] [PubMed] [Google Scholar]
- Power JD, Petersen SE. Control-related systems in the human brain. Curr Opin Neurobiol 23: 223–228, 2013 [DOI] [PMC free article] [PubMed] [Google Scholar]
- Rodd JM, Davis MH, Johnsrude IS. The neural mechanisms of speech comprehension: fMRI studies of semantic ambiguity. Cereb Cortex 15: 1261–1269, 2005 [DOI] [PubMed] [Google Scholar]
- Satterthwaite TD, Elliott MA, Gerraty RT, Ruparel K, Loughead J, Calkins ME, Eickhoff SB, Hakonarson H, Gur RC, Gur RE. An improved framework for confound regression and filtering for control of motion artifact in the preprocessing of resting-state functional connectivity data. Neuroimage 64: 240–256, 2013 [DOI] [PMC free article] [PubMed] [Google Scholar]
- Satterthwaite TD, Wolf DH, Loughead J, Ruparel K, Elliott MA, Hakonarson H, Gur RC, Gur RE. Impact of in-scanner head motion on multiple measures of functional connectivity: relevance for studies of neurodevelopment in youth. Neuroimage 60: 623–632, 2012 [DOI] [PMC free article] [PubMed] [Google Scholar]
- Schölvinck ML, Maier A, Frank QY, Duyn JH, Leopold DA. Neural basis of global resting-state fMRI activity. Proc Natl Acad Sci USA 107: 10238–10243, 2010 [DOI] [PMC free article] [PubMed] [Google Scholar]
- Seeley WW, Menon V, Schatzberg AF, Keller J, Glover GH, Kenna H, Reiss AL, Greicius MD. Dissociable intrinsic connectivity networks for salience processing and executive control. J Neurosci 27: 2349–2356, 2007 [DOI] [PMC free article] [PubMed] [Google Scholar]
- Shmuel A, Leopold DA. Neuronal correlates of spontaneous fluctuations in fMRI signals in monkey visual cortex: implications for functional connectivity at rest. Hum Brain Mapp 29: 751–761, 2008 [DOI] [PMC free article] [PubMed] [Google Scholar]
- Silver NC, Dunlap WP. Averaging correlation coefficients: should Fisher's z transformation be used? J Appl Psychol 72: 146, 1987 [Google Scholar]
- Snijders TM, Vosse T, Kempen G, Van Berkum JJ, Petersson KM, Hagoort P. Retrieval and unification of syntactic structure in sentence comprehension: an fMRI study using word-category ambiguity. Cereb Cortex 19: 1493–1503, 2009 [DOI] [PubMed] [Google Scholar]
- Stanescu-Cosson R, Pinel P, Van De Moortele PF, Le Bihan D, Cohen L, Dehaene S. Understanding dissociations in dyscalculia A brain imaging study of the impact of number size on the cerebral networks for exact and approximate calculation. Brain 123: 2240–2255, 2000 [DOI] [PubMed] [Google Scholar]
- Tahmasebi AM, Davis MH, Wild CJ, Rodd JM, Hakyemez H, Abolmaesumi P, Johnsrude IS. Is the link between anatomical structure and function equally strong at all cognitive levels of processing? Cereb Cortex 22: 1593–1603, 2012 [DOI] [PubMed] [Google Scholar]
- Thesen S, Heid O, Mueller E, Schad LR. Prospective acquisition correction for head motion with image-based tracking for real-time fMRI. Magn Reson Med 44: 457–465, 2000 [DOI] [PubMed] [Google Scholar]
- Thompson-Schill SL, Bedny M, Goldberg RF. The frontal lobes and the regulation of mental activity. Curr Opin Neurobiol 15: 219–224, 2005 [DOI] [PubMed] [Google Scholar]
- Tie Y, Rigolo L, Norton IH, Huang RY, Wu W, Orringer D, Mukundan S, Golby AJ. Defining language networks from resting-state fMRI for surgical planning—a feasibility study. Hum Brain Mapp 35: 1018–1030, 2014 [DOI] [PMC free article] [PubMed] [Google Scholar]
- Tomaiuolo F, MacDonald J, Caramanos Z, Posner G, Chiavaras M, Evans AC, Petrides M. Morphology, morphometry and probability mapping of the pars opercularis of the inferior frontal gyrus: an in vivo MRI analysis. Eur J Neurosci 11: 3033–3046, 1999 [DOI] [PubMed] [Google Scholar]
- Turk-Browne NB, Norman-Haignere SV, McCarthy G. Face-specific resting functional connectivity between the fusiform gyrus and posterior superior temporal sulcus. Front Hum Neurosci 4: 176, 2010 [DOI] [PMC free article] [PubMed] [Google Scholar]
- Turken U, Dronkers NF. The neural architecture of the language comprehension network: converging evidence from lesion and connectivity analyses. Front Syst Neurosci 5: 1, 2011 [DOI] [PMC free article] [PubMed] [Google Scholar]
- Tzourio-Mazoyer N, Landeau B, Papathanassiou D, Crivello F, Etard O, Delcroix N, Mazoyer B, Joliot M. Automated anatomical labeling of activations in SPM using a macroscopic anatomical parcellation of the MNI MRI single-subject brain. Neuroimage 15: 273–289, 2002 [DOI] [PubMed] [Google Scholar]
- Uğurbil K, Xu J, Auerbach EJ, Moeller S, Vu A, Duarte-Carvajalino JM, Lenglet C, Wu X, Schmitter S, Van De Moortele PF, Strupp J, Sapiro G, De Martino F, Wang D, Harel N, Garwood M, Chen L, Feinberg DA, Smith SM, Miller KL, Sotiropoulos SN, Jbabdi S, Andersson JL, Behrens TE, Glasser MF, Van Essen DC, Yacoub E, WU-Minn HCP Consortium. Pushing spatial and temporal resolution for functional and diffusion MRI in the Human Connectome Project. Neuroimage 80: 80–104, 2013 [DOI] [PMC free article] [PubMed] [Google Scholar]
- Van Dijk KR, Hedden T, Venkataraman A, Evans KC, Lazar SW, Buckner RL. Intrinsic functional connectivity as a tool for human connectomics: theory, properties, and optimization. J Neurophysiol 103: 297, 2010 [DOI] [PMC free article] [PubMed] [Google Scholar]
- Varley RA, Klessinger NJ, Romanowski CA, Siegal M. Agrammatic but numerate. Proc Natl Acad Sci USA 102: 3519–3524, 2005 [DOI] [PMC free article] [PubMed] [Google Scholar]
- Varley RA, Siegal M. Evidence for cognition without grammar from causal reasoning and ‘theory of mind’ in an agrammatic aphasic patient. Curr Biol 10: 723–726, 2000 [DOI] [PubMed] [Google Scholar]
- Wernicke C. The symptom complex of aphasia: a psychological study on an anatomical basis. In: Boston Studies in the Philosophy of Science, edited by Cohen RS, Wartofsky MW. Dordrecht, Netherlands: D. Reidel, 1874/1969, p. 34–97 [Google Scholar]
- Whitfield-Gabrieli S, Nieto-Castanon A. Conn: a functional connectivity toolbox for correlated and anticorrelated brain networks. Brain Connect 2: 125–141, 2012 [DOI] [PubMed] [Google Scholar]
- Wild CJ, Yusuf A, Wilson DE, Peelle JE, Davis MH, Johnsrude IS. Effortful listening: the processing of degraded speech depends critically on attention. J Neurosci 32: 14010–14021, 2012 [DOI] [PMC free article] [PubMed] [Google Scholar]
- Yeo BT, Krienen FM, Sepulcre J, Sabuncu MR, Lashkari D, Hollinshead M, Roffman JL, Smoller JW, Zöllei L, Polimeni JR. The organization of the human cerebral cortex estimated by intrinsic functional connectivity. J Neurophysiol 106: 1125–1165, 2011 [DOI] [PMC free article] [PubMed] [Google Scholar]
- Yue Q, Zhang L, Xu G, Shu H, Li P. Task-modulated activation and functional connectivity of the temporal and frontal areas during speech comprehension. Neuroscience 237: 87–95, 2013 [DOI] [PubMed] [Google Scholar]
- Zhen Z, Fang H, Liu J. The hierarchical brain network for face recognition. PloS One 8: e59886, 2013 [DOI] [PMC free article] [PubMed] [Google Scholar]
- Zhu Q, Zhang J, Luo YL, Dilks DD, Liu J. Resting-state neural activity across face-selective cortical regions is behaviorally relevant. J Neurosci 31: 10323–10330, 2011 [DOI] [PMC free article] [PubMed] [Google Scholar]