Abstract
Design
ACCORD is a parallel group, randomized trial designed to investigate whether intensive glycemic therapy with a target HbA1c of <6.0% versus standard therapy with a target of 7.0 to 7.9% reduces cardiovascular disease (CVD) morbidity, mortality, and microvascular complications in participants with type 2 diabetes.
Methods
Volunteers with established type 2 diabetes, HbA1c levels ≥ 7.5% and CVD or two or more CVD risk factors were recruited at 77 clinical sites across the U.S. and Canada. Instructional materials, behavioral counseling, glucose-lowering medications and self-monitoring supplies were provided by the study. Therapeutic regimens were individualized on the basis of randomized assignment and response to therapy. This investigation examines the effect of treatment to glycemic goals on occurrence of microvascular diabetes complications. Prespecified composite outcomes were: 1) dialysis or renal transplantation, or serum creatinine >291.7 micromol/L, or retinal photocoagulation or vitrectomy, and 2) these plus peripheral neuropathy. Thirteen prespecified secondary measures of kidney, eye, and peripheral nerve function were also evaluated. Randomization was performed at clinical sites using a central randomization routine available on the study website. Both investigators and participants were unmasked to treatment arm assignment.
Results
A total of 10,251 participants were randomized (5,128 intensive and 5,123 standard) between January, 2001 and October, 2005. This analysis includes 10,234 patients (5,107 intensive and 5,108 standard). Intensive therapy was stopped before study end due to increased mortality, and patients were transitioned to standard therapy. Outcomes are reported at transition and at study end. At transition, the first composite outcome occurred in 443/5107 and 444/5108 participants in the intensive and standard arms, respectively (p= 0.99), and the second outcome in 1591/5107 and 1659/5108 participants in intensive and standard arms (p=0.20). Results were similar at study end. Secondary measures at study end favoring intensive therapy (p<0.05) included development of macroalbuminuria, cataract extraction, visual acuity, a score of >2.0 on the Michigan Neuropathy Screening Instrument, loss of ankle jerk and light touch.
Conclusions
Intensive glycemic treatment did not reduce the risk of advanced measures of microvascular outcomes, but delayed the onset of macroalbuminuria and some measures of eye complications and neuropathy. These benefits must be weighed against the increase in total and CVD-related mortality, increased weight gain, and higher risk for severe hypoglycemia.
Introduction
Epidemiologic studies in type 2 diabetes have shown that higher glucose levels, as determined by HbA1c, are associated with increased risk of diabetic retinopathy, nephropathy, and neuropathy.1-6 Several clinical trials aimed at reducing HbA1c have shown that intensive glycemic control in patients with type 2 diabetes is associated with a reduction in these ‘microvascular’ complications (mostly albuminuria).7-10 The glycemia portion of the Action to Control Cardiovascular Disease in Diabetes (ACCORD) trial was designed to study the effects of an intensive versus a standard treatment strategy for hyperglycemia on cardiovascular (CV) events in a large population of individuals with type 2 diabetes.11 In addition to the primary composite CV endpoint, ACCORD included predefined secondary endpoints to assess the impact of intensive therapy of glycemia on incidence and progression of retinopathy, nephropathy, and neuropathy.
ACCORD targeted near-normal levels of glycemia in a population with long duration type 2 diabetes (average ∼10 years) and established cardiovascular disease or high cardiovascular risk. The intensive strategy aimed to reduce HbA1c values to below 6.0%, while the standard strategy sought to keep HbA1c values between 7.0% and 7.9%, with an average of 7.5%.12 As previously reported13 the HbA1c achieved in the intensive strategy was much lower than that achieved in UKPDS7 and VADT,13 and similar to that in the ADVANCE trial9 which studied a population with shorter duration of diabetes. Likewise, the HbA1c in the standard treatment group was lower than that achieved in UKPDS and VADT, and similar to that in ADVANCE. For participants with surveillance for one or more microvascular outcomes, the intensive glycemia treatment strategy was stopped in February of 2008 after 3.7 (median) years of follow-up due to an increase of all-cause mortality.14 However, participants continued in the trial using the standard glycemia treatment strategy for the remainder of the planned 5.0 (median) years of follow-up ending June, 2009.
We report here the results of the predefined secondary microvascular outcomes both at the time of transition of participants in the intensive strategy to standard strategy and at the end of the full duration of the ACCORD trial. The effect of the glycemia treatment strategies on diabetic retinopathy assessed by fundus photography in a subset of participants is the protocol-defined main microvascular endpoint in ACCORD, and will be published separately.
Methods
Volunteers with established diagnosis of type 2 diabetes mellitus; HbA1c level of 7.5% or more; age between 40 and 79 years with history of cardiovascular disease or age between 55 and 79 years with anatomical evidence of significant atherosclerosis, albuminuria, left ventricular hypertrophy, or at least two risk factors for cardiovascular disease (dyslipidemia, hypertension, current status as a smoker, or obesity) were recruited. Key exclusion criteria included frequent or recent serious hypoglycemic events, unwillingness to do home glucose monitoring or inject insulin, body-mass index of more than 45 kg/m2, serum creatinine >132.6 micromol/L, or other serious illness. Participants were recruited at 77 clinical centers (aggregated within seven networks) across the United States and Canada. Ethics committees approved the protocol and the written informed consent forms.
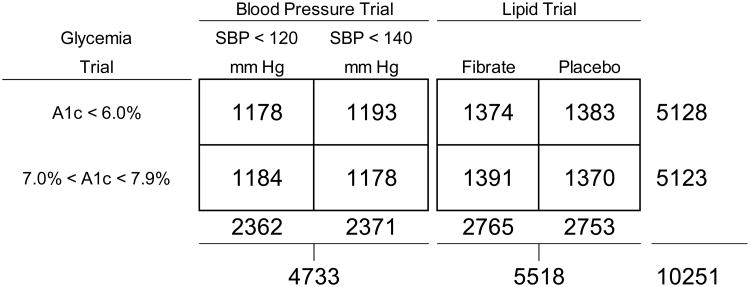
ACCORD is a double 2×2 factorial, parallel designed trial with all randomized participants assigned to one of two glycemia treatments, approximately 42% allocated to one of two blood pressure interventions, and the remaining 58% allocated to either fenofibrate or placebo as part of a lipid intervention (Figure 1). 10,251 were assigned to the intensive glycemia arm targeting a HbA1c of <6.0% or to the standard arm targeting a HbA1c level of 7.0 to 7.9%; 4733 (46%) were randomly assigned to either intensive blood pressure arm (systolic BP target <120 mm Hg) or standard arm (systolic BP target <140 mm Hg); and 5518 (54%) were randomly assigned to receive either fenofibrate or placebo while maintaining good control of LDL cholesterol with simvastatin. As part of their glycemic intervention, participants received instructional materials and behavioral counseling, and were provided with glucose-lowering medications and self-monitoring supplies. Participant-specific therapeutic regimens were individualized by study investigators (with participant feedback) on the basis of randomized assignment and the response to therapy. Adverse effects were carefully monitored both locally and centrally to ensure participant safety.12 The objective of this analysis is to examine the effect of the intensive glycemia treatment on of the occurrence of pre-specified microvascular complications.
Figure 1.
Distribution of randomisation assignment of participants to the ACCORD glycemia, blood pressure and lipid trials.
Prespecified microvascular outcomes consisted of measures of kidney function, diabetic eye complications, and peripheral neuropathy. Two composite outcomes were prespecified (Table 1): the first combined advanced kidney and eye disease and was intended to approximate the primary microvascular outcome of the UKPDS study;15 the second added peripheral neuropathy to that outcome. Table 1 also summarizes the pre-defined ACCORD microvascular outcomes and their frequency of assessment. As specified in the study protocol, the primary microvascular outcome for the ACCORD Trial was assessed in a subgroup of participants in the ACCORD Eye Study and will be published in a separate report. The primary microvascular outcome based on all ACCORD participants was pre-defined as the first composite endpoint (development of renal failure or retinal photocoagulation or vitrectomy to treat diabetic retinopathy) that is characterized as advanced microvascular disease. Individual components of the microvascular outcomes reported here were measured or assessed using standard procedures as described in the study Manual of Procedures; more details can be found in the Appendix.
Table 1.
Definition of ACCORD microvascular outcomes and their frequency of assessment.
| Outcome Category | Outcome | Definition | Assessment Frequency |
|---|---|---|---|
| Composites | Primary | Development of renal failure (initiation of dialysis or ESRD, renal transplantation, or rise of serum creatinine >291.72 micromol/l) or retinal photocoagulation or vitrectomy to treat retinopathy. | Every 4 months |
| Secondary | As in primary composite outcome and/or Score of >2.0 on the Michigan Neuropathy Screening Instrument (MNSI). | Every 4 months | |
| Nephropathy | Neph-1 | Development of microalbuminuria (defined as urine albumin/creatinine ratio ≥ 30 mg/g). | Annually |
| Neph-2 | Development of macroalbuminuria (defined as urine albumin/creatinine ratio ≥ 300 mg/g). | Annually | |
| Neph-3 | Development of renal failure (defined as initiation of dialysis or ESRD, or renal transplantation, or rise of serum creatinine >291.72 micromol/l in absence of an acute reversible cause). | Every 4 months | |
| Neph-4 | Doubling of baseline serum creatinine or more than 20 mL/min/1.73 m2 decrease in estimated GFR. (Estimated GFR is based on the 4-variable MDRD GFR equation of Levey et. al.) | Every 4 months | |
| Neph-5 | Development of any of the three conditions Neph-2, Neph-3, or Neph-4 above. | Every 4 months | |
| Diabetic eye complications | Eye-1 | Retinal photocoagulation or vitrectomy to treat retinopathy. | Annually |
| Eye-2 | Eye surgery for cataract extraction. | Annually | |
| Eye-3 | Three-line change in visual acuity (as measured using Log MAR visual acuity chart). | Biannually | |
| Eye-4 | Severe vision loss (as measured by Snellen fraction <20/200). | Biannually | |
| Neuropathy | Neuro-1 | New score of >2.0 on the Michigan Neuropathy Screening Instrument (MNSI | Annually |
| Neuro-2 | New loss of vibratory sensation (tested using 128 Hz tuning fork). | Annually | |
| Neuro-3 | New loss of ankle jerk during Jendrassic maneuver. | Annually | |
| Neuro-4 | New loss of light touch (as measured by 10 gm force monofilament test). | Annually |
Randomization and Masking
The proposed sample size of 10,000 was designed to have 89% power to detect a 15% treatment effect of intensive glycemic control compared with standard glycemic control on the primary composite CVD outcome: death from cardiovascular causes, nonfatal myocardial infarction, or nonfatal stroke. Interim analyses of intervention effectiveness were performed for semi-annual meetings of the Data Safety and Monitoring Board (DSMB). Overall Type I error was controlled via the group sequential procedure of Lan and DeMets.16 Study investigators were masked to results of interim analyses.
Recruitment was performed in two stages: (1) the Vanguard Phase, which included recruitment from January, 2001 through May, 2001, and treatment and follow-up through February, 2003; and (2) the Main Trial Phase, which included recruitment of new participants from March, 2003 through October 2005, and treatment and follow-up of all participants (including Vanguard) through June, 2009. One thousand one hundred fourteen participants were randomized in the Vanguard with an additional 9067 randomized during the Main Trial. Vanguard period randomization was stratified by clinical center network and baseline CVD status (either primary or secondary prevention) using permuted blocks of size four, eight and 12. In the Main Trial randomization was stratified only by clinical site in order to improve balance within the 77 clinical sites using the same block sizes. Because of the greater refinement in stratification during the Main Trial, baseline CVD status was dropped as a stratification factor.
Unique randomization sequences were generated for each clinical site centrally at the coordinating centre. Randomization was performed by clinic staff via secure access to the ACCORD study web site. Electronic verification of inclusion/exclusion criteria was performed prior to treatment arm assignment. Glycemia trial treatment assignment was open label, with both the clinic staff and participant unmasked to glycemic goal assigned.
Statistical Methods
Participant characteristics (medians and inner-quartile [I-Q] ranges) of continuous factors; frequencies and relative frequencies of categorical factors) at baseline were calculated by glycemia intervention group assignment. Descriptive statistics of a subset of continuous factors related to treatment in each trial were calculated by glycemia treatment arm at the date of transition from intensive to standard therapy for the glycemia trial and again at study end. Differences in these factors were assessed using the Wilcoxon signed-rank test.
Occurrence of microvascular events was determined for each pre-defined outcome listed in Table 1. For each participant and outcome, the observation was censored at the last surveillance time if no event was discovered. If an event was discovered, an event time was assigned using the midpoint between the time of event discovery and the most recent prior surveillance time.17 Two sets of analyses were performed. The first included outcomes assessed prior to the transition (February 5, 2008), and the second included all outcomes assessed through the last study visit (March through June, 2009).
The effect of glycemia treatment arm assignment on time to occurrence of the first microvascular event of each type was analyzed using proportional hazards regression models to estimate hazard ratios and assess statistical significance. Graphical depiction of time to event was performed using Kaplan-Meier plots. The primary statistical test for each outcome was taken from a model that included glycemia treatment arm assignment, second trial treatment arm assignment (intensive or standard BP management in the blood pressure trial, or fenofibrate or placebo assignment in the lipid trial), and an indicator of history of clinical cardiovascular disease at baseline as prespecified in the study protocol. The proportional hazards assumption was assessed by examination of log(-log(survival)) plots. Those plots did not indicate that the assumption of proportional hazards was untenable.
All analyses were performed using intention-to-treat where participants were analyzed based on treatment arm assignment regardless of treatments received or compliance to therapies. No p-value correction was applied to account for multiple hypothesis tests;18 Analyses were performed using SAS® version 9.2 software (SAS Institute, Inc., Cary, NC). Outcomes presented in this manuscript were pre-specified and future analyses will be performed to address post hoc hypotheses.
Role of funding source
Staff from the NHLBI, the sponsor of ACCORD, served on the Executive and Steering Committees where decisions on study design, intervention approaches, data collection, analysis, interpretation, and review of reports were made.
Results
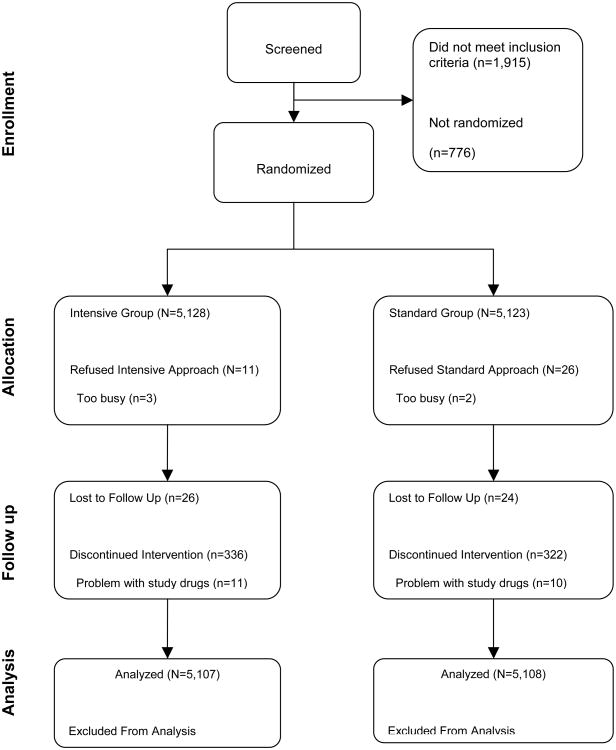
Figure 2 shows a breakdown of participant flow through the screening and randomization process. Participants recruited to the ACCORD trial had a median age of 62 and inner-quartile range of 10 years, and had type 2 diabetes for ∼10 years; selected covariates and components of microvascular outcomes at baseline are shown in Table 2. When the ACCORD intensive glycemia strategy was discontinued, there were significant (P<.0001) differences between the two glycemia arms with respect to the HbA1c of (median [inner-quartile range]) 6.3 (1.1)% in the intensive glycemia group and 7.6 (1.2) % in the standard glycemia group (Table 3). At study end, there persisted a significantly lower HbA1c in the previous intensively managed participants (HbA1c 72 [1.3]%) compared to participants in the standard arm (HbA1c 7.6 [1.3] %) (p <0.0001). Systolic and diastolic blood pressures were slightly lower in the intensive glycemia group at the time of transition, and both were slightly higher in the intensive arm at study end (Table 3). HDL levels were slightly higher in both men and women in the intensive arm at transition. Triglyceride level was 0.16 mmol/L lower in the intensive compared to standard glycemia group at transition; a smaller difference persisted at study end. As reported previously,14 the intensive therapy group had a significantly higher BMI at transition compared to the standard group, and a smaller difference in BMI was maintained at study end. Serum creatinines were not different between the two groups at transition or at study end. Median urine albumin-creatinine ratio was lower in the intensive arm at both transition and study end (Table 3).
Figure 2.
CONSORT diagram depicting flow of participants through screening and randomisation in ACCORD trial.
Table 2.
Selected covariates and components of microvascular outcomes at baseline, by glycemia trial arm assignment.
| Parameter | N | Standard Glycemia Median (I-Q Range) | N | Intensive Glycemia Median (I-Q Range) | |
|---|---|---|---|---|---|
| Continuous Factors | HbA1c (%) | 5111 | 8.1 (1.3) | 5101 | 8.1 (1.3) |
| Fasting serum glucose (mmol/l) | 5090 | 9.27 (3.66) | 5080 | 9.33 (3.61) | |
| SBP (mmHg) | 5094 | 135 (22) | 5095 | 135 (22) | |
| DBP (mmHg) | 5094 | 75 (14) | 5095 | 75 (14) | |
| LDL cholesterol (mmol/l) | 5093 | 2.61 (1.14) | 5082 | 2.59 (1.14) | |
| HDL cholesterol in women (mmol/l) | 1969 | 1.16 (0.41) | 1953 | 1.16 (0.39) | |
| HDL cholesterol in men (mmol/l) | 3124 | 0.96 (0.28) | 3129 | 0.96 (0.31) | |
| Triglycerides (mmol/l) | 5093 | 1.76 (1.41) | 5082 | 1.74 (1.33) | |
| BMI (kg/m2) | 5116 | 31.9 (7.7) | 5112 | 31.7 (12.0) | |
| Serum creatinine (micromol/l) | 5081 | 79,6 (17.7) | 5093 | 79.6 (17.7) | |
| eGFR (mL/min/1.73m2) | 5081 | 90 (30) | 5093 | 90 (29) | |
| Urine albumin-creatinine ratio (mg/g) | 5071 | 13.6 (37.3) | 5083 | 13.6 (37.5) | |
| Average right/left eye visual acuity score | 4908 | 77 (13) | 4874 | 77 (13) | |
| Average right/left eye Snellen fraction | 4961 | 32 (17) | 4933 | 32 (19) | |
| MNSI Score | 4990 | 2.0 (2.5) | 4997 | 2.0 (2.5) 0 | |
|
| |||||
| N | Frequency (%) | N | Frequency (%) | ||
|
| |||||
| Categorical Factors | Macroalbuminuria | 5071 | 327 (6) | 5083 | 339 (7) |
| Microalbuminuria | 4732 | 1264 (27) | 4756 | 1241 (26) | |
| History of photocoagulation or vitrectomy | 5090 | 428 (8) | 5106 | 466 (9) | |
| History of cataract removal | 5091 | 574 (11) | 5107 | 576 (11) | |
| Number of eyes with blindness | 5014 | 5023 | |||
| One | 129 (3) | 139 (3) | |||
| Two | 15 (0) | 16 (0) | |||
| MNSI score >2.0 | 5095 | 2160 (42) | 5106 | 2185 (43) | |
| Vibratory sensation loss | 5070 | 683 (13) | 5076 | 694 (14) | |
| Ankle jerk loss | 5049 | 1599 (32) | 5053 | 1648 (33) | |
| Loss of light touch | 5075 | 300 (6) | 5081 | 330 (7) | |
Table 3.
Descriptive statistics of parameters related to study interventions at transition of all participants to standard glycemic therapy and at end of the Main Trial, by glycemia treatment arm assignment.
| Time of measurement | Parameter | Intensive Glycemia | Standard Glycemia | P-val | ||
|---|---|---|---|---|---|---|
| N | Median (I-Q Range) | N | Median (I-Q Range) | |||
| At transition to standard therapy (February 2008)* | HbA1c (%) | 4517 | 6.3 (1.1) | 4577 | 7.6 (1.2) | <0.0001 |
| Fasting serum glucose (mmol/l) | 4232 | 5.88 (2.39) | 4292 | 8.16 (3.28) | <0.0001 | |
| SBP (mmHg) | 4524 | 127 (22) | 4583 | 128 (23) | 0.0144 | |
| DBP (mmHg) | 4524 | 67 (14) | 4583 | 68 (14) | 0.0003 | |
| Total cholesterol (mmol/l) | 4245 | 4.03 (1.22) | 4316 | 4.09 (1.27) | 0.1206 | |
| LDL cholesterol (mmol/l) | 4244 | 2.17 (0.96) | 4315 | 2.15 (0.96) | 0.1955 | |
| HDL cholesterol in women (mmol/l) | 1634 | 1.22 (0.41) | 1633 | 1.19 (0.39) | 0.0050 | |
| HDL cholesterol in men (mmol/l) | 2610 | 1.01 (0.36) | 2682 | 0.98 (0.34) | 0.0014 | |
| Triglycerides (mmol/l) | 4245 | 1.43 (1.10) | 4316 | 1.59 (1.25) | <0.0001 | |
| BMI (kg/m2) | 3768 | 33 (8) | 3789 | 32 (8) | <0.0001 | |
| Serum creatinine (micromol/l) | 4395 | 87.5 (33.6) | 4466 | 87.5 (34.5) | 0.9612 | |
| Urine albumin:creatinine ratio (mg/g) | 4297 | 10.5 (24.6) | 4380 | 12.0 (33.4) | <0.0001 | |
|
| ||||||
| At End of study (Spring 2009) | HbA1c (%) | 4404 | 7.2 (1.3) | 4437 | 7.6 (1.3) | <0.0001 |
| Fasting serum glucose (mmol/l) | 4352 | 7.38 (3.00) | 4385 | 8.22 (3.33) | <0.0001 | |
| SBP (mmHg) | 4417 | 128 (22) | 4444 | 128 (21) | 0.0554 | |
| DBP (mmHg) | 4417 | 68 (14) | 4444 | 67 (13) | 0.0070 | |
| Total cholesterol (mmol/l) | 4355 | 4.01 (1.27) | 4390 | 4.06 (1.27) | 0.2613 | |
| LDL cholesterol (mmol/l) | 4355 | 2.09 (1.01) | 4390 | 2.12 (0.98) | 0.8305 | |
| HDL cholesterol in women (mmol/l) | 1674 | 1.24 (0.44) | 1676 | 1.22 (0.41) | 0.2820 | |
| HDL cholesterol in men (mmol/l) | 2681 | 1.01 (0.34) | 2714 | 1.01 (0.34) | 0.6150 | |
| Triglycerides (mmol/l) | 4355 | 1.48 (1.13) | 4390 | 1.52 (1.15) | 0.0003 | |
| BMI (kg/m2) | 4061 | 33 (8) | 4067 | 32 (8) | <0.0001 | |
| Serum creatinine (micromol/l) | 4381 | 86.6 (34.5) | 4420 | 87.5 (37.1) | 0.1950 | |
| Urine albumin:creatinine ratio (mg/g) | 4176 | 12.7 (39.6) | 4244 | 14.4 (49.3) | <0.0001 | |
Data limited to measurements within 1 year of date of transition with exception of urine albumin/creatinine ratio, which is within two years of transition.
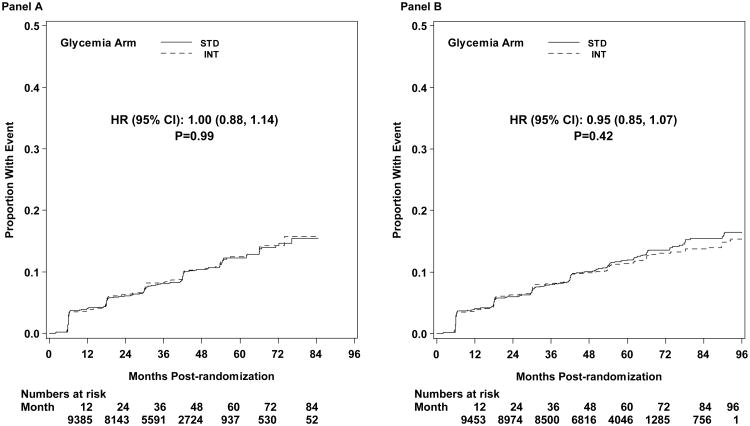
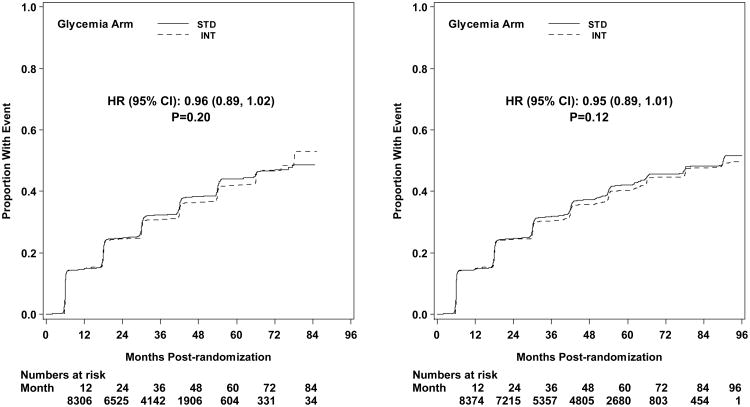
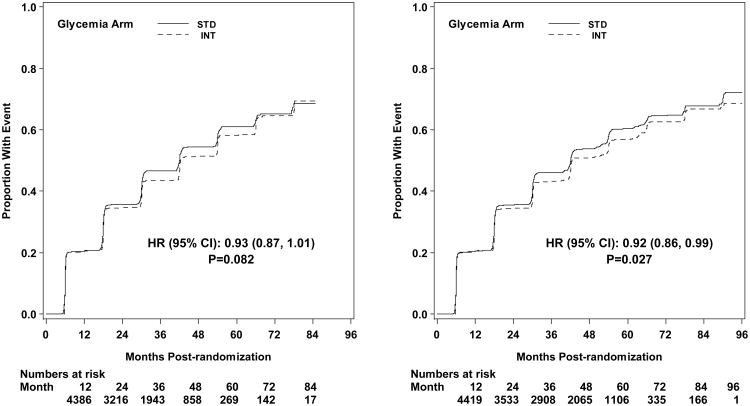
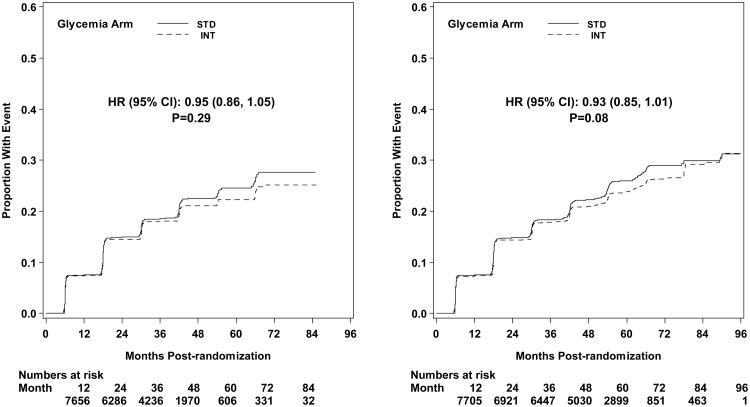
The first pre-specified microvascular composite outcome combining advanced nephropathy and diabetic eye complications was not different between the groups at transition occurring in 444 and 443 participants in the intensive and standard arms, respectively (p= 0.997) (Figures 3 and 4). There was also no difference in this measure at study end (Figure 5). The second composite endpoint, which also included a peripheral neuropathy outcome, showed no significant difference at transition (p=0.195), or at study end (Figures 4 and 5, respectively).
Figure 3.
Kaplan-Meier curves for the microvascular primary composite outcome (development of renal failure or retinal photocoagulation or vitrectomy to treat retinopathy) by glycemia arm. Panel A: data until transition of intensive glycemia arm to standard therapy. Panel B: all data through end of study. Hazard ratios adjusted for baseline history of clinical cardiovascular disease and second trial treatment arm assignment.
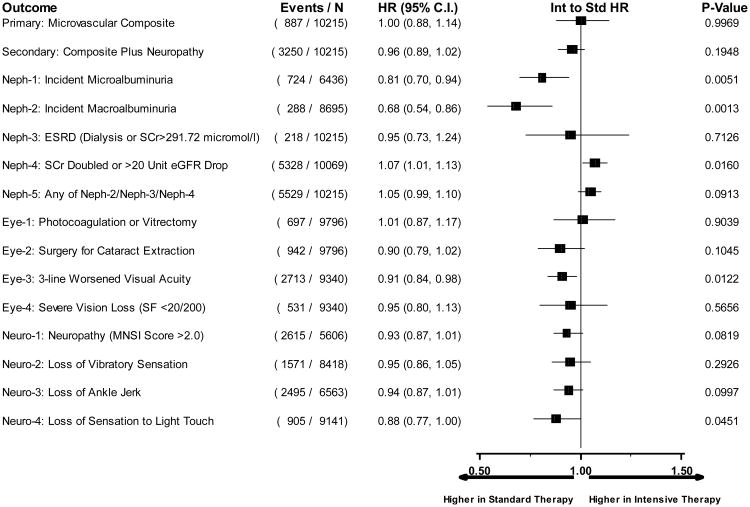
Figure 4.
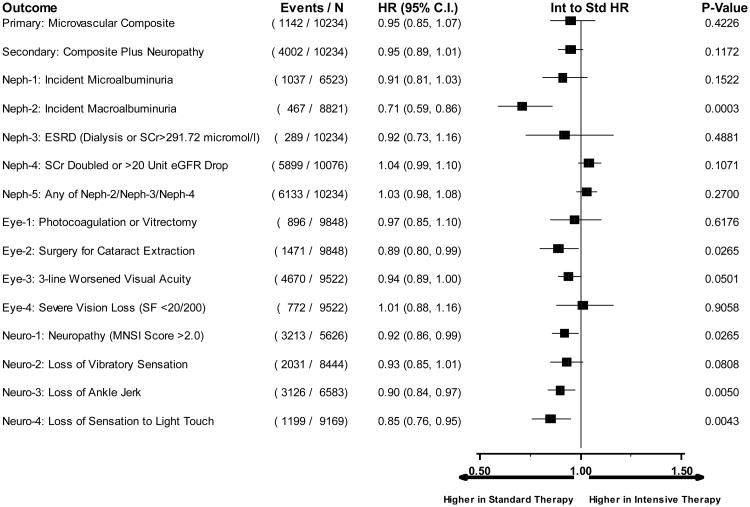
Hazard ratios comparing intensive to standard glycemia arm assignment for each microvascular outcome utilizing data until transition of intensive glycemia arm to standard therapy. Hazard ratios adjusted for baseline clinical cardiovascular disease history and second trial treatment arm assignment. Horizontal bars represent 95% confidence intervals.
Figure 5.
Hazard ratios comparing intensive to standard glycemia arm assignment for each microvascular outcome utilizing data through end of study. Hazard ratios adjusted for baseline history of clinical cardiovascular disease and second trial treatment arm assignment. Horizontal bars represent 95% confidence intervals.
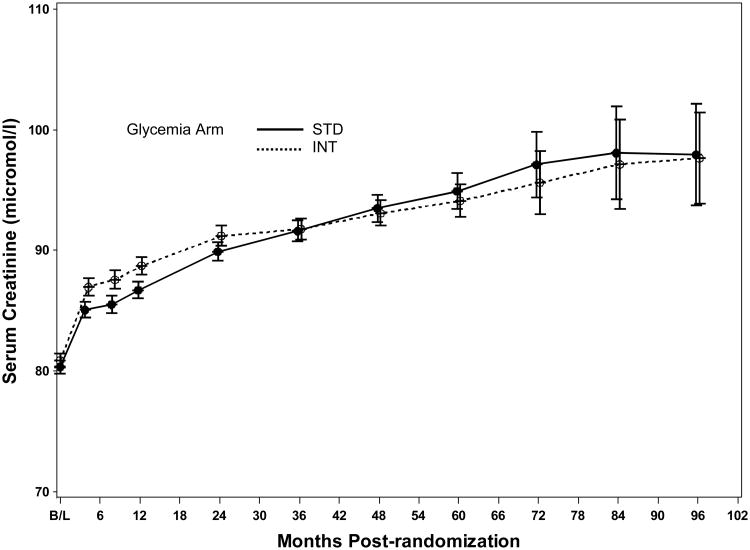
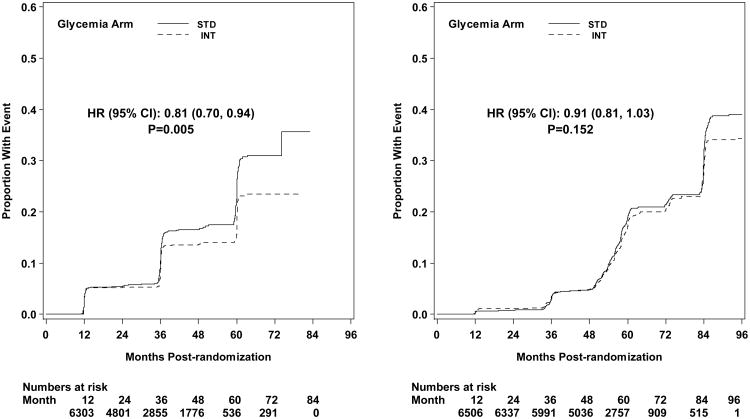
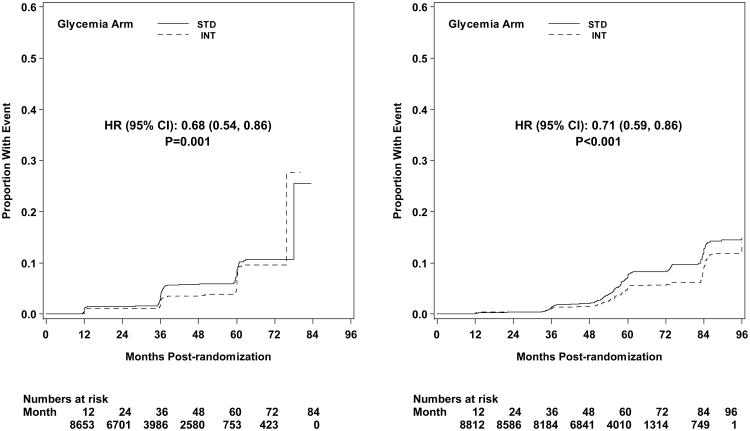
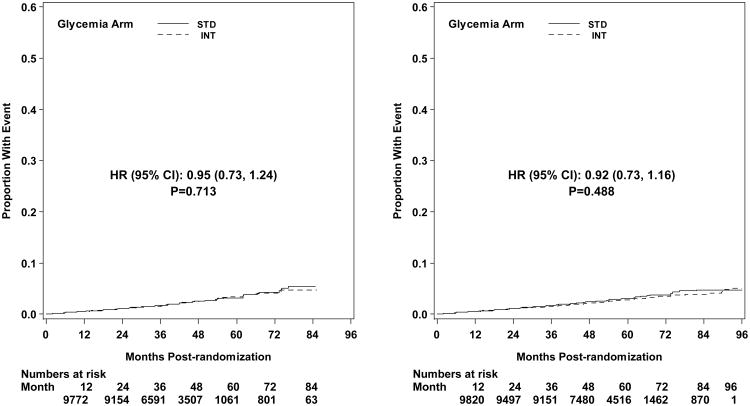
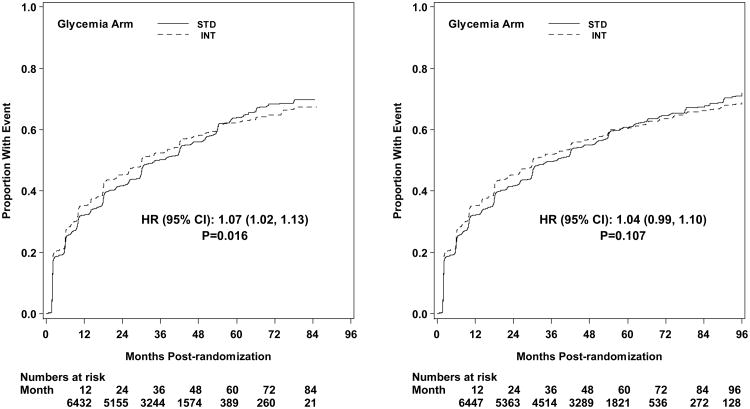
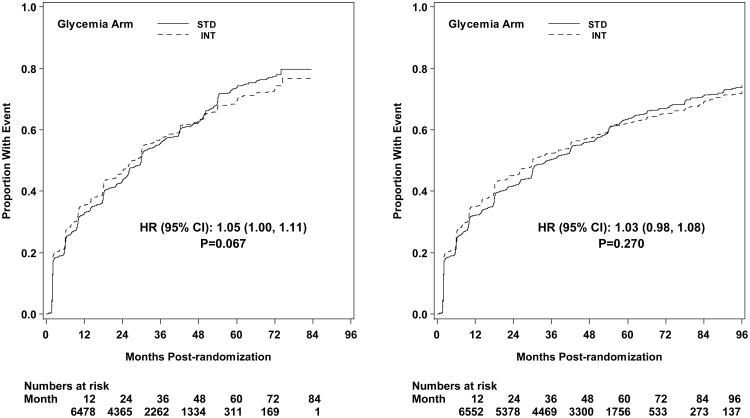
Microvascular renal outcomes based on urinary parameters demonstrated a significant reduction in the intensive glycemia arm. Development of micro-albuminuria was reduced in the intensive compared to standard group at transition (HR = 0.81, CI 0.70-0.94; p = 0.005; NNT = 44), but the difference was no longer significant at study end (Figures 4 and 5). The development of macro-albuminuria was lower in the intensive group (HR = 0.68, CI 0.54-0.86; p = 0.001; NNT = 82), and the effect persisted at study end (HR = 0.71, CI 0.59-0.86; p <0.001; NNT = 58). Development of overt renal failure (need for dialysis, renal transplantation, or sustained increase of serum creatinine above 291.7 micromol/L) was similar in both groups at study end (696/4915 participants in the intensive and 775/4933 in the standard group (HR 0.95, p = 0.713). In contrast there was a significant difference at transition between the groups in the microvascular renal outcome based on serum creatinine or estimated GFR (eGFR) favoring the standard glycemia group (HR = 1.07, CI 1.01-1.16; p = 0.016; NNT = -69); the finding was not significant at study end. The difference between treatment arms in this renal outcome was essentially attributable to a decline in eGFR in the intensive arm during the first 24 months, perhaps reflecting a presumed decrease in glomerular hyperfilteration associated with improved glycemic control (Figure 6); serum creatinine and eGFR remained within the normal range. A composite of pre-specified renal outcome, not including the development of microalbuminuria, was not different between groups at transition (HR=1.05, 1.00-1.10; p = 0.091) or study end. At study end, all microvascular renal outcomes became similar in both groups, with the exception of macroalbuminuria, noted above (Figure 5).
Figure 6.
Mean serum creatinine levels ± two standard errors of the mean by glycemia treatment arm and follow-up visit.
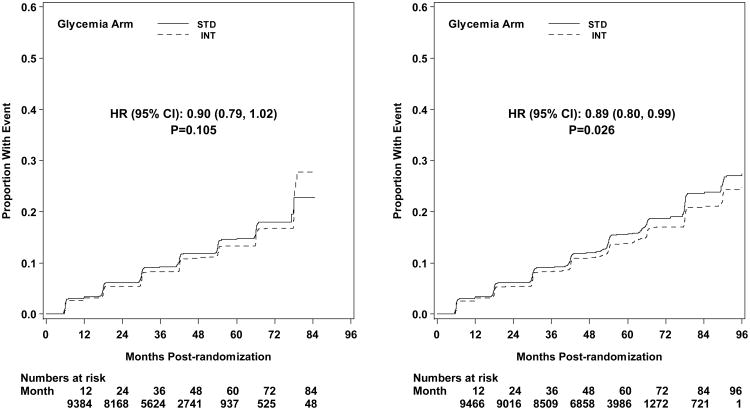
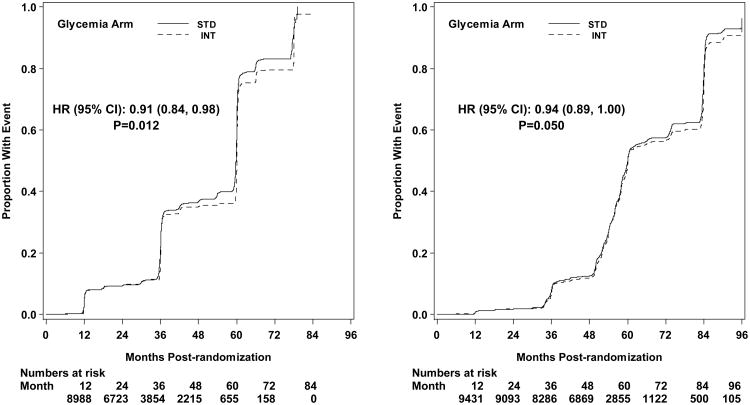
Diabetic eye outcomes were significantly reduced by intensive glycemia intervention as compared to standard therapy for three-line change in visual acuity at transition (HR 0.91, CI 0.84-0.98; p=0.012; NNT = 87) and at the end of the study (HR 0.94, CI 0.89-1.00; p=0.05; NNT = 56) (Figures 4 and 5). Cataract extraction was also significantly reduced in the intensive compared to standard group at study end (HR = 0.89, CI 0.80-0.99; p=0.026; NNT = 65). Other diabetes-related eye outcomes were not significantly different between the two groups.
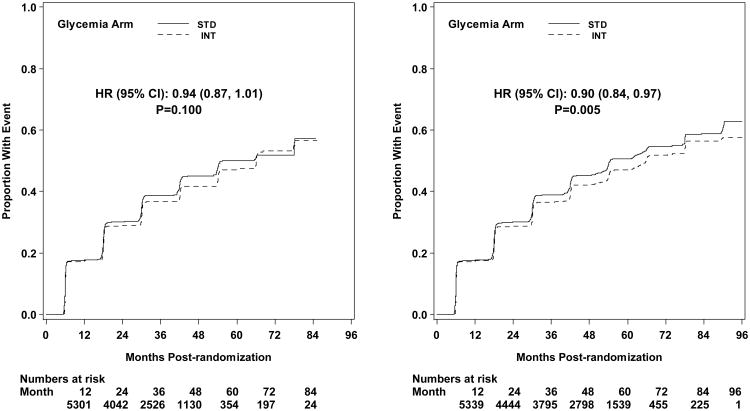
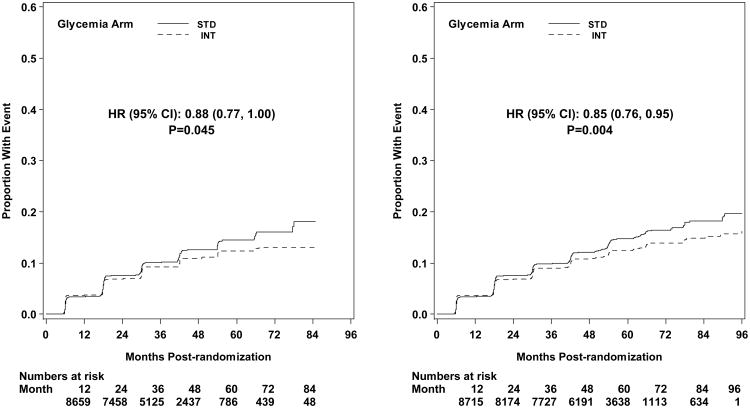
Development of peripheral neuropathy as measured by MNSI >2.0 was significantly reduced in the intensive compared to standard treatment group (HR 0.92, CI 0.86-0.99; p=0.027; NNT = 33) at study end (Figure 5). Incidence of loss of ankle jerk and light touch by 10 gm monofilament were both reduced in the intensive compared to standard glycemia treatment at study end (HR 0.90, CI 0.84-0.97; p=0.005; NNT = 28; and HR 0.85, CI 0.76-0.95; p=0.004; NNT = 49, respectively); both were also reduced at transition (Figure 4). Loss of vibratory sensation was not significantly different in the two arms.
Kaplan-Meier Plots of all microvascular outcomes are found in the Appendix.
Discussion
Microvascular complications including nephropathy, retinopathy, and neuropathy are an important source of morbidity in patients with type 2 diabetes. The available epidemiological evidence strongly implicates hyperglycemia as an important contributor to the development and progression of microvascular complications of type 2 diabetes.6 While previous clinical trials have demonstrated a reduction in microvascular endpoints with lowering of HbA1c, recent trials have found less benefit in patients of older age and longer duration of diabetes.9,13
In the present analysis, there was no significant effect of intensive glycemia treatment on the two prespecified composite microvascular outcomes, (i) advanced renal and eye complications, or (ii) the above two plus evidence of peripheral neuropathy. The UKPDS observed a decrease with intensive treatment in the composite retinal-renal outcome used by ACCORD with a lesser reduction in HbA1c.7 However, the UKPDS cohort was younger, was studied from the time of diagnosis of diabetes, and was treated intensively for 11 years with an achieved HbA1c level higher than in the intensive group of ACCORD.7
Analysis of secondary renal endpoints demonstrates that the risk of developing macroalbuminuria was decreased by 29% both at transition and at study end by intensive compared to standard glycemia treatment. Our results are concordant with ADVANCE and VADT reported reductions in microalbuminuria with intensive glycemia treatment.9,13 Macroabluminuria is a known risk factor for renal insufficiency19 and cardiovascular disease.20 Collectively, these observations emphasize the possibility of reducing this risk factor in an important group of patients with type 2 diabetes: those of older age, longer duration of disease, and established cardiovascular disease or high cardiovascular risk. Intensive glycemia treatment was associated with a 19% reduction in development of microalbuminuria, but this effect was no longer significant at study end. Intensive treatment was also associated with an increase in the composite outcome of doubling of serum creatinine or a >20 mL/min decrease in eGFR, a finding that was present at transition but not at study end. This result was largely attributable to a slight and transient differential increase in serum creatinine in the intensive group during the first two years of the trial. It should be noted that average serum creatinine levels at baseline, transition, and end of study were virtually equal between the two treatment groups (Tables 2 and 3).
In contrast to the UKPDS7 we did not observe a clear-cut benefit of intensive treatment on diabetic retinopathy by major clinical endpoints such as the need for photocoagulation; our result is consistent with both VADT and ADVANCE.9,13 We observed a significant reduction in deterioration of visual acuity associated with intensive glycemia treatment at transition at the end of the study. We also observed a 21% reduction in history of cataract extraction at study end.
At transition, there was a significant reduction in the incidence of loss of ankle reflex and light touch sensation that was associated with intensive glycemia treatment. At study end, intensive treatment was associated with significant reductions in the risk to develop peripheral neuropathy as assessed by the clinical examination of the MNSI (981/4227 vs 1050/4217; intensive vs standard), in loss of the ankle reflex (1514/3312 vs 1612/3271), and in the loss of light-touch sensation to 10-g monofilament testing (554/3312 vs 645/4573). Decreased development of peripheral neuropathy, if further sustained, may decrease the risk of ulcers and future lower limb amputations.21
The beneficial effects on surrogate secondary microvascular outcomes with intensive versus standard treatment must be balanced against observed risks. Of great concern was a 22% relative and 0.27%/year absolute increase in all-cause mortality with intensive glycemia treatment in ACCORD, prompting the discontinuation of intensive glycemia strategy and transitioning of the intensive group to standard glycemia therapy.14 In addition, intensive treatment led to increased BMI and a three-fold higher incidence of severe hypoglycemia.14 Moreover, no overall CVD benefit had accrued, though non-fatal myocardial infarction was reduced 24% (p = 0.004).14 In subgroup analysis, there was evidence suggestive of a reduction in the primary composite CVD outcome (but not in total mortality) in those who entered the study with no prior history of CVD events or with an A1C of < 8.0%.14 On balance, targeting an A1C of < 6.0% using currently available methodologies cannot be recommended on the basis of the microvascular benefits associated with intensive glycemia treatment as carried out in patients represented in the ACCORD cohort.
Strengths and Limitations
In this multicenter trial, the intention to treat principle was adhered to in the analysis of data from baseline to the time of transition and separately from baseline to study end. A significant difference in the mean HbA1c level of the two originally randomized treatment groups persisted from transition to the end of the study. The difference in HbA1c during the follow-up time exceeds those reported by the UKPDS7 and ADVANCE9 but was less than that achieved in VADT.13 Loss to patient follow-up was very low.
One limitation is that investigators were not masked to the treatment strategies or the outcomes. Another is that the period of follow-up may have been too short to show effects of treatment on some endpoints. In the UKPDS both cardiovascular and microvascular benefits persisted or became more evident after 10 years of observation. Although not generally accepted,22 a post hoc power analysis for the primary outcome (development of renal failure or retinal photocoagulation or vitrectomy to treat retinopathy) revealed 66% power to detect a 15% risk reduction in the intensive glycemia arm at transition, and 82% power to detect a 15% reduction at the end of the study. A similar analysis for the secondary outcome (primary outcome or MNSI score >2.0) revealed powers of 87% and 92% to detect a 10% risk reduction at transition and end of study, respectively. Another limitation is the use of the albumin/creatinine ratio (ACR) instead of a timed albumin excretion rate (AER). However, good correlation between the two measures of AER has been reported,23,24 though variable intra-individual correlation of AER to ACR has been observed,25 and regression of ACR to normal has also been reported.26-28 Moreover, evaluation of glomerular filtration rate was by the eGFR which has not been validated to reflect changes in GFR in patients without significant renal disease. Although study staff was trained centrally to perform tests for neuropathy, they were not certified for the procedure.
Other analytical limitations include the use of midpoint interval imputation for calculation of survival times in outcomes where the exact time of event is unknown. However, surveillance intervals for all outcomes were less than two years in duration, while several outcomes were assessed on four or six month intervals. In their examination of the effect of midpoint imputation on doubly censored survival data, Law and Brookmeyer have shown that in large samples with interval widths of two years or less, traditional survival techniques provide an adequate approximation of survival estimates.29 Finally, we acknowledge that many statistical hypothesis tests were performed. Because of the large number of hypotheses tested, assuming independent tests there would be a 54% chance (i.e., 1 − [1 − 0.05]15) of finding at least one spurious result for each analysis (transition and end of study), even if no true underlying effects were present29.
Conclusion
Intensive treatment of glycemia targeting a HbA1c of < 6.0% (with an average of 6.4%) compared to standard treatment targeting a HbA1c range of 7.0-7.9% (with an average 7.5%) did not reduce the primary microvascular composite outcome of renal failure requiring dialysis or transplantation or a rise of serum creatinine above 291.7 micromol/L, or retinal photocoagulation or vitrectomy for retinopathy. Intensive treatment did reduce the development of macroalbuminuria, loss of three lines of visual acuity, and peripheral neuropathy. These benefits must be weighed against the observed increase in total and CVD-related mortality, increased weight gain, and higher risk for severe hypoglycemia in the intensively-treated patients. Hence caution should be exercised in pursuing a strategy of intensive glycemic control for the purpose of prevention of microvascular complications in patients with established type 2 diabetes and characteristics similar to those in the ACCORD trial, and an HbA1c target of <6.0% by current means appears imprudent. The long-term balance of benefits versus risks will require follow-up of the ACCORD participants.
Supplementary Material
Acknowledgments
Supported by grants (N01-HC-95178, N01-HC-95179, N01-HC-95180, N01-HC-95181, N01-HC-95182, N01-HC-95183, N01-HC-95184, IAA-Y1-HC-9035, and IAA-Y1-HC-1010) from the National Heart, Lung, and Blood Institute; by other components of the National Institutes of Health, including the National Institute of Diabetes and Digestive and Kidney Diseases, the National Institute on Aging, and the National Eye Institute; by the Centers for Disease Control and Prevention; and by General Clinical Research Centers. The following companies provided study medications, equipment, or supplies: Abbott Laboratories, Amylin Pharmaceutical, AstraZeneca Pharmaceuticals LP, Bayer HealthCare LLC, Closer Healthcare Inc., GlaxoSmithKline Pharmaceuticals, King Pharmaceuticals, Inc., Merck & Co., Inc., Novartis Pharmaceuticals, Inc., Novo Nordisk, Inc., Omron Healthcare, Inc., Sanofi-Aventis U.S., and Takeda Pharmaceuticals Inc.
Funding support provided by the National Institutes of Health: primary support by the National Heart, Lung, and Blood Institute; other support by the National Institute of Diabetes and Digestive and Kidney Diseases, the National Institute on Aging, and the National Eye Institute; by the Centers for Disease Control and Prevention; and by General Clinical Research Centers.
Appendix
Microvascular outcomes related to three main clinical areas (kidney function, diabetic eye complications, and peripheral neuropathy) were defined in the ACCORD protocol at study outset. Endpoints included in analyses are shown in Table 1 of the manuscript. Details of measurement for individual components of each clinical area are described below.
Kidney function
microvascular related kidney parameters were based on ACCORD Central Laboratory measurement of serum and urine creatinine, and urine albumin. Serum and urine creatinine were determined enzymaticaly on a Roche Double Modular P Analytics automated analyzer. Inter-assay precision is consistently <1.4% for the high and <2.2% for the low quality control samples. Urine microalbumin was determined by immunonephelometry on a Siemens BNll nephelometer. Sensitivity of the assay is 0.16 mg/dL with inter-assay CV's of 3.0%, 2.6% and 4.9% for control levels of 0.89 mg/dL, 6.6 mg/dL, and 16.1 mg/dL, respectively. All serum and urine samples were analyzed on the day of sample receipt. Estimated glomerular filtration rate (eGFR) was also calculated at each serum creatinine measurement using the 4-variable MDRD Study equation: eGFR = 175 × (serum creatinine)-1.154 × age-0.203 × 1.212 (if black) × 0.742 (if female).1 In addition to laboratory assays to measure renal function, follow-up surveillance for dialysis, end-stage renal disease, and renal transplantation was performed by updated medical history at four month clinic visits throughout the trial.
Diabetic eye complications
assessment of eye surgeries for diabetes related conditions (photocoagulation or vitrectomy for retinopathy, and cataract removal) was performed by participant self report at annual follow-up clinic visits. At each annual exam, participants were asked whether or not they “…had eye surgery, including laser photocoagulation, during the past year…” with areas provided to specify “retinal laser photocoagulation for diabetic retinopathy” or “vitrectomy for diabetic retinopathy”, and “cataract removal” or “yag laser for cataract capsule”.
In addition to questions regarding eye surgery within the last year, ACCORD participants had an eye exam to assess visual acuity at baseline, every two years during follow-up, and at exit from the study. This exam included assessment of visual acuity using the R chart of the Lighthouse Distance Visual Acuity Test charts (Lighthouse Low Vision Products, 36-02 Northern Boulevard, Long Island, New York 11101), which are modified Early Treatment Diabetic Retinopathy Study (ETDRS) charts. Testing was required at a distance of 4 meters and, for patients with sufficiently reduced vision, at 1 meter. Participants were assessed for “habitual vision” with their usual correction for the distance utilizing the patient's current distance glasses or contacts. Participants with visual acuity score of 70 or less (Snellen fraction less than 20/40), were referred to their ophthalmologist for follow-up exam.
Peripheral Neuropathy
assessment of diabetic neuropathy in the extremities was performed annually via a standardized clinical exam in the ACCORD study sites. Neuropathic signs were assessed using the Michigan Neuropathy Screening Instrument (MNSI) examination, which comprises a structured assessment of the feet to identify deformities, dry skin, calluses, infection, fissure, or ulcers, and evaluation of ankle reflexes and vibration sensation in the great toe. For this study, neuropathy was defined operationally as a score >2.0 on the MNSI examination, a threshold defined by prior validation studies.2
Appendix References
Levey AS, Coresh J, Greene T, Stevens LA, Zhang Y, Hendriksen S, Kusek JW, Van Lente F. Using standardized serum creatinine values in the Modification of Diet in Renal Disease study equation for estimating glomerular filtration rate. Ann Intern Med 2006; 145: 247-54.
Feldman EL, Stevens MJ, Thomas PK, Brown MB, Canal N, Greene DA. A practical two-step quantitative clinical and electrophysiological assessment for the diagnosis and staging of diabetic neuropathy. Diabetes Care 1994; 17: 1281-9.
Figure A1.
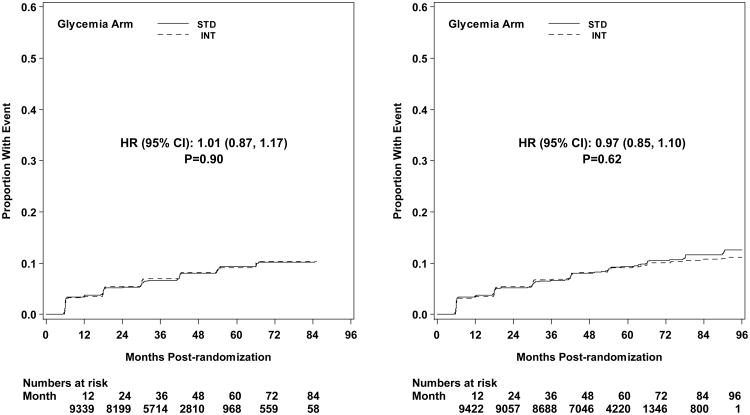
Kaplan-Meier curves for the microvascular secondary composite outcome (development of renal failure or retinal photocoagulation or vitrectomy to treat retinopathy, or score >2.0 on MNSI) by glycemia arm. Panel A: data until transition of intensive glycemia arm to standard therapy. Panel B: all data through end of study. Hazard ratios adjusted for baseline history of clinical cardiovascular disease and second trial treatment arm assignment.
Figure A2.
Kaplan-Meier curves for microvascular outcome Neph-1 (development of microalbuminuria) by glycemia arm. Panel A: data until transition of intensive glycemia arm to standard therapy. Panel B: all data through end of study. Hazard ratios adjusted for baseline history of clinical cardiovascular disease and second trial treatment arm assignment.
Figure A3.
Kaplan-Meier curves for microvascular outcome Neph-2 (development of macroalbuminuria) by glycemia arm. Panel A: data until transition of intensive glycemia arm to standard therapy. Panel B: all data through end of study. Hazard ratios adjusted for baseline history of clinical cardiovascular disease and second trial treatment arm assignment.
Figure A4.
Kaplan-Meier curves for microvascular outcome Neph-3 (development of renal failure, renal transplant, or serum creatinine > 291.7 micomol/L) by glycemia arm. Panel A: data until transition of intensive glycemia arm to standard therapy. Panel B: all data through end of study. Hazard ratios adjusted for baseline history of clinical cardiovascular disease and second trial treatment arm assignment.
Figure A5.
Kaplan-Meier curves for microvascular outcome Neph-4 (doubling of serum creatinine or more than 20 mL/min/1.73m2 decrease in estimated GFR) by glycemia arm. Panel A: data until transition of intensive glycemia arm to standard therapy. Panel B: all data through end of study. Hazard ratios adjusted for baseline history of clinical cardiovascular disease and second trial treatment arm assignment.
Figure A6.
Kaplan-Meier curves for microvascular renal composite outcome Neph-5 (development of any of three conditions Neph-2, Neph-3, or Neph-4) by glycemia arm. Panel A: data until transition of intensive glycemia arm to standard therapy. Panel B: all data through end of study. Hazard ratios adjusted for baseline history of clinical cardiovascular disease and second trial treatment arm assignment.
Figure A7.
Kaplan-Meier curves for microvascular outcome Eye-1 (retinal photocoagulation or vitrectomy to treat retinopathy) by glycemia arm. Panel A: data until transition of intensive glycemia arm to standard therapy. Panel B: all data through end of study. Hazard ratios adjusted for baseline history of clinical cardiovascular disease and second trial treatment arm assignment.
Figure A8.
Kaplan-Meier curves for microvascular outcome Eye-2 (surgery for cataract extraction) by glycemia arm. Panel A: data until transition of intensive glycemia arm to standard therapy. Panel B: all data through end of study. Hazard ratios adjusted for baseline history of clinical cardiovascular disease and second trial treatment arm assignment.
Figure A9.
Kaplan-Meier curves for microvascular outcome Eye-3 (three line change in visual acuity) by glycemia arm. Panel A: data until transition of intensive glycemia arm to standard therapy. Panel B: all data through end of study. Hazard ratios adjusted for baseline history of clinical cardiovascular disease and second trial treatment arm assignment.
Figure A10.
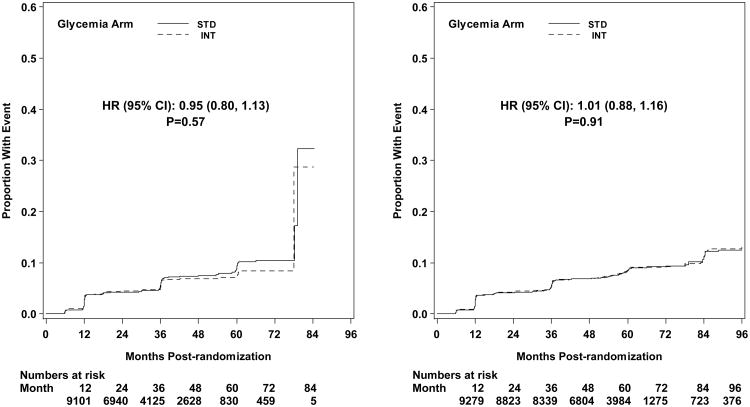
Kaplan-Meier curves for microvascular outcome Eye-4 (severe vision loss) by glycemia arm. Panel A: data until transition of intensive glycemia arm to standard therapy. Panel B: all data through end of study. Hazard ratios adjusted for baseline history of clinical cardiovascular disease and second trial treatment arm assignment.
Figure A11.
Kaplan-Meier curves for microvascular outcome Neuro-1 (score of >2.0 on the Michigan Neuropathy Screening Instrument) by glycemia arm. Panel A: data until transition of intensive glycemia arm to standard therapy. Panel B: all data through end of study. Hazard ratios adjusted for baseline history of clinical cardiovascular disease and second trial treatment arm assignment.
Figure A12.
Kaplan-Meier curves for microvascular outcome Neuro-2 (loss of vibratory sensation) by glycemia arm. Panel A: data until transition of intensive glycemia arm to standard therapy. Panel B: all data through end of study. Hazard ratios adjusted for baseline history of clinical cardiovascular disease and second trial treatment arm assignment.
Figure A13.
Kaplan-Meier curves for microvascular outcome Neuro-3 (loss of ankle jerk during Jendrassic maneuver) by glycemia arm. Panel A: data until transition of intensive glycemia arm to standard therapy. Panel B: all data through end of study. Hazard ratios adjusted for baseline history of clinical cardiovascular disease and second trial treatment arm assignment.
Figure A14.
Kaplan-Meier curves for microvascular outcome Neuro-4 (loss light-touch sensation) by glycemia arm. Panel A: data until transition of intensive glycemia arm to standard therapy. Panel B: all data through end of study. Hazard ratios adjusted for baseline history of clinical cardiovascular disease and second trial treatment arm assignment.
Footnotes
Financial disclosure of authors: Obtained and being submitted separately.
All authors have approved the revised manuscript.
Publisher's Disclaimer: This is a PDF file of an unedited manuscript that has been accepted for publication. As a service to our customers we are providing this early version of the manuscript. The manuscript will undergo copyediting, typesetting, and review of the resulting proof before it is published in its final citable form. Please note that during the production process errors may be discovered which could affect the content, and all legal disclaimers that apply to the journal pertain.
Contributor Information
Faramarz Ismail-Beigi, Case Western Reserve University, Cleveland, OH.
Timothy Craven, Wake Forest University School of Medicine, Winston-Salem, NC.
MaryAnn Banerji, SUNY Downstate Medical Center, Brooklyn, New York, NY.
Jan Basile, Ralph H Johnson VA Medical Center/Medical University of South Carolina, Charleston, SC.
Jorge Calles, Wake Forest University Baptist Medical Center, Winston-Salem, NC.
Robert Cohen, University of Cincinnati and Cincinnati VA Medical Center, Cincinnati, OH.
Robert Cuddihy, International Diabetes Center-Park Nicollet and University of Minnesota Medical School, Minneapolis, MN.
William C Cushman, Memphis Veterans Affairs Medical Center, Memphis, TN.
Saul Genuth, Case Western Reserve University, Cleveland, OH.
Richard H Grimm, Jr, Berman Center for Outcomes and Clinical Research, Minneapolis, MN.
Bruce Hamilton, VA Medical Center And University of Maryland School of Medicine, Baltimore, MD.
Byron Hoogwerf, Cleveland Clinic, Cleveland, OH (Current affiliation: Eli Lilly, Indianapolis, IN).
Diane Karl, Oregon Health & Science University.
Lois Katz, VA New York Harbor Healthcare System, NYU School of Medicine, NY.
Armand Krikorian, Case Western Reserve University, Cleveland, OH.
Patrick O'Connor, HealthPartners Research Foundation, Minneapolis, MN.
Rodica Pop-Busui, University of Michigan Medical Center, Ann Arbor, MI.
Ulrich Schubart, Jacobi Medical Center/Albert Einstein College of Medicine, Bronx, NY.
Debra Simmons, University of Arkansas for Medical Sciences Central Arkansas Veterans Healthcare System, AK.
Harris Taylor, Case Western Reserve University; Louis Stokes VA Medical Center, Cleveland, OH.
Abraham Thomas, Henry Ford Hospital, Detroit, MI.
Daniel Weiss, Your Diabetes Endocrine Nutrition Group, Inc, Mentor, OH.
Irene Hramiak, St. Joseph's Health Care, London, ON, Canada.
References
- 1.Klein R, Klein EK, Moss SE, et al. The Wisconsin Epidemiologic Study of Diabetic Retinopathy. Arch Ophthalmol. 1984;102:527–32. doi: 10.1001/archopht.1984.01040030405011. [DOI] [PubMed] [Google Scholar]
- 2.Stratton IM, Kohner EM, Aldington SJ, et al. UKPDS50: Risk factors for incidence and progression of retinopathy in type II diabetes over 6 years from diagnosis. Diabetologia. 2001;44:156–63. doi: 10.1007/s001250051594. [DOI] [PubMed] [Google Scholar]
- 3.Ballard DJ, Humphrey LL, Melton LJ, et al. Epidemiology of persistent proteinuria in type II diabetes mellitus. Population-based study in Rochester, Minnesota. Diabetes. 1988;37:405–12. doi: 10.2337/diab.37.4.405. [DOI] [PubMed] [Google Scholar]
- 4.UK Prospective Diabetes Study Group. X. Urinary albumin excretion over 3 years in diet-treated Type 2, (non-insulin-dependent) diabetic patients, and association with hypertension, hyperglycaemia and hypertriglyceridaemia. Diabetologia. 1993;36:1021–9. [PubMed] [Google Scholar]
- 5.Adler AI, Boyko EJ, Ahroni JH, et al. Risk factors for diabetic peripheral sensory neuropathy. Results of the Seattle Prospective Diabetic Foot Study. Diabetes Care. 1997;20:1162–7. doi: 10.2337/diacare.20.7.1162. [DOI] [PubMed] [Google Scholar]
- 6.Stratton IM, Adler AI, Neil AW, et al. Association of glycaemia with macrovascular and microvascular complications of type 2 diabetes (UKPDS 35): prospective observational study. BMJ. 2000;321:405–12. doi: 10.1136/bmj.321.7258.405. [DOI] [PMC free article] [PubMed] [Google Scholar]
- 7.UKPDS Group. Intensive blood-glucose control with sulphonylureas or insulin compared with conventional treatment and risk of complications in patients with type 2 diabetes (UKPDS 33) Lancet. 1998;352:837–53. [PubMed] [Google Scholar]
- 8.Ohkubo Y, Kishikawa H, Araki E, et al. Intensive insulin therapy prevents the progression of diabetic microvascular complications in Japanese patients with non-insulin-dependent diabetes mellitus: a randomized prospective 6-year study. Diabetes Res Clin Pract. 1995;28:103–17. doi: 10.1016/0168-8227(95)01064-k. [DOI] [PubMed] [Google Scholar]
- 9.The ADVANCE Collaborative Group. Intensive blood glucose and vascular outcomes in patients with type 2 diabetes. N Engl J Med. 2008;358:2560–72. doi: 10.1056/NEJMoa0802987. [DOI] [PubMed] [Google Scholar]
- 10.Moritz T, Duckworth W, Abraira C. Veterans affairs diabetes trial-corrections. N Eng J Med. 2009;361:1024–35. doi: 10.1056/NEJMc096250. [DOI] [PubMed] [Google Scholar]
- 11.ACCORD Study Group. Buse JB, Bigger JT, Byington RP, et al. Action to Control Cardiovascular Risk in Diabetes (ACCORD) trial: design and methods. Am J Cardio. 2007;99:21i–33i. doi: 10.1016/j.amjcard.2007.03.003. [DOI] [PubMed] [Google Scholar]
- 12.Gerstein HC, Riddle MC, Kendall DM, et al. for the ACCORD Study Group. Glycemia treatment strategies in the Action to Control Cardiovascular Risk in Diabetes (ACCORD) trial. Am J Cardio. 2007;99:34i–43i. doi: 10.1016/j.amjcard.2007.03.004. [DOI] [PubMed] [Google Scholar]
- 13.Duckworth W, Abraira C, Moritz T, et al. Glucose control and vascular complications in veterans with type 2 diabetes. N Engl J Med. 2009;360:129–39. doi: 10.1056/NEJMoa0808431. [DOI] [PubMed] [Google Scholar]
- 14.ACCORD Study Group. Gerstein HC, Miller ME, Byington RP, et al. Effects of intensive glucose lowering in type 2 diabetes. N Engl J Med. 2008;358:2545–59. doi: 10.1056/NEJMoa0802743. [DOI] [PMC free article] [PubMed] [Google Scholar]
- 15.UK Prospective Diabetes Study Group. Tight blood pressure control and risk of macrovascular and microvascular complications in Type 2 diabetes: UKPDS 38. Br Med J. 1998;317:703–13. [PMC free article] [PubMed] [Google Scholar]
- 16.Lan KKG, DeMets DL. Discrete sequential boundaries for clinical trials. Biometrika. 1983;70:659–663. [Google Scholar]
- 17.Law SG, Brookmeyer R. Effects of mid-point imputation on the analysis of doubly censored data. Stat Med. 1992;11(12):1569–1578. doi: 10.1002/sim.4780111204. [DOI] [PubMed] [Google Scholar]
- 18.Rothman KJ. No adjustments are needed for multiple comparisons. Epidemiology. 1990;1(1):43–45. [PubMed] [Google Scholar]
- 19.Meguro S, Shigihara T, Kabeya Y, Tomita M, Atsumi Y. Increased risk of renal deterioration associated with low e-GFR in Type 2 diabetes mellitus only in albuminuric subjects. Inter Med. 2009;48:657–63. doi: 10.2169/internalmedicine.48.1865. [DOI] [PubMed] [Google Scholar]
- 20.Sayage S, Estacio RO, Jeffers B, et al. Urinary albumin excretion as a predictor of diabetic retinopathy, neuropathy, and cardiovascular disease in NIDDM. Diabetes Care. 1996;19:1243–8. doi: 10.2337/diacare.19.11.1243. [DOI] [PubMed] [Google Scholar]
- 21.Rith-Najarian SJ, Stolusky T, Gohdes DM. Identifying diabetic patients at high risk for lower-extremity amputation in a primary health care setting: a prospective evaluation of simple screening criteria. Diabetes Care. 1992;15:1386–9. doi: 10.2337/diacare.15.10.1386. [DOI] [PubMed] [Google Scholar]
- 22.Levine M, Ensom MH. Post hoc power analysis: an idea whose time has passed? Pharmacotherapy. 2001;4:405–9. doi: 10.1592/phco.21.5.405.34503. [DOI] [PubMed] [Google Scholar]
- 23.Dyer AR, Greenland P, Elliott P, et al. for the INTERMAP Research Group. Evaluation of measures of urinary albumin excretion in epidemiologic studies. Am J Epidemiol. 2004;160:1122–31. doi: 10.1093/aje/kwh326. [DOI] [PMC free article] [PubMed] [Google Scholar]
- 24.Derhaschnig U, Kittler H, Woisetschlager C, Bur A, Herkner H, Hirschl MM. Microalbumin measurement alone or calculation of the albumin/creatinine ratio for the screening of hypertension patients? Nephrol Dial Transplant. 2002;17:81–5. doi: 10.1093/ndt/17.1.81. [DOI] [PubMed] [Google Scholar]
- 25.Phillipou G, Phillips PJ. Variability of urinary albumin excretion in patients with microalbuminuria. Diabetes Care. 1994;17:425–7. doi: 10.2337/diacare.17.5.425. [DOI] [PubMed] [Google Scholar]
- 26.Newman DJ, Mattock MB, Dawnay AB, et al. Systematic review on urine albumin testing for early detection of diabetic complications. Health Technol Assess. 2005;9:iii–vi. xiii–163. doi: 10.3310/hta9300. [DOI] [PubMed] [Google Scholar]
- 27.Perkins BA, Ficociello LH, Silva KH, Finkelstein DM, Warram JH, Krolewski AS. Regression of microalbuminuria in Type 1 Diabetes. New Engl J Med. 2003;348:2285–93. doi: 10.1056/NEJMoa021835. [DOI] [PubMed] [Google Scholar]
- 28.Giorgino F, Laviola L, Cavallo Perin P, Solnica B, Fuller J, Chaturvedi N. Factors associated with progression to macroalbuminuria in microalbuminuric Type 1 diabetic patients: the EURODIAB Prospective Complications Study. Diabetologia. 2004;47:1020–28. doi: 10.1007/s00125-004-1413-8. [DOI] [PubMed] [Google Scholar]
- 29.Wang R, Lagakos SW, Ware JH, Hunter DJ, Drazen JM. Statistics in medicine -reporting of subgroup analyses in clinical trials. N Engl J Med. 2008;357:2189–94. doi: 10.1056/NEJMsr077003. [DOI] [PubMed] [Google Scholar]
Associated Data
This section collects any data citations, data availability statements, or supplementary materials included in this article.


