

Abstract
There is increasing interest in imaging short T2 species which show little or no signal with conventional magnetic resonance (MR) pulse sequences. In this paper, we describe the use of three-dimensional ultrashort echo time (3D UTE) sequences with TEs down to 8 μs for imaging of these species. Image contrast was generated with acquisitions using dual echo 3D UTE with echo subtraction, dual echo 3D UTE with rescaled subtraction, long T2 saturation 3D UTE, long T2 saturation dual echo 3D UTE with echo subtraction, single adiabatic inversion recovery 3D UTE, single adiabatic inversion recovery dual echo 3D UTE with echo subtraction and dual adiabatic inversion recovery 3D UTE. The feasibility of using these approaches was demonstrated in in vitro and in vivo imaging of calcified cartilage, aponeuroses, menisci, tendons, ligaments and cortical bone with a 3-T clinical MR scanner. Signal-to-noise ratios and contrast-to-noise ratios were used to compare the techniques.
Keywords: Ultrashort TE, Projection reconstruction, 3D imaging, Short T2 contrast, Musculoskeletal imaging
1. Introduction
There are many tissues and tissue components which have very short T2 relaxation times and so little or no signal can be detected from them using conventional magnetic resonance imaging (MRI) sequences. These include calcified cartilage, aponeuroses, menisci, tendons, ligaments, cortical bone and some forms of soft tissue calcification [1–3].
One of the techniques developed for directly visualizing these short T2 components is ultrashort echo time (UTE) imaging which uses TEs reduced from typical values of several milliseconds or longer for clinical sequences, to 100 μs or less. As a result, short T2 signals can be detected and spatially encoded before they decay to zero [4–17]. A variety of UTE techniques have been developed, including conventional two-dimensional (2D) radial [4–7], 2D spiral [8], 2D twisted radial lines [9], three-dimensional projection reconstruction (3D PR) [10–15], 3D twisted projection imaging (TPI) [16] and hybrid methods such as acquisition-weighted stack of spirals [17]. While the main objective of these techniques has been to reduce TE to allow signal detection, it is also important to develop contrast in the short T2 range, and this can be more difficult with 3D rather than 2D UTE imaging because of the need for shorter values of TR.
Currently, the two main contrast mechanisms used for 3D UTE imaging are dual echo acquisition followed by later echo subtraction and long T2 saturation. In the former approach, an additional image is acquired after the free induction decay (FID) image. Subtraction of the later image from the FID one provides selective imaging of the signal decay between the two images [2,18]. In the second approach, a long 90° pulse is usually employed to selectively nutate the long T2 magnetization into the transverse plane where it is dephased with a crusher gradient, leaving the short T2 magnetization largely unaffected and subsequently detected with UTE sequences [14,19,20]. Although 3D UTE sequences using these contrast mechanisms have shown promising results [11–18], short T2 contrast may still be limited due to imperfect long T2 suppression. Some short T2 species such as calcified cartilage have never been successfully imaged with 3D UTE sequences.
In this paper, several short T2 contrast mechanisms were used with a basic 3D UTE sequence. These included dual echo 3D UTE with echo subtraction (3D dUTE), dual echo 3D UTE with rescaled subtraction (3D UTE-RS), long T2 saturation 3D UTE (3D sUTE), long T2 saturation dual echo 3D UTE with echo subtraction (3D sdUTE), single adiabatic inversion recovery 3D UTE (3D SIR-UTE), single adiabatic inversion recovery dual echo 3D UTE with echo subtraction (3D SIR-dUTE) and dual adiabatic inversion recovery 3D UTE (3D DIR-UTE). The approaches were demonstrated in in vivo and in vitro imaging of the calcified cartilage, aponeuroses, menisci, tendons, ligaments and cortical bone using a 3-T clinical MR scanner. Signal-to-noise ratios (SNRs) and contrast-to-noise ratios (CNRs) were used to compare techniques.
2. Materials and methods
A basic 3D UTE sequence was implemented on a 3-T Signa TwinSpeed scanner (GE Healthcare Technologies, Milwaukee, WI, USA) with a maximum gradient performance of 40 mT/m and 150 mT/m/ms. The sequence employed a short nonselective hard pulse (duration=40 μs) for volumetric excitation, followed by 3D radial ramp sampling with k-space traversed radially from k=0 outwards. The half projections were distributed uniformly over a sphere in k-space, providing isotropic spatial resolution and volumetric coverage. Following convention, TE was defined as the interval between the end of the short hard RF pulse and the start of radial sampling. This delay was limited only by the time required to turn off the RF transmitter and enable the receiver. The scanner was equipped with a fast transmit/receive (T/R) switch which allowed use of TEs down to 8 μs [21,22].
Image contrast of short T2 species may be reduced by high signal from surrounding long T2 tissues including fat. Efficient suppression of these signals may be important in achieving contrast for short T2 tissues, such as bone which has much lower mobile proton density than muscle and fat. Contrast mechanisms may be important both to suppress long T2 signals and to create differences in signal from tissues with T2s in the short range. The following mechanisms including echo subtraction, long T2 saturation, adiabatic inversion and their combinations were included in the sections below.
2.1. 3D dUTE
Dual echo acquisition with later echo subtraction has been used to suppress long T2 signals in 2D and 3D UTE imaging previously to produce a difference image (dUTE) [2,18]. With this approach (Fig. 1A), the first FID acquisition detects signal from both long and short T2 components, while the second echo detects signal from longer T2 components. Echo time for the second echo can be kept at the minimal value for the fat and water in-phase imaging or a multiple of this, i.e., 2.2, 4.4 or 6.6 ms, depending on the field of view (FOV), acquisition matrix size and bandwidth. Subtraction of the second echo from the first one selectively suppresses signal from the longer T2 components and typically provides high contrast in the short T2 range (Fig. 1B). This approach is simple and time-efficient. The main drawbacks are that the second echo contributes relatively little signal but increases the noise level by the square root of 2. In addition the second echo is acquired with a longer TE, and is therefore more vulnerable to susceptibility effects.
Fig. 1.
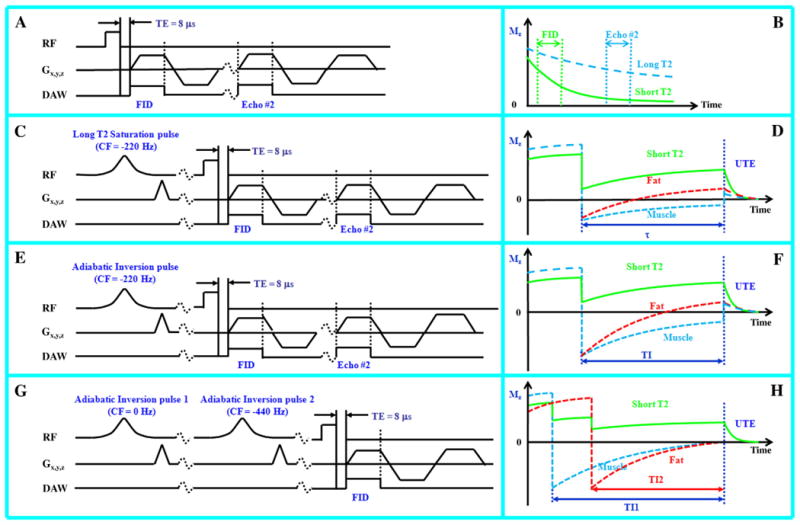
Image contrast for short T2 species was generated by acquisitions using dual echo 3D UTE (A), long T2 saturation dual echo 3D UTE (C), single adiabatic inversion recovery dual echo 3D UTE (E) and dual adiabatic inversion recovery 3D UTE (G). The diagrams on the right (B, D, F and H) show the corresponding short T2 contrast mechanisms for each approach.
2.2. 3D UTE-RS
With 3D UTE-RS, the initial FID image is scaled down relative to that of the second image and signals from muscle and fat can become lower than those from the second image [23]. In the subtraction image, signals from muscle and fat may be negative while those from short T2 species are positive, separating them from air. The 3D UTE-RS technique can create high positive contrast for short T2 species, especially cortical bone which has a much lower mobile proton density than surrounding muscle and fat. Regular unscaled echo subtraction may significantly reduce bone contrast in this situation.
2.3. 3D sUTE and its combination with dual echo acquisition and echo subtraction (3D sdUTE)
When a 90° pulse is employed for long T2 saturation, the short T2 contrast may be degraded because of signal recovery between the saturation procedure and the 3D UTE data acquisition, especially from species with relatively short T1 such as fat. We used a long Gaussian saturation pulse (8 ms in duration) with a 105° flip angle to suppress both long T2 water and fat signals (Fig. 1C). The longitudinal magnetizations of long T2 water and fat are slightly inverted and recover to near the null points after a short time just before the 3D UTE data acquisition, leaving signal mainly from short T2 species (Fig. 1D). The Gaussian saturation pulse was centered at −220 Hz and had sufficient spectral width (1 kHz) to include both the water and fat peaks. Residual long T2 signals due to imperfect saturation (e.g., due to B1 inhomogeneity) can be reduced by subtraction of the second image from the first one (3D sdUTE).
2.4. 3D SIR-UTE and its combination with dual echo acquisition and echo subtraction (3D SIR-dUTE)
In this approach (Fig. 1E), an adiabatic fast passage (Silver–Hoult) inversion pulse (8.6 ms in duration) was used to invert the longitudinal magnetization of long T2 water and fat components [7]. Adiabatic inversion pulses are comparatively insensitive to B1 inhomogeneity and so provide uniform inversion when the pulse amplitude is above the adiabatic threshold [24]. The short T2 longitudinal magnetization is relatively unaffected during the long adiabatic inversion process. The 3D UTE acquisition was preceded by a delay time (TI) designed to allow the inverted long T2 water and fat magnetization to approach the null point, as shown in Fig. 1F. Due to the large difference in T1 values between fat (∼360 ms) and muscle (∼1400 ms) at 3 T [25], their longitudinal magnetizations do not reach the null point simultaneously. Simulation using the Bloch equations showed that both fat and muscle signals can be reduced by more than 85% with appropriate combinations of TR and TI [26]. The adiabatic inversion pulse was centered at −220 Hz to provide spectral coverage of the water and fat peaks. Residual long T2 signals due to imperfect nulling (e.g., imperfect TI value) can be suppressed by subtraction of the later image from the first image (3D SIR-dUTE).
2.5. 3D DIR-UTE
In this approach (Fig. 1G), two long adiabatic inversion pulses (18 ms in duration) were used to successively invert the longitudinal magnetizations of long T2 water and fat components [27]. The 3D UTE acquisition was started at a delay time of TI1 necessary for the inverted long T2 water magnetization to reach the null point, and TI2 for the inverted fat magnetization to simultaneously reach the null point (Fig. 1H). The long T2 water magnetization was inverted first (TI1>TI2) because of its longer T1, and the fat magnetization was inverted later because of its shorter T1 values. Appropriate combination of TI1, TI2 and TR allows robust (insensitive to B1 and B0 inhomogeneities) and efficient simultaneous suppression of long T2 water and fat signals, creating ultrahigh contrast for short T2 species.
2.6. Data acquisition
The 3D UTE sequence combined with different long T2 suppression mechanisms were tested on tissue specimens and healthy volunteers. The 3D dUTE sequence was used in three normal adult volunteers to image tendons, aponeuroses and ligaments, as well as a meniscus sample to demonstrate calcification. The 3D UTE-RS technique was used in three healthy human volunteers to image the tibia. The 3D sUTE and 3D sdUTE sequences were used to image cortical bone of two porcine legs as well as three normal human volunteers. The 3D SIR-UTE and SIR-dUTE sequences were assessed on cadaveric human forearm and tibial samples. The 3D DIR-UTE sequence was used to image the calcified cartilage, which is a thin layer (80–200 μm in thickness) and functions as an interface between the hard subchondral bone and the softer more superficial layers of cartilage [27,28], of three patellae samples which were mounted in 10-ml syringes and suspended within a bath of phosphate-buffered saline. Finally, the eight short T2 contrast mechanisms were compared through in vitro imaging of cortical bone and the Achilles tendon. Institutional Review Board permission was obtained for this study. A single channel receive-only 3-in. coil (in this case, body coil was used for signal excitation), quadrature knee T/R coil or 1-in. birdcage T/R coil was used. Typical imaging parameters were listed in Table 1 for each experiment.
Table 1.
Data acquisition parameters for 3D UTE, 3D dUTE, 3D UTE-RDS, 3D sUTE, 3D sdUTE, 3D SIR-UTE, 3D SIR-dUTE and 3D DIR-UTE sequences for in vivo and in vitro imaging of cortical bone, aponeuroses, tendons, ligaments, menisci, meniscal calcification and calcified cartilage
| Imaging parameters | FOV (cm) |
Readout matrix |
Voxel size (mm) |
BW (kHz) |
Coil | FA (°) |
TR (ms) |
TE1 (μs) |
TE2 (ms) |
* TI (ms) | Projection numbers |
Undersampling factor |
Scan time (min) |
|---|---|---|---|---|---|---|---|---|---|---|---|---|---|
| 3D dUTE (volunteer-leg) | 24 | 256 | 0.83 | 250 | Quad-Knee Coil | 14 | 15.2 | 8 | 2.2 | - | 40 000 | 5.1 | 9:20 |
| 3D dUTE (volunteer-knee) | 22 | 384 | 0.57 | 125 | Quad-Knee Coil | 14 | 18.5 | 8 | 4.4 | - | 40 000 | 11.6 | 12:30 |
| 3D dUTE (calcification) | 8 | 384 | 0.21 | 125 | 3-in. coil | 9 | 21 | 8 | 7.0 | - | 80 000 | 5.8 | 28:00 |
| 3D UTE-RDS (volunteer-tendons) | 24 | 256 | 0.83 | 125 | 3-in. coil | 9 | 15.2 | 8 | 2.2 | - | 40 000 | 5.1 | 9:20 |
| 3D UTE-RDS (volunteer-tibia) | 24 | 256 | 0.83 | 250 | Quad-Knee Coil | 14 | 15.2 | 8 | 2.2 | - | 40 000 | 5.1 | 9:20 |
| 3D sUTE (pig-leg) | 8 | 256 | 0.31 | 125 | 3-in. coil | 9 | 28 | 8 | 2.2 | - | 40 000 | 5.1 | 18:40 |
| 3D sdUTE (human-tibia) | 24 | 256 | 0.83 | 250 | 3-in. coil | 9 | 28 | 8 | 2.2 | - | 40 000 | 5.1 | 18:40 |
| 3D SIR-UTE (cadaver forearm) | 24 | 256 | 0.83 | 250 | 3-in. coil | 9 | 94 | 8 | - | 38 | 20 000 | 10.3 | 32:20 |
| 3D SIR-dUTE (tibia sample) | 8 | 256 | 0.31 | 125 | 1-in. coil | 14 | 94 | 8 | - | 38 | 20 000 | 10.3 | 32:20 |
| 3D UTE (patella) | 8 | 384 | 0.21 | 125 | 1-in. coil | 14 | 26 | 8 | 4.6 | - | 40 000 | 11.6 | 17:20 |
| 3D DIR-UTE (patella) | 8 | 384 | 0.21 | 125 | 1-in. coil | 14 | 300 | 8 | - | 130/80 | 20 000 | 23.2 | 100:00 |
TI: for DIR-UTE, both TI1 and TI2 were listed.
For quantitative assessment of the basic 3D UTE, 3D dUTE, 3D UTE-RS, 3D sUTE, 3D sdUTE, 3D SIR-UTE, 3D SIR-dUTE and 3D DIR-UTE sequences, SNR and CNR measurements were performed. Signal-to-noise ratio was calculated as the ratio of the mean signal intensity inside a user-drawn region of interest (ROI) to the standard deviation of the signal in an ROI placed in air. The CNR between different tissues or tissue components was calculated as the signal difference divided by background noise. The standard deviation was calculated by placing multiple ROIs in different regions. Typical ROI included more than 100 pixels for the menisci, tendons, aponeuroses, ligaments and cortical bone. A small line-shaped ROI including around 10 pixels was placed along the high signal line of calcified cartilage to measure SNR/CNR of the calcified cartilage.
3. Results
The 3D dUTE sequence was first applied to the lower leg of a 57-year-old healthy male volunteer, demonstrating muscular aponeuroses as shown in Fig. 2. The CNR between aponeurosis and muscle was 17.45±3.85 at an isotropic spatial resolution of 0.78×0.78×0.78 mm3 in a scan time of 9.3 min. Cortical bone was also detectable but with a negative CNR of −24.61±4.26 relative to fatty bone marrow because of the significant decay in signal in fatty marrow even with a short in phase echo spacing of 2.2 ms. Fig. 3 shows 3D dUTE imaging of the knee of the same volunteer with same protocol. Meniscus was well depicted in the subtraction image with a high SNR of 21.38±4.27. The 3D dUTE sequence was also applied to a meniscus sample, and subtraction of the second echo image from the first FID image selectively showed meniscal calcification (Fig. 4). There were residual signals from fat and meniscal fibers oriented parallel to the B0 field. These signals show significant decay between the first FID and the second image, resulting in a relatively high signal on the subtraction image.
Fig. 2.
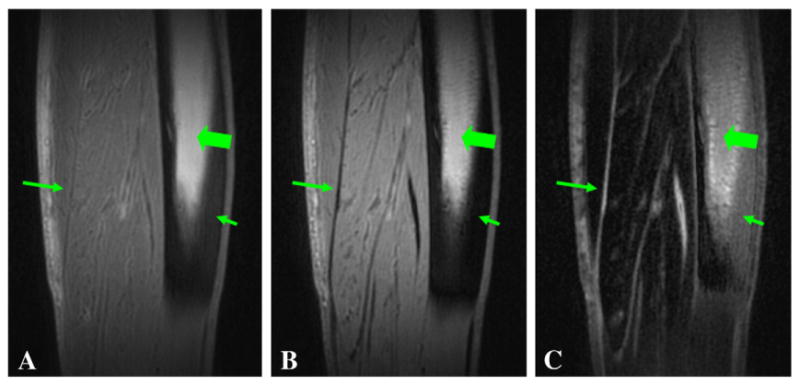
3D dUTE imaging of the lower leg of a 58-year-old male volunteer with TEs of 8 μs (A) and 2.2 ms (B), and the corresponding subtraction image (C). (C) shows high contrast for aponeuroses (long arrows) in the sagittal reprojection. The residual signal from bone marrow (thick arrows) limits contrast with cortical bone (short arrows).
Fig. 3.
3D dUTE imaging of the knee of a 59-year-old male volunteer with TEs of 8 μs (A) and 2.2 ms (B), and the corresponding subtraction image (C). (C) shows high contrast for meniscus (long arrows) in the sagittal reprojection.
Fig. 4.
3D dUTE imaging of meniscal calcification in the coronal (upper row) and axial (lower row) reprojections with TEs of 8 μs (A, D) and 7 ms (B, E), and the corresponding subtraction images (C, F). Meniscal calcification is depicted with high contrast and isotropic spatial resolution (short arrows). There is some residual signal from fat (thick arrows) and meniscal regions (long arrows) which experienced significant signal decay with the echo spacing of 7 ms and appear as high signal on the subtraction image.
The 3D UTE-RS sequence was used to image the Achilles tendon and tibia in three healthy volunteers. Fig. 5 shows 3D UTE-RS imaging of the Achilles tendon of a volunteer. Regular 3D UTE images (Fig. 5A and 5E) provided a high SNR of 54.99±5.73 for the Achilles tendon but a negative CNR of −26.45±4.87 between tendon and fat. Regular echo subtraction (Fig. 5C and 5G) increased CNR to 26.78±3.87, which was further increased to 41.38±4.14 with rescaled subtraction where fat signal was shifted to negative values. The 3D UTE-RS sequence was also applied in three healthy volunteers to image the tibia. Fig. 6 shows 3D UTE-RS imaging of the tibia of a healthy volunteer, where tibia was well depicted with UTE-RS (Fig. 6D–F). However, bone contrast was reduced when absolute pixel intensities were used (Fig. 6G–I). Cortical bone showed a positive signal with all three rescaling factors.
Fig. 5.
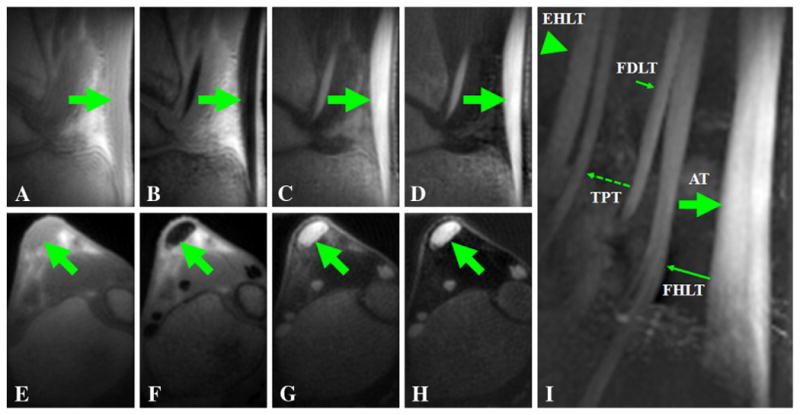
3D UTE-RS imaging of the Achilles tendon of a volunteer with a TE of 8 μs (A, E) and 2.2 ms (B, F). Regular echo subtraction (C, G) provides good contrast for the Achilles tendon. Increased contrast was observed when negative pixel intensity was allowed and the second echo was subtracted from the FID image whose intensity was rescaled down by a factor of 0.6 (D, H). Tendon signal remained positive for all the RS images. The sagittal maximal intensity projection image (I) shows excellent depiction of the Achilles tendon (AT), the flexor digitorum longus tendon (FDLT), the flexor hallucis longus tendon (FHLT), the tibialis posterior tendon (TPT) and the extensor hallucis longus tendon (EHLT).
Fig. 6.
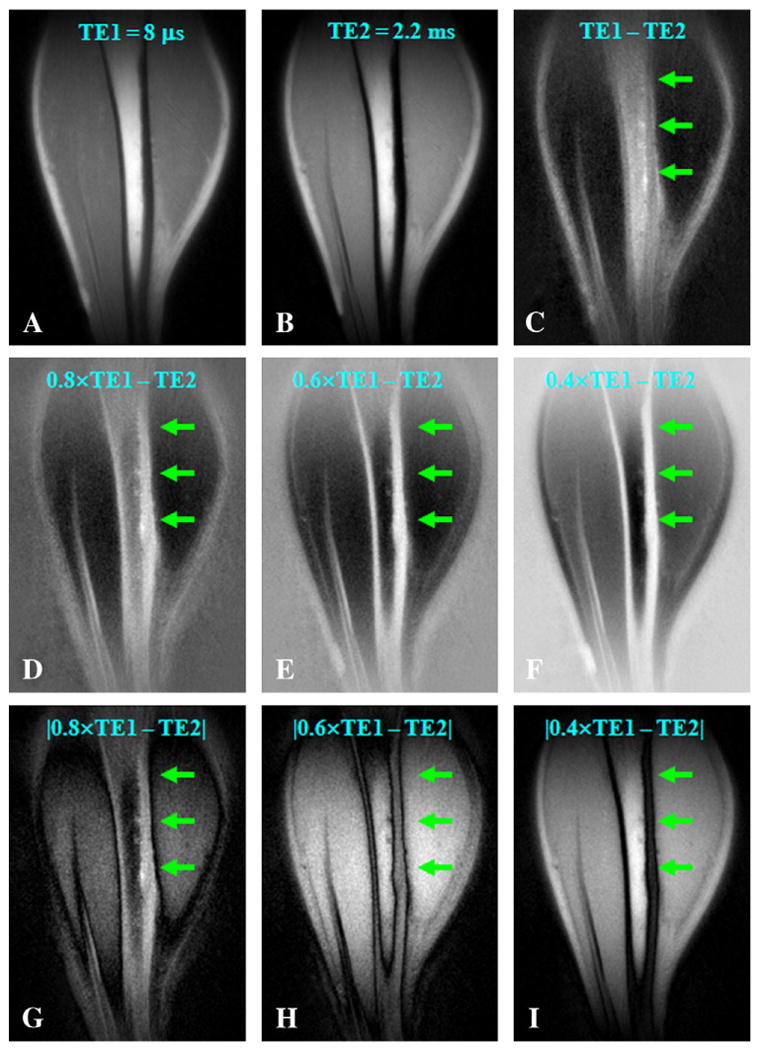
3D UTE-RS imaging of the tibia of a volunteer with a TE of 8 μs (A) and 2.2 ms (B). Regular echo subtraction (C) provides limited contrast for cortical bone. Increased bone contrast was observed when negative pixel intensity was allowed and the second echo was subtracted from the FID image whose intensity was rescaled down by a factor of 0.8 (D), 0.6 (E) or 0.4 (F). However, bone contrast gradually decreased when absolute pixel intensity was used for the same rescaling factors of 0.8 (G), 0.6 (H) and 0.4 (I). Bone signal remained positive on all the RS images.
The 3D sUTE sequence was applied to two porcine legs and three human lower legs to image cortical bone. By increasing the saturation pulse flip angle from 90° to 105°, both muscle and fat signals were well suppressed and cortical bone was shown with high contrast (Fig. 7). The saturation approach worked well for small FOV (such as 8 cm) imaging with the small porcine legs near the isocenter of the scanner bore. This showed improved SNR efficiency and B1 homogeneity. The Gaussian saturation pulse provided relatively uniform simultaneously suppression of long T2 water and fat signals. High SNR of 16.83±2.62 and CNRs of 13.57±1.84 between bone and muscle and 9.82±1.98 between bone and marrow fat were achieved. The 3D sUTE sequence was applied to volunteers with a larger FOV of 24 cm. The B1 inhomogeneity within this FOV resulted in residual signals from long T2 water and fat, as shown in Fig. 8 (upper row). A negative image CNR of −9.97±1.74 between cortical bone and marrow fat was demonstrated. The sUTE sequence can be combined with dual echo acquisition and later echo subtraction to suppress the residual long T2 signals due to B1 inhomogeneity. High contrast for cortical bone was achieved with this approach as shown in Fig. 8 (lower row). The CNR between cortical bone and marrow fat was improved to 11.63±1.94.
Fig. 7.
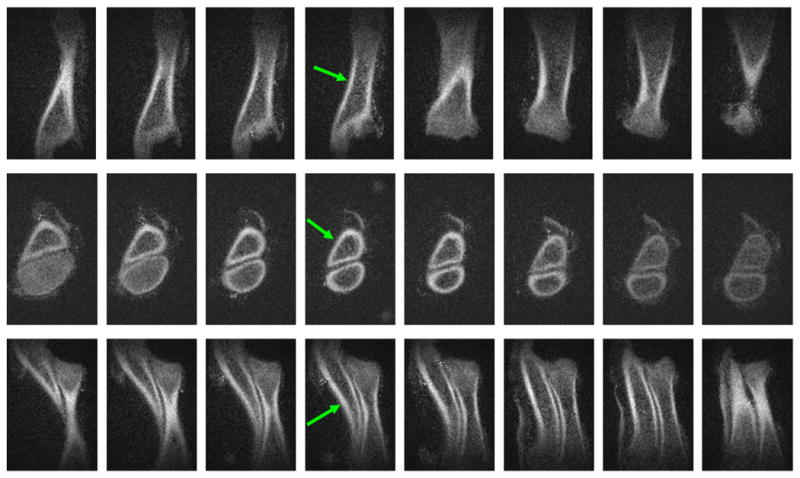
3D sUTE imaging of a porcine leg. This provides high isotropic spatial resolution and contrast images in the coronal (first row), axial (second row) and sagittal (third row) reprojections. The long T2 signals from muscle and fat were well suppressed with a single 100° saturation pulse centered at −220 Hz.
Fig. 8.
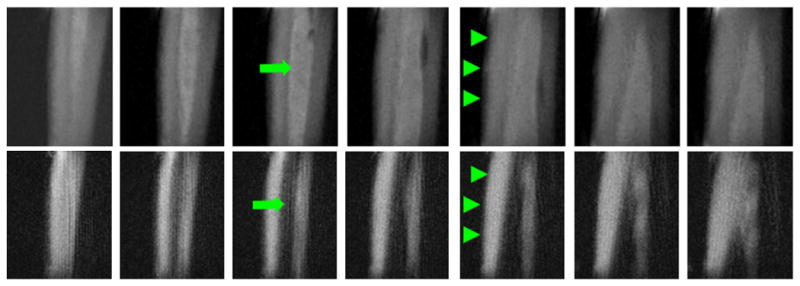
3D sUTE imaging of tibia of a healthy 31-year-old male volunteer in the coronal plane. This shows high signal from both cortical bone (arrowheads) and bone marrow fat (arrows) with excellent suppression of muscle signal (first row). The combination of long T2 saturation pulse with dual echo acquisition and echo subtraction (3D sdUTE) reduces the signal from marrow fat further and enhances bone contrast (second row).
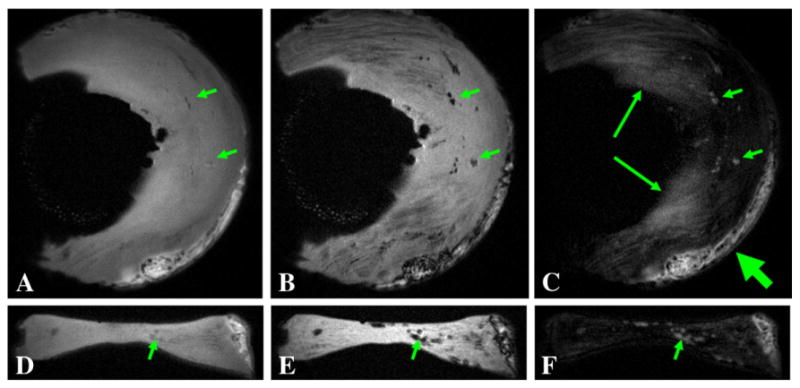
The 3D SIR-UTE sequence was used to image a human cadaveric forearm as shown in Fig. 9. Excellent suppression of muscle signal was achieved for the forearm, with a CNR of 26.51±4.26 between tendon and muscle and 18.53±3.57 between cortical bone and muscle. However, there was some residual fat signal due to an inexact choice of nulling time, resulting in a CNR of 3.24±0.67 between cortical bone and marrow fat. The 3D SIR-dUTE sequence was used to image a bone sample as shown in Fig. 10. Excellent simultaneously suppression of water and fat signals was achieved with a CNR of 9.85±1.31 between cortical bone and fatty bone marrow. In contrast, the regular 3D UTE sequence provided a negative CNR of −7.94±1.27 between bone and marrow fat. The rubber stopper in the syringe had a short T2* and short T1, and appeared as high signal with both 3D SIR-UTE and 3D SIR-dUTE images.
Fig. 9.
3D SIR-UTE imaging of the forearm. This shows high contrast for tendons (thin arrows) and moderate contrast for cortical bone (thick arrows). Long T2 muscle signals are well suppressed by the adiabatic IR pulse, while bone marrow fat signal is only partly suppressed probably due to imperfect choice of TI.
Fig. 10.
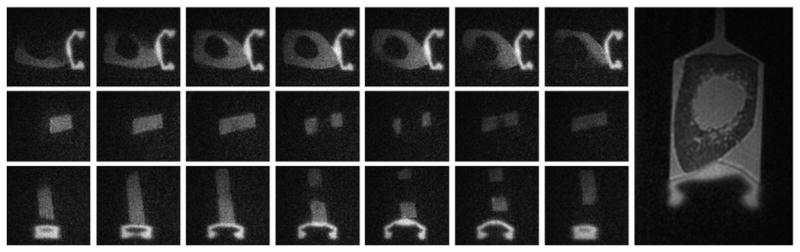
3D SIR-dUTE imaging of a bone specimen. This shows cortical bone and the rubber stopper of the syringe with high contrast in the axial (first row), coronal (second row) and sagittal (third row) reprojections. In comparison, regular 3D UTE provides high signal for marrow fat and saline with limited image contrast for cortical bone (right most image).
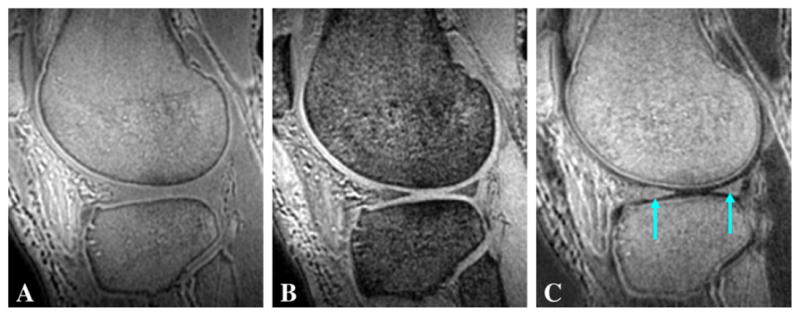
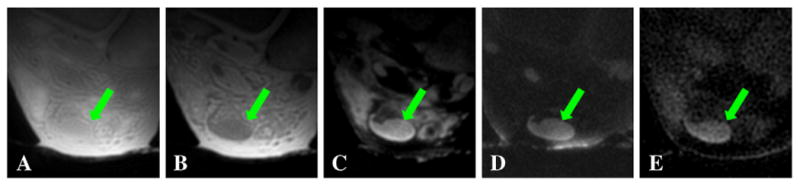
The 3D DIR-UTE sequence was applied to image calcified cartilage in patellae samples (short arrows in Fig. 11). Contrast-to-noise ratios of 14.55±0.67 between the calcified cartilage and marrow fat and 18.83±0.86 between the calcified cartilage and superficial layers of cartilage were achieved at a spatial resolution of 0.21×0.21×0.21 mm3. Basic 3D UTE and 3D dUTE sequences are faster in providing morphological imaging of the calcified cartilage, with a scan time of around 17 min. However, regular 3D UTE (Fig. 11A) provides a low CNR of 2.19±0.47 between the calcified cartilage and the superficial layers of cartilage and −2.57±0.68 between the calcified cartilage and marrow fat. The 3D dUTE sequence provided significantly improved CNR of 10.31±2.18 between the calcified cartilage and the superficial layers of cartilage. But CNR between the calcified cartilage and marrow fat remains negative, with a value of −1.79±0.54. The 3D dUTE sequence with fat saturation provides a relatively high CNR of 8.69±2.47 between the calcified cartilage and the superficial layers of cartilage, but a low CNR of 1.52±0.49 between the calcified cartilage and marrow fat. In addition, significant reduction in signal was observed in calcified cartilage using the 3D dUTE sequence both without and with fat saturation (thick arrows), probably due to susceptibility artifacts in the second echo.
Fig. 11.
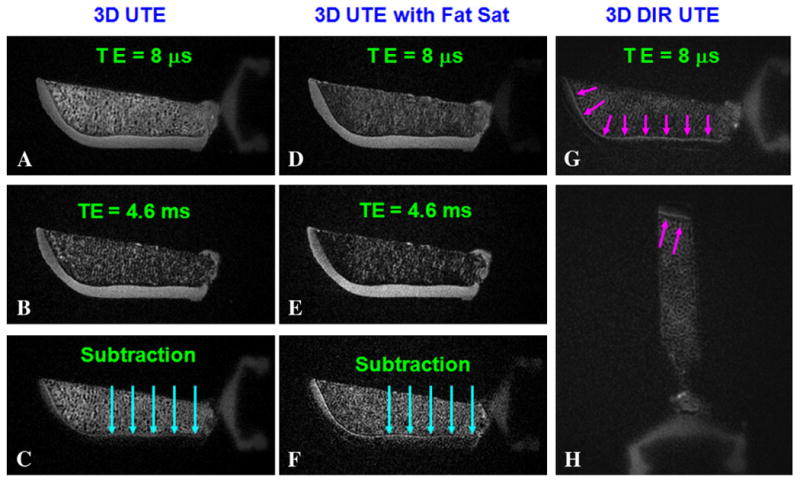
Imaging of a patella specimen using a 3D dUTE sequence with TEs of 8 μs (A) and 4.6 ms (B), and the corresponding echo subtraction (C), 3D dUTE with conventional fat suppression pulse with TEs of 8 μs (D) and 4.6 ms (E), and the corresponding echo subtraction (F). There is significant signal loss in (C) and (F) probably due to susceptibility effects at the cartilage marrow interface (long arrows). The 3D DIR-UTE sequence selectively suppresses signal from the superficial layers of cartilage and marrow fat, and provides good image contrast for calcified cartilage in axial (G) and sagittal (H) reprojections (short arrows).
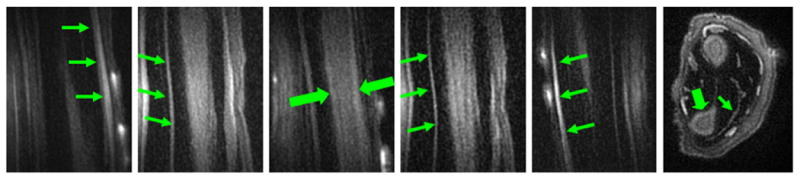
Fig. 12 shows 3D UTE imaging of the tibia midshaft of a cadaveric lower leg specimen using all eight short T2 contrast mechanisms. High contrast was achieved for all but the regular 3D UTE and 3D dUTE techniques. The residual fat signal (arrows) appears bright with 3D sUTE and 3D sdUTE sequences, demonstrating that the saturation approach is sensitive to B1 inhomogeneity and susceptibility. In contrast, both fat and muscle were more uniformly suppressed with the 3D SIR-UTE and 3D DIR-UTE sequences, confirming that adiabatic inversion pulse allows more uniform long T2 suppression. Fig. 13 shows selected images of the Achilles tendon of an ankle specimen using 3D dUTE, 3D sUTE and 3D SIR-UTE. Clearly, the 3D dUTE approach is more efficient than the 3D sUTE approach. The 3D SIR-UTE is much less efficient because of significant short T2 signal attenuation due to the adiabatic IR pulse.
Fig. 12.
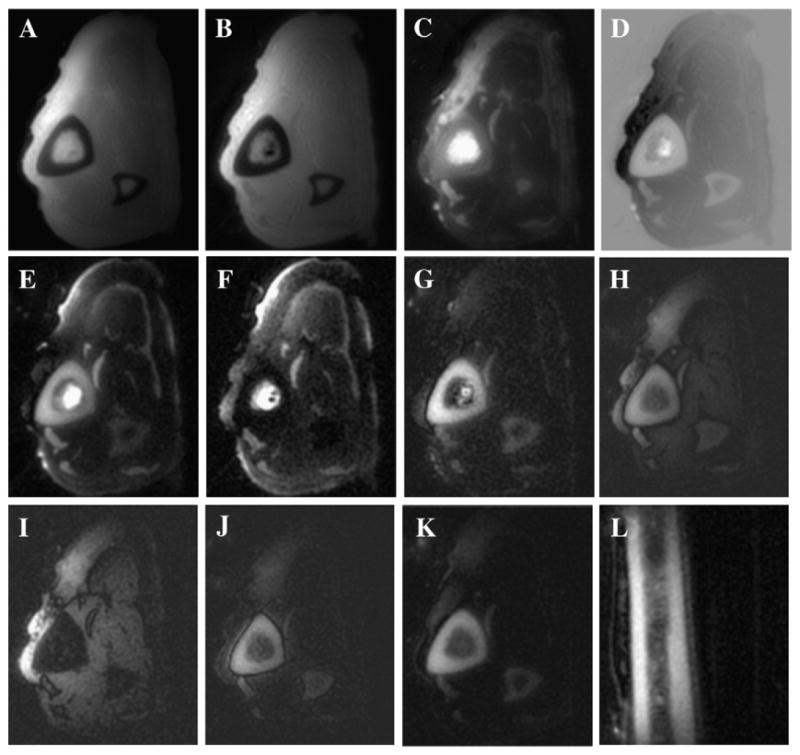
Imaging of the tibia of a cadaveric leg specimen using 3D dUTE with a TE of 8 μs (A) and 2.2 ms (B), regular echo subtraction (C), rescaled echo subtraction (D), 3D sUTE with a TE of 8 μs (E) and 2.2 ms (F), 3D sdUTE (G), 3D SIR UTE with a TE of 8 μs (H) and 2.2 ms (I), 3D SIR dUTE (J) and 3D DIR UTE in the axial (K) and sagittal (L) plane.
Fig. 13.
Imaging of the Achilles tendon of a cadaveric ankle specimen using 3D dUTE with a TE of 8 μs (A) and 2.2 ms (B), regular echo subtraction (C), 3D sUTE (D) and 3D DIR UTE (E).
4. Discussion
We have demonstrated that high contrast images of a variety of short T2 tissues can be generated with 3D UTE techniques using different contrast mechanisms. The success of these techniques relies on the following factors. Firstly, the short TE of 8 μs allows short T2 signal to be detected. Secondly, suppression of long T2 signals through echo subtraction, rescaled subtraction, long T2 saturation, single or dual adiabatic inversion recovery or combinations of these provides high contrast images of the short T2 species. Thirdly, undersampling of the half projections can be used to greatly reduce the scan time without significant problems due to streak artifacts which have diffuse aliasing patterns [12,29].
The dual echo acquisition and echo subtraction technique is a simple but time-efficient approach for many short T2 species such as the tendons, aponeuroses, menisci, ligaments and soft tissue calcification. It allows relatively rapid 3D imaging with high isotropic spatial resolution and volumetric coverage. Short and ultrashort T2 image contrast may be degraded by residual long T2 water and fat signals due to signal decay if the echo spacing is relatively long. Shorter echo spacings reduce this problem, but this requires a shorter data sampling window or smaller acquisition matrix size, and so limits spatial resolution. In addition, it is difficult to apply this technique to image cortical bone which has a very low proton density. These problems can be partially resolved by scaling up the second image or scaling down the FID image so that more complete long T2 signal cancellation can be achieved [18]. Furthermore, the second image can be rescaled higher or the FID rescaled lower so that the long T2 water and fat signals become higher on the second image than on the FID image [23]. Subtraction of the second image from the FID image provides negative signal intensities for long T2 water and fat, leaving high positive signal intensities and image contrast for short T2 species. However, the positive short T2 contrast may be partly or completely lost when absolute intensity values are used. The 3D UTE-RS approach can resolve this problem and provide high contrast for short T2 species as demonstrated in Fig. 6.
Long T2 signal suppression using a long 90° saturation pulse followed by crusher gradients has long been employed for short T2 imaging [19,20]. The saturation pulse is typically a long duration square, Gaussian or SINC pulse with low amplitude so that the short T2 magnetization experiences significant transverse relaxation during the saturation process. Long duration square pulses with low amplitude are efficient at preserving the short T2 magnetization. However, their narrow bandwidth makes them very sensitive to off-resonance effects and may compromise the efficiency of long T2 suppression in in vivo applications. Tailored single-band suppression pulse and dual-band suppression pulses have been proposed to provide more efficient long T2 suppression [14]. The combination of a Gaussian pulse for water suppression and spectral presaturation by inversion recovery (SPIR) for fat suppression has also been proposed for 3D UTE imaging of the Achilles tendon and ligaments [18]. The use of two narrow band preparation pulses for water and fat suppression may increase sensitivity to off-resonance effects as well as short T2 signal degradation [11]. We employed a single long duration Gaussian pulse centered at −220 Hz to partially invert and null long T2 water and fat, respectively. The Gaussian pulse has a bandwidth of 1 kHz and is therefore relatively insensitive to off-resonance effects. This approach is sensitive to B1 inhomogeneity, which may result in an imperfect nulling time and significant residual signals from long T2 water and fat. However, the residual signals may be effectively suppressed by dual echo acquisition and echo subtraction, as shown in Fig. 8.
Adiabatic inversion pulses from the hyperbolic secant family have been frequently employed for long T2 suppression in UTE imaging of the short T2 components in white matter of the brain and tissues of the musculoskeletal system [1,2,7,8]. The performance of adiabatic inversion pulses may be significantly reduced at off-resonance frequencies. In our study, the adiabatic inversion pulse was made nonselective to avoid this off-resonance problem. Inversion recovery techniques are usually used with a relatively long TR to allow the inverted long T2 magnetization to reach the null point. This may significantly increase the total scan time and reduce the SNR efficiency. Furthermore, only one specific T1 magnetization can reach the null point for each TR and TI combination, which may result in imperfect suppression of long T2 species with quite different values of T1, such as muscle and fat. More complete suppression can be achieved with the DIR UTE approach where two separate long adiabatic inversion pulses are employed to invert and null long T2 water and fat, respectively [27]. The 3D DIR UTE technique can generate excellent image contrast, as shown in Fig. 11. The calcified and deep radial layers of cartilage can be specifically imaged with this approach when signals from long T2 water (the superficial layers of cartilage) and marrow fat are efficiently suppressed. Although the 3D SIR-UTE and DIR-UTE approaches may create high image contrast for short T2 tissues, the associated long scan time may limit clinical applications. Strategies such as multiple projection acquisition followed by one long T2 suppression pulse or pulse cluster may significantly reduce the total scan time and will be investigated in the future.
Compared to 2D UTE imaging, 3D techniques can provide isotropic spatial resolution and volumetric coverage and help in evaluating the complex structures. They may permit more accurate measurement of short T2 tissue properties such as T1, T2*, T2 and T1rho relaxation times and bulk water content by reducing partial volume effects and out-of-slice long T2 signal contamination.
There are several limitations of this study. Firstly, we did not perform a systematic comparison of the different approaches in imaging all the short T2 tissues in terms of SNR and CNR efficiency. We only qualitatively compared these techniques in imaging cortical bone and the Achilles tendon of cadaveric specimens. Different short T2 species may require different approaches to achieve optimal image contrast, depending on the relaxation times (T1 and T2*) and mobile proton density of the short T2 species as well as the surrounding long T2 species. Secondly, there are other short T2 contrast mechanisms such as single- or dual-band suppression pulse [14], adiabatic inversion with signal summation [7], SPIR [18] and outer-volume presaturation [15] which may also be effective. Thirdly, in some cases, the principle was demonstrated but scan time was too long for routine clinical use. The use of other sampling strategies, such as 3D cones trajectory [12], may significantly reduce the total scan time at the cost of increased short T2 blurring. Fourthly, there are several technical challenges related with 3D UTE imaging including errors in the radial k-space trajectories and off-resonance effects. Radial trajectories are sensitive to eddy current, gradient nonlinearity, field inhomogeneity and susceptibility effects [5]. Image quality can be improved through calibration of the sampling k-space trajectories, especially for later echoes in multiecho 3D UTE acquisitions [30]. The combination of trajectory measurement and field map corrections has been demonstrated to improve the robustness of non-Cartesian data acquisitions [31,32]. Its application to 3D UTE imaging will be investigated in future work.
In conclusion, the 3D UTE data acquisition together with a variety of short T2 contrast mechanisms can be used to image short T2 species with high spatial resolution, broad coverage and high contrast on a clinical 3T scanner.
Acknowledgments
This study was supported, in part, by GE Healthcare, the RSNA (the Agfa Heathcare/RSNA Research Scholar) and NIAMS 1R21AR057901-01A1.
References
- 1.Gatehouse PD, Bydder GM. Magnetic resonance imaging of short T2 components in tissues. Clin Radiol. 2003;58:1–19. doi: 10.1053/crad.2003.1157. [DOI] [PubMed] [Google Scholar]
- 2.Robson MD, Gatehouse PD, Bydder M, Bydder GM. Magnetic resonance: an introduction to ultrashort TE (UTE) imaging. J Comput Assist Tomogr. 2003;27:825–46. doi: 10.1097/00004728-200311000-00001. [DOI] [PubMed] [Google Scholar]
- 3.Gold GE, Pauly JM, Macovski A, Herfkens RJ. MR spectroscopic imaging of collagen: tendons and knee menisci. Magn Reson Med. 1995;34:647–54. doi: 10.1002/mrm.1910340502. [DOI] [PubMed] [Google Scholar]
- 4.Bergin CJ, Pauly JM, Macovski A. Lung parenchyma: projection reconstruction MR imaging. Radiology. 1991;179:777–81. doi: 10.1148/radiology.179.3.2027991. [DOI] [PubMed] [Google Scholar]
- 5.Wanspaura JP, Daniel BL, Pauly JM, Butts K. Temperature mapping of frozen tissue using eddy current compensated half excitation RF pulses. Magn Reson Med. 2001;46:985–92. doi: 10.1002/mrm.1285. [DOI] [PubMed] [Google Scholar]
- 6.Reichert ILH, Robson MD, Gatehouse PD, He T, Chappell KE, Holmes J, et al. Magnetic resonance imaging of cortical bone with ultrashort TE (UTE) pulse sequences. Magn Reson Imaging. 2005;23:611–8. doi: 10.1016/j.mri.2005.02.017. [DOI] [PubMed] [Google Scholar]
- 7.Larson PE, Conolly SM, Pauly JM, Nishimura DG. Using adiabatic inversion pulses for long-T2 suppression in ultrashort echo time (UTE) imaging. Magn Reson Med. 2007;58:952–61. doi: 10.1002/mrm.21341. [DOI] [PMC free article] [PubMed] [Google Scholar]
- 8.Du J, Takahashi A, Bydder M, Chung CB. Two dimensional ultrashort echo time imaging using a spiral trajectory. Magn Reson Imaging. 2008;26:304–12. doi: 10.1016/j.mri.2007.08.005. [DOI] [PubMed] [Google Scholar]
- 9.Jackson J, Nishimura DG, Macovski A. Twisting radial lines with application to robust magnetic resonance imaging of irregular flow. Magn Reson Med. 1992;25:128–39. doi: 10.1002/mrm.1910250113. [DOI] [PubMed] [Google Scholar]
- 10.Glover GH, Pauly JM, Bradshaw KM. Boron-11 imaging with a three-dimensional reconstruction method. J Magn Reson Imaging. 1992;2:47–52. doi: 10.1002/jmri.1880020109. [DOI] [PubMed] [Google Scholar]
- 11.Wu Y, Ackerman JL, Chesler DA, Graham L, Wang Y, Glimcher MJ. Density of organic matrix of native mineralized bone measured by water- and fat-suppressed proton projection MRI. Magn Reson Med. 2003;50:59–68. doi: 10.1002/mrm.10512. [DOI] [PubMed] [Google Scholar]
- 12.Gurney PT, Hargreaves BA, Nishimura DG. Design and analysis of a practical 3D cones trajectory. Magn Reson Med. 2006;55:575–82. doi: 10.1002/mrm.20796. [DOI] [PubMed] [Google Scholar]
- 13.Rahmer J, Bornert P, Groen J, Bos C. Three-dimensional radial ultrashort echo-time imaging with T2 adapted sampling. Magn Reson Med. 2006;55:1075–82. doi: 10.1002/mrm.20868. [DOI] [PubMed] [Google Scholar]
- 14.Larson PE, Gurney PT, Nayak K, Gold GE, Pauly JM, Nishimura DG. Designing long-T2 suppression pulses for ultrashort echo time imaging. Magn Reson Med. 2006;56:94–103. doi: 10.1002/mrm.20926. [DOI] [PMC free article] [PubMed] [Google Scholar]
- 15.Techawiboonwong A, Song HK, Wehrli FW. In vivo M.R.I. of submillisecond T2 species with two-dimensional and three-dimensional radial sequences and applications to the measurement of cortical bone water. NMR in Biomed. 2008;21:59–70. doi: 10.1002/nbm.1179. [DOI] [PubMed] [Google Scholar]
- 16.Boada FE, Gillen JS, Shen GX, Chang SY, Thulborn KR. Fast three dimensional sodium imaging. Magn Reson Med. 1997;37:706–15. doi: 10.1002/mrm.1910370512. [DOI] [PubMed] [Google Scholar]
- 17.Qian Y, Boada FE. Acquisition-weighted stack of spirals for fast high-resolution three-dimensional ultra-short echo time MR imaging. Magn Reson Med. 2008;60:135–45. doi: 10.1002/mrm.21620. [DOI] [PMC free article] [PubMed] [Google Scholar]
- 18.Rahmer J, Blume U, Bornert P. Selective 3D ultrashort TE imaging: comparison of “dual-echo” acquisition and magnetization preparation for improving short-T2 contrast. Magn Reson Mater Phy. 2007;20:83–92. doi: 10.1007/s10334-007-0070-6. [DOI] [PubMed] [Google Scholar]
- 19.Pauly JM, Conolly SM, Macovski A. Suppression of long T2 components for short T2 imaging. Proceedings of the 10th Annual Meeting of SMRI; New York, USA. 1992. p. 330. [Google Scholar]
- 20.Sussman MS, Pauly JM, Wright GA. Design of practical T2-selective RF excitation (TELEX) pulses. Magn Reson Med. 1998;40:890–9. doi: 10.1002/mrm.1910400615. [DOI] [PubMed] [Google Scholar]
- 21.Du J, Hamilton G, Takahashi A, Bydder M, Chung CB. Ultrashort T.E. spectroscopic imaging (UTESI) of cortical bone. Magn Reson Med. 2007;58:1001–9. doi: 10.1002/mrm.21397. [DOI] [PubMed] [Google Scholar]
- 22.Du J, Pak BC, Znamirowski R, Statum S, Takahashi A, Chung CB, et al. Magic angle effect in magnetic resonance imaging of the Achilles tendon and enthesis. Magn Reson Imaging. 2009;27:557–64. doi: 10.1016/j.mri.2008.09.003. [DOI] [PubMed] [Google Scholar]
- 23.Du J, Chung CB, Bydder GM. Ultrashort TE Imaging with rescaled digital subtraction (UTE RDS). Proceedings of ISMRM, 17th Annual Meeting; Hawaii. 2009. p. 3992. [Google Scholar]
- 24.Silver MS, Joseph RI, Hoult DI. Highly selective π/2 and π pulse generation. J Magn Reson. 1984;59:347–51. [Google Scholar]
- 25.Stanisz GJ, Odrobina EE, Pun JH, Escaravage M, Graham SJ, Bronskill MJ, et al. T1, T2 relaxation and magnetization transfer in tissue at 3T. Magn Reson Med. 2005;54:507–12. doi: 10.1002/mrm.20605. [DOI] [PubMed] [Google Scholar]
- 26.Du J, Takahashi AM, Statum S, Biswas R, Chung CB, Bydder GM. Creating short-T2 contrast with three-dimensional ultrashort TE (3D UTE) imaging. Proceedings of ISMRM, 17th Annual Meeting; Hawaii. 2009. p. 843. [Google Scholar]
- 27.Du J, Chung CB, Bydder M, Bae W, Takahashi AM, Bydder GM. Imaging of short-T2 species using a dual adiabatic inversion recovery ultrashort TE (DIR UTE) sequences. Proceedings of ISMRM, 17th Annual Meeting; Hawaii. 2009. p. 4521. [Google Scholar]
- 28.Lane LB, Bullough PG. Age-related changes in the thickness of the calcified zone of the number of tidemarks in adult human articular cartilage. J Bone Joint Surg. 1980;62:372–5. doi: 10.1302/0301-620X.62B3.7410471. [DOI] [PubMed] [Google Scholar]
- 29.Barger AV, Block WF, Toropov Y, Grist TM, Mistretta CA. Time-resolved contrast-enhanced imaging with isotropic resolution and broad coverage using an undersampled 3D projection trajectory. Magn Reson Med. 2002;48:297–305. doi: 10.1002/mrm.10212. [DOI] [PubMed] [Google Scholar]
- 30.Lu A, Daniel BL, Pauly JM, Pauly KB. Improved slice selection for R2* mapping during cryoablation with eddy current compensation. J Magn Reson Imaging. 2008;28:190–8. doi: 10.1002/jmri.21396. [DOI] [PMC free article] [PubMed] [Google Scholar]
- 31.Du J, Bydder M. High resolution time-resolved contrast-enhanced MR abdominal and pulmonary angiography using a spiral-tricks sequence. Magn Reson Med. 2007;58:631–5. doi: 10.1002/mrm.21298. [DOI] [PubMed] [Google Scholar]
- 32.Johnson KM, Lum DP, Turski PA, Block WF, Mistretta CA, Wieben O. Improved 3D phase contrast MRI with off-resonance corrected dual echo VIPR. Magn Reson Med. 2008;60:1329–36. doi: 10.1002/mrm.21763. [DOI] [PMC free article] [PubMed] [Google Scholar]