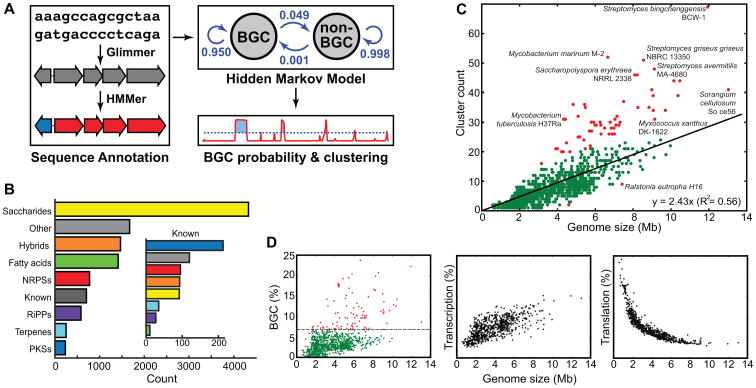
Figure 1. ClusterFinder flowchart and distribution of BGC classes and counts.
a, Flowchart of the four-step BGC prediction pipeline: (i) annotation of a genome sequence and compression to a string of Pfam domains, (ii) calculation of posterior probabilities of a BGC hidden state, (iii) clustering of genes that contain Pfam domain(s) with posterior probabilities of BGC hidden state above the threshold, and (iv) annotation of the predicted BGCs using an expanded version of the antiSMASH algorithm. b, Distribution of BGC classes for known (inset) and predicted BGCs. “Other” gene clusters include gene clusters from other known classes as well as a manually curated set of 1,024 putative gene clusters that fall outside known biosynthetic classes. Unexpectedly, 40% of all predicted BGCs encode saccharides, more than twice the size of the next largest class. c, Number of predicted BGCs by genome size. Most bacterial species follow a linear trend (the equation in the bottom-right corner); outliers (defined as having residuals >8) are colored red. d, The proportions of bacterial genomes devoted to secondary metabolite biosynthesis (left panel; 6.7% of species that devote >7.5% of their genome to biosynthesis are marked red), transcription (middle panel), and translation (right panel).

