

Summary
TCR–pMHC interactions initiate adaptive immune responses, but the mechanism of how such interactions under force induce T-cell signaling is unclear. We show that force prolongs lifetimes of single TCR–pMHC bonds for agonists (catch bonds) but shortens those for antagonists (slip bonds). Both magnitude and duration of force are important as the highest Ca2+ responses were induced by 10 pN via both pMHC catch bonds whose lifetime peaks at this force and anti-TCR slip bonds whose maximum lifetime occurs at 0 pN. High Ca2+ levels require early and rapid accumulation of bond lifetimes whereas short-lived bonds that slow early accumulation of lifetimes correspond to low Ca2+ responses. Our data support a model where force on the TCR induces signaling events depending on its magnitude, duration, frequency, and timing, such that agonists form catch bonds that trigger the T cell digitally, whereas antagonists form slip bonds that fail to activate.
Introduction
T cells use the T-cell receptor (TCR) to recognize antigen in the form of peptide-major histocompatibility complex (pMHC) on antigen-presenting cells (APCs). Recognition is signified by a cascade of intracellular signaling events, starting from phosphorylation of immunoreceptor tyrosine-based activation motifs (ITAMs) on the CD3 subunits, leading to transient rise of intracellular Ca2+, and ultimately resulting in developmental decisions or effect or functions (Smith-Garvin et al., 2009). The current knowledge of this signaling cascade far exceeds our limited understanding of how it is initiated by the TCR–pMHC binding (van der Merwe and Dushek, 2011). In general, T cell responsiveness is determined by TCR–pMHC interaction characteristics (Zhu et al., 2013). Commonly analyzed characteristics of TCR–pMHC interactions include structural features (Rudolph et al., 2006), thermodynamic properties (Krogsgaard et al., 2003), affinity (McMahan et al., 2006), and kinetic rates (Aleksic et al., 2010; Gascoigne et al., 2001). Of interest, in situ kinetic analysis on live T cells (Adams et al., 2011; Huang et al., 2010; Huppa et al., 2010; Jiang et al., 2011; Liu et al., 2014; Sabatino et al., 2011) often more accurately describes T-cell response outcomes than those based on purified TCR (Gascoigne et al., 2001).
TCR–pMHC interactions are mostly measured under force-free conditions. These include three-dimensional (3D) measurements by surface plasmon resonance (SPR) and recent 2D measurements by micropipette adhesion assay and thermal fluctuation assay (Zhu et al., 2013). However, TCR–pMHC bonds formed across the T-cell–APC interface are likely subjected to mechanical forces (Chen and Zhu, 2013; van der Merwe and Dushek, 2011; Wang and Reinherz, 2012). Tension may be induced in short TCR–pMHC bonds when they bridge across the T-cell–APC junction to exclude larger molecules from the contact zone (Davis and van der Merwe, 2006). Tensile force may also be exerted on TCR–pMHC bonds when T-cell and APC membranes slide relative to each other during cell motility (Mempel et al., 2004). Force from actin polymerization may be transmitted to TCR through oscillations of the distal zone of immunological synapses (IS) and kinapses (Ilani et al., 2009; Sims et al., 2007). Similarly, force may be applied on TCR when actin retrograde flow and myosin II-dependent contraction cooperatively transports microclusters engaged with pMHC from the periphery toward the IS center (Ilani et al., 2009; Mossman et al., 2005). Restricting transport of TCR microclusters with nano-barriers enhances T-cell signaling, possibly by increasing force on the TCR (Mossman et al., 2005). Another observation implicating force on TCR–pMHC bonds is that T cells extract and internalize pMHC from the APC (Huang et al., 1999).
The role of mechanical force has been supported by direct evidence that force on TCR induces intracellular Ca2+ flux (Kim et al., 2009; Li et al., 2010). Using optical tweezers-trapped beads bearing pMHC or anti-CD3 to engage the TCR, Kim et al. found that sinusoidal forces tangential but not normal to the cell surface triggered calcium flux (Kim et al., 2009). Using a micropipette-driven flow to apply forces on T cells in contact with anti-CD3 expressing APCs, Li et al. reported that Ca2+ was triggered by both tangential and normal forces on CD3 subunits (Li et al., 2010). These studies demonstrated that force on TCR/CD3 can trigger T cell signaling. However, important questions remain unanswered. How does force affect TCR–pMHC bond dissociation? Does force regulate T cell antigen recognition and discrimination, and if so, how and what attributes of force are important? Can force applied over a single TCR–pMHC binding event trigger T-cell signaling or is accumulation of a series of such events necessary? How does the signaling outcome depend on the pattern of serial force applications?
To address these questions, we analyzed the in situ kinetics of TCR–pMHC interactions using a biomembrane force probe (BFP) (Chen et al., 2008b). Unlike our previous study, which measured 2D kinetics at zero-force (Huang et al., 2010), the present work investigated the dependence of kinetics on force by controlling the force and the timing of T-cell–APC contact/separation. With concurrent Ca2+ imaging, we simultaneously observed Ca2+ signals in live T cells induced by force on the TCR. This allowed us to delineate the relationships among force attributes, bond characteristics, and signaling outcomes, thereby defining the role of force at the earliest protein interaction to provide new insights on T-cell antigen recognition, discrimination, activation, and antagonism.
Results
TCR forms agonist-specific catch bonds with pMHC
Using a BFP, we measured 2D single-bond lifetimes under a range of constant forces applied via a pMHC engaged to a TCR on a naïve T cell from OT1 transgenic mice. The BFP uses a micropipette-aspirated human red blood cell (RBC) with a glass bead (probe bead) attached to its apex as a force transducer (Figure 1A, left). The probe bead was coated with pMHC to serve as a surrogate APC (Figure 1B, left). To focus on the TCR–pMHC interaction, the MHC was mutated to prevent CD8 binding (Huang et al., 2010).
Figure 1. In situ analysis of force-dependent TCR–pMHC bond kinetics by BFP.

(A) BFP schematic. A micropipette-aspirated RBC with a probe bead attached to the apex (left) was aligned against a T cell held by an apposing pipette (right). (B) BFP functionalization. The probe bead was covalently linked to streptavidin (SA) to capture pMHC (left) to interact with TCR (right). (C–E) Representative force traces of measurement cycles showing adhesion that survived ramping and sustained a preset level of force until dissociation (marked by a red star), enabling bond lifetime measurement (C), adhesion ruptured by a ramp force (marked by a magenta star) before reaching the set force or in force-ramp assay (D), or no adhesion (E). (F) Binding specificity. Mean ± s.e.m. of adhesion frequencies of >10 T-cell–bead pairs with 50 contacts for each. Densities of pMHCs (ml) are indicated inside of each bar. N.D. = not detected. See also Figure S1 and Movie S1–S3.
Bond lifetimes were measured by a force-clamp assay (Marshall et al., 2003) in repetitive cycles. In each cycle, a micropipette-aspirated T cell (Figure 1A, right) was driven to contact the probe bead to prompt bond formation. Contact was brief (0.1 s) to minimize multi-bond formation. Via T-cell retraction, a tensile force on the TCR–pMHC bond was ramped (at 1000 pN/s) to and clamped at a preset level until bond dissociation (Figure 1C and Movie S1). Bond lifetime was measured as the force-clamp period. Some bonds might fail before reaching the clamp phase, and in force-ramp experiments, force was ramped until bond failure; neither case produced a lifetime (Figure 1D and Movie S2). When no bond was present at the time of T-cell retraction, no tensile force would result (Figure 1E and Movie S3). To ensure that most binding events were mediated by single bonds, adhesion frequencies (number of adhesions divided by number of contacts) were kept low (<20%) by adjusting the pMHC density on the probe bead (Chesla et al., 1998) (Figures 1F and S1A). T-cell adhesion was not detected when probe beads were coated with a null pMHC or no pMHC, demonstrating binding specificity (Figures 1F and S1A). The measured lifetimes were for TCR–pMHC bonds rather than biotin–SA bonds used to couple the pMHC to the bead because they are two-orders of magnitude shorter than the biotin–SA bond lifetimes (Figure S1B). Using monovalent SA (Howarth et al., 2006) to capture pMHC resulted in a similar bond lifetime at 10 pN as tetravalent SA (Figure S1B), indicating that the force regulation of TCR–pMHC bond lifetime was not caused by potential multimeric interactions.
Off-rates of TCR–pMHC dissociation can be estimated from the reciprocal average bond lifetimes (Marshall et al., 2003) (Figure 2A). Previously, we used the thermal fluctuation assay (Chen et al., 2008a) (Figures S1C and S1D) and the adhesion frequency assay (Chesla et al., 1998) to measure the zero-force off-rates of TCR dissociation at the OT1 T cell surface from a panel of altered peptide ligands ranging from agonist to antagonist (Huang et al., 2010). We found that the more stimulatory the peptide, the shorter the 2D bond lifetime at zero force (Figure 2A, open bar). This contrasts with their 3D counterparts measured with soluble proteins by SPR (Alam et al., 1996) and with the prediction of the original kinetic proofreading model (McKeithan, 1995). Remarkably, this trend was reversed by a 10-pN force on the TCR–pMHC bond, such that the more stimulatory the peptide, the longer the bond lifetime (Figure 2A, close bar). This occurs because agonist pMHCs form catch-slip bonds (Marshall et al., 2003) with the TCR with biphasic bond lifetimes that first increase, reach a maximum, and then decrease with increasing force (Figures 2B and S2A–C). Interestingly, the more stimulatory the peptide, the more pronounced the catch bond, which requires a greater force to produce the maximal lifetime that also is longer (Figure 2B). By comparison, antagonist pMHCs form slip bonds (Marshall et al., 2003) with monotonically decreased bond lifetimes as force increases (Figures 2C, S2D, and S2E). Thus at >5 pN force, TCR bonds with the most stimulatory agonist are the longest while those with progressively less biologically active ligands are progressively shorter (Figures 2B and 2C). Catch bonds are not isolated characteristics of the OT1 system; the 2C TCR also formed catch bonds with its agonist pMHC (Figure S2F).
Figure 2. TCR forms agonist-specific catch-slip bond.
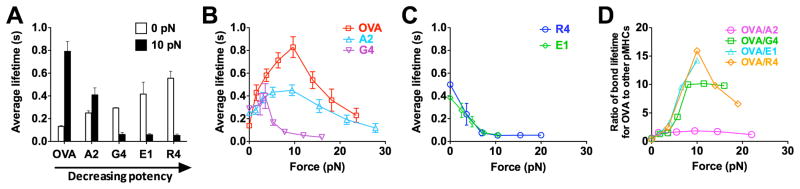
(A) Lifetimes of bonds of OT1 T-cells with probe beads coated with indicated pMHCs at 0 (white) and 10 (black) pN. (B and C) Lifetime vs. force curves showing that OT1 TCR formed catch-slip bonds with progressively weaker agonists OVA (red open square), A2 (light blue open triangle), and G4 (inverted magenta open triangle) (B) but slip-only bonds with antagonists R4 (blue open circle) and E1 (green open diamond) (C). (D) Force regulation of antigen discrimination, measured by the average lifetime ratio of TCR bonds with OVA to another peptide. See also Figure S2.
Our results reveal catch bonds as a mechanism for mechanical regulation of antigen discrimination by the TCR. The ratios of OT1 TCR–pMHC bond lifetime for the agonist OVA to those for other peptides depend on force biphasically, with maxima at 10 pN (Figure 2D). At this force level, the ratio for the strongest (OVA) to the weakest (R4) pMHC becomes 57-fold greater than its value at zero force. Thus, force substantially increases the power of antigen discrimination.
Optimal force triggers Ca2+ by prolonging TCR–pMHC lifetime via catch bond
To evaluate how the force-regulated pMHC dissociation from and discrimination by the TCR relates to T-cell signaling, we added a fluorescence optical path to our BFP (fBFP, Figure S3A) and simultaneously measured bond lifetime and Ca2+ flux (Figure 3). For each T cell, the force-clamp cycle was repeated for 10 min; concurrently, intracellular Ca2+ was observed using fura-2 ratiometric imaging. Two types of Ca2+ signals were identified: type α curves have an initial latent phase of 1–3 min before the fura-2 ratio rapidly increased >150% of the initial baseline followed by decay (Figures 3A, 3C, and Movie S4); type β curves stayed near the baseline or gradually increased to modest levels (Figures 3B, 3D, and Movie S5). To examine how various attributes of force impact T-cell triggering, we analyzed their correlations with the maximal percent Ca2+ increase. The area under the Ca2+ curve provided another metric that correlated well with the maximal response (Figure S3B). Note that our experiments differ from previous studies (Huse et al., 2007; Purbhoo et al., 2004) in that Ca2+ was induced by intermittent single TCR–pMHC bonds formed infrequently and sequentially (Figures 3C and 3D) in the absence of any other receptor–ligand engagement. While Ca2+ can certainly be induced under more favorable conditions (Kim et al., 2009; Li et al., 2010), our rigorous conditions allowed determination of the minimum requirements for Ca2+ induction.
Figure 3. Single-cell concurrent measurement of Ca2+ flux and in situ TCR–pMHC bond kinetics.

(A–B) Representative wide-field pseudo-colored images of two types of intracellular Ca2+ signals. (C–D) Representative time courses of relative fura-2 ratio of type α (C, magenta curve, left ordinate) or type β (D, green curve, left ordinate) intracellular Ca2+ signal synchronized with concurrent measurement of rupture (red open circle) and lifetime (blue solid triangle) events and the cumulative lifetime (blue dashed curve, right ordinate). Note that there is no rupture events for Panel (C). A dashed-dot horizontal line indicates a 10-s threshold of cumulative lifetime. See also Figure S3.
Clamped cycles of forces on TCR via OVA resulted in robust Ca2+ (Figure 4A,
 ). In contrast, force-ramp cycles generated only baseline Ca2+( Figure4A,
 ) similar to the null pMHC control ( Figure4A,
 ). Ca2+ triggering was peptide -dependent: pulling via the weaker ligand G4 using the same force-clamp cycles failed to induce Ca2+(Figure 4A,
 ). The triggering was also TCR-specific:pulling another T -cell surface molecule (LFA-1) via an antibody did not trigger Ca2+, despite much longer bond lifetimes (Figure 4A,
 , and Figure S2G).
Figure 4. TCR- and pMHC-specific Ca2+ flux requires both force and lifetime.
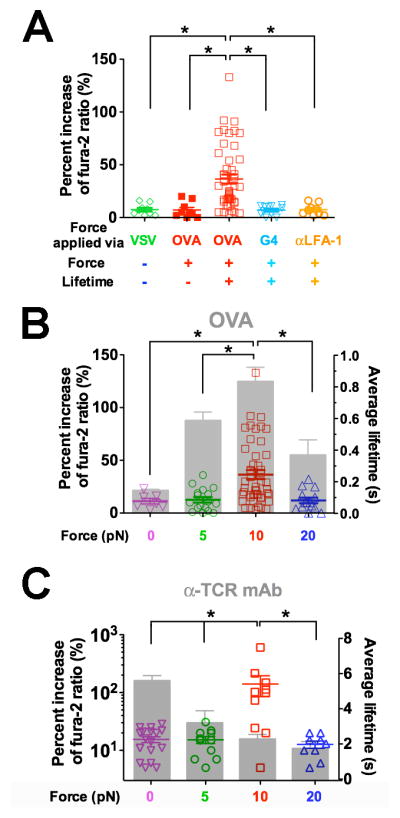
(A) Ca2+ flux requires durable force on TCR bond applied by antigen pMHC. Percent increase of fura-2 ratio in OT1 T cells tested without force or lifetime via VSV (green open diamond, cf. Figure 1E), with force but no lifetime via OVA (red solid square, cf. Figure 1D), or with both force and lifetime (cf. Figure 1C) via OVA (red open square) or G4 (inverted light blue open triangle) or via anti-LFA-1 beads (orange open circle). (B–C) Ca2+ was triggered by an optimal force. Percent increase of fura-2 ratio (points, left ordinate) in OT1 T cells triggered by lifetimes (grey bars, mean ± s.e.m. of >50 measurements, right ordinate) of TCR bonds with OVA (B) or anti-OT1 (C) measured at 0 (inverted magenta open triangle), 5 (green open circle), 10 (red open square), or 20 (blue open triangle) pN force. * denotes p < 0.01 on Ca2+ signals.
The triggering of Ca2+ by OVA but not G4 (Figure 4A) might be due to the longer lifetimes of TCR bonds with OVA than G4 under force. We therefore examined the correlation of signaling and lifetime by measuring Ca2+ at 5, 10, and 20 pN with force-clamp cycles and at 0 pN with the thermal fluctuation cycles using either OVA or anti-TCR to form serial bonds with OT1 TCRs. The biphasic pattern of calcium vs. force matched the catch-slip bond lifetime vs. force pattern for OVA (Figure 4B), suggesting that the duration of force is important for T-cell signaling. By comparison, the TCR–antibody interaction behaved as a slip-only bond, not matching the calcium pattern that was also biphasic (Figure 4C). It is remarkable that similar patterns and optimal forces (10 pN) where calcium reached maximum were observed for both pMHC (Figure 4B) and antibody (Figure 4C) in spite of their distinct patterns and magnitudes of lifetime. At 20 pN, the anti-TCR bond lifetime was still twice longer than the maximal TCR–pMHC bond lifetime (at 10 pN). Yet, neither 0 nor 20 pN of force induced calcium. Thus, to trigger T cells requires a force of optimal magnitude and sufficient duration on the TCR. The results further support the mechanism for antigen discrimination via the TCR, as agonist-specific catch bonds prolonged lifetime under optimal force and triggered most effective T-cell signaling.
Ca2+ correlates with duration of pMHC binding events
We asked whether the variable calcium responses observed under identical experimental conditions were due to the heterogeneity in the cells or in the ways they were triggered (e.g. Figure 4B,
). Although the monoclonal OT1TCR was used to reduce population heterogeneity, individual T cells were still likely triggered differently because TCR–pMHC interactions are stochastic at the single-bond level(see Figures 3C and 3D).F or any contact between a T cell and a pMHC-coated bead, it is impossible to know a priori whether a bond would form, whether it would survive force ramping to the clamped level, or its life time. Nevertheless, the probabilistic characteristics of a stochastic sequence of such random events are governed by the kinetic properties of the TCR–pMHC interaction, which can be extracted by analysis of an ensemble of these events( Figure 2). The correlation between calcium and the force-regulated TCR–pMHC bond lifetime evaluated from ensemble analyses (Figure 4) suggests a causal relationship between the Ca 2+ level and the kinetic parameters underlying the binding events. We thus measured various kinetic-associated statistics from each cell ’s actual binding sequence(Figures 3C and 3D) and examined their correlation with Ca 2+(Figure 5).
Figure 5. Correlating Ca2+ signals with kinetic-associated statistics from each cell’s 600-s event sequence.

(A–F) Percent increase of fura-2 ratios vs. number of adhesions Na (A), number of lifetimes Nlt (B), adhesion frequency Pa (C), average lifetime <t> (D), longest lifetime tmax (E), and cumulative lifetime Σti (F) of OT1 TCR bonds with OVA at 0 (brown solid square), 5 (orange open square), 10 (magenta open circle or green open triangle, for type α or β Ca2+, respectively) or 20 (inverted open red triangle) pN, or with G4 at 0 (yellow solid diamond) or 10 (light blue open diamond) pN for each T-cell calculated from the binding events in the entire 10-min experimental period. Dashed lines are linear fits to data. The Pearson coefficient of the correlation (R) is indicated in each subpanel. (G) Summary of Pearson coefficients.
These statistics were grouped into event counting parameters that relate to affinity, including the number of adhesions, number of lifetimes and adhesion frequency, or into event duration parameters that relate to off-rate, including average lifetime, longest lifetime, and cumulative lifetime. Correlation was not evident with event counting parameters (Figures 5A–C), as shown by their low Pearson coefficients (Figure 5G). In contrast, event duration parameters, especially the average lifetime, correlated with Ca2+ (Figures 5D–G). Thus, correlative analysis of the small number statistics collected from individual cells (cf. Figures 3C and 3D) identifies the same best predictor of calcium response (Figure 5D) as the population analysis (Figure 4B).
Ca2+ best correlates with total lifetime accumulated in the first minute
Early binding events likely contributed most to Ca 2+ onset, which appeared mostly after 1 min of the 10-min experimental period. We therefore tested whether excluding the later events from the parameter estimations would improve their correlations. Reducing the window size (TL, Figure 6A), which excludes progressively later events from the 10-min experiment did not affect the qualitative observations of the preceding section. Event counting parameters still correlated poorly with Ca2+, whereas event duration parameters performed much better (Figures 6B and S4), with all Pearson coefficients reaching their maxima at TL < 100 s (Figure 6D). Interestingly, the cumulative bond lifetime now displays the best relationship to Ca2+ (Figures 6B, 6D, S4D, and S4E). This suggests that a long-lasting TCR–pMHC bond may be unnecessary for inducing calcium, as proposed by the original kinetic proofreading model (McKeithan, 1995). Shorter-lived and intermittent pulls on the TCR may accumulate sufficient lifetimes for T-cell triggering (Zhu et al., 2013). Further, as the window size increased, the Pearson coefficients for the event duration parameters first increased, reached maxima at 60 s, and then decreased (Figures 6E, S5D, and S5E). In the 60-s window, all 13 cells with a cumulative lifetime >10 s fluxed type α Ca 2+ (Figure 6B, highlighted center panel,
 ); these all occurred with 10-pN force-clamp to generate the longest average bond lifetime (Figure 2B). By comparison, only type β Ca 2+ was observed in 34 T cells that were also engaged with OVA pMHC by 10-pN force-clamp but accumulated <10 s bond lifetime (Figure 6B, highlighted center panel,
 ). Thus, single-cell analysis reveals that Ca2+ response is digital( Altan-Bonnet and Germain, 2005; Mukhopadhyay et al., 2013) with a threshold of 10-s total lifetime, an optimal 60-s window, and zero time-delay of accumulation for Ca2+ triggering. The optimal initial 60-s window suggests a kinetic mechanism for efficient antigen scanning: T cells in vivo would lose interest in an APC after short initial contact times (presumably from endogenous pMHCs on the APC) whereas effective serial engagement with cognate antigen that generated longer cumulative bond lifetimes would deliver a timely stop signal for the T cell to appropriately act upon.
Figure 6. Ca2+ best correlates with TCR–pMHC bond lifetimes accumulated in the first minute of successive force applications.

(A) Schematic of a sliding window (highlighted), starting at T0 with length TL and containing different binding events (red: no adhesion; green: rupture force; blue: lifetime). (B and C) Percent increase of fura-2 ratio vs. cumulative lifetime of OT1 TCR bonds with OVA at 0 (brown solid square), 5 (orange open square), 10 (magenta open circle or green open triangle, for type α or β, respectively) or 20 (inverted open red triangle) pN, or with G4 at 0 (yellow solid diamond) or 10 (light blue open diamond) pN for each T cell accumulated in windows of indicated lengths and starting times. Dashed lines are linear fits to data and the Pearson coefficients (R) are indicated. The horizontal and vertical dotted lines in the subpanel with the best correlation (highlighted) denote the demarcation of types α (magenta open circle) and β (brown solid square, orange open square, green open triangle, inverted open red triangle, yellow solid diamond, light blue open diamond) Ca2+ and the 10-s threshold of cumulative lifetime for triggering type α Ca2+. (D–F) Pearson coefficient analysis to search for the window for the kinetic parameters to achieve the best correlation with Ca2+. (D) Maximal Pearson coefficients Rmax vs. TL of the initial window (T0 = 0) within which the kinetic parameters best correlate with Ca2+. (E) Pearson coefficient for cumulative lifetime vs. sliding window size TL for the indicated starting times T0. (F) Pearson coefficients for indicated kinetic parameters calculated in a 60-s sliding window vs. its starting time T0. Different symbols in (D and F) denote number of adhesions Na (purple open circle), number of lifetimes Nlt (magenta open square), adhesion frequency Pa (blue open triangle), average lifetime <t> (green solid square), longest lifetime tmax (orange solid circle), and cumulative lifetime Σti (inversted red solid triangle).
Long lifetimes accumulated after many brief forces fail to induce Ca2+
The optimal time for the Pearson coefficient for the cumulative lifetime to reach maximum is 60-s. This suggests that Ca2+ is most effectively induced by rapid accumulation of signaling intermediates that are generated by durable forces on the TCR prior to the Ca2+ onset. However, after the initial minute, the correlation decreased despite the increased window size and cumulative lifetimes (Figure 6B and 6E). To further investigate the changing efficacy of successive forces on intermittent TCR–pMHC bonds, we analyzed different 60-s windows across the 10-min experimental period starting at progressively later times (Figures 6A, 6C, and S5). Remarkably, as T0 (window starting time, cf. Figure 6A) moved to later times, the Pearson coefficients decreased for all parameters regardless of the window size (Figures 6E, 6F, and S6). These data correlate with, but did not explain, the absence of Ca2+ onset after 3 min. Both observations were at odds with the continued formation and lifetime accumulation of TCR–pMHC bonds after the first minute.
Indeed, some cells accumulated exceedingly long lifetimes in later 60-s windows, yet did not flux calcium (e.g. Figures 3D, 7A, and S7A). In fact, the cells that did not flux calcium and exceeded the 10-s cumulative lifetime threshold at later windows outnumbered the cells that fluxed type α Ca2+ and reached the same threshold in the initial 60-s window (Figure 7B,
 and
, 16 and 13 cells designated as groups B and A, respectively). This is consistent with the worsened correlation when Ca 2+ was plotted vs. accumulated lifetime in 60-s windows for different starting times to enable maximal accumulation for all cells (compare Figures 6B and 7B).
and
, 16 and 13 cells designated as groups B and A, respectively). This is consistent with the worsened correlation when Ca 2+ was plotted vs. accumulated lifetime in 60-s windows for different starting times to enable maximal accumulation for all cells (compare Figures 6B and 7B).
Figure 7. Long TCR–pMHC bond lifetime accumulated after many short ones fails to induce Ca2+.

(A) Maximal cumulative lifetime max{Σti} of TCR bonds with OVA at 0 (brown solid square), 5 (orange open square), 10 (magenta open circle or green open triangle, for type α or β Ca2+, respectively) or 20 (inverted red open triangle) pN, or with G4 at 0 (yellow solid diamond) or 10 pN (light blue open diamond) for each T cell accumulated in a 60-s window vs. its starting time T0. (B) Percent increase of fura-2 ratio vs. maximal cumulative lifetime max{Σti} calculated for each cell in its own 60-s window with starting time adjusted to allow Σti to achieve maximum. Demarcation of 50% increase of fura-2 ratio and threshold of 10-s cumulative lifetime (horizontal and vertical red dotted lines) are used to segregate cells into three groups. Group A cells accumulated >10 s lifetime in the initial 60-s window and generated type α Ca2+ (magenta open circle). Group B cells accumulated >10 s lifetime in later 60-s windows but generated type β Ca2+ (light blue open square). Group C cells accumulated <10 s lifetime and generated type β Ca2+ (green open triangle). Dashed lines in (A and B) are linear fits to data with R-values indicated. (C–F) Normalized lifetime histogram (C and E) and number (left ordinate) and fraction (right ordinate) of short lifetimes (D and F) before Ca2+ peak pooled from cells in groups A (magenta) and B (cyan). (E and F) are similar to (C and D) except that lifetimes were collected from an initial 60-s window for group A; but for group B the starting time was adjusted for each cell to allow Σti to achieve maximum.
The event duration parameters in any 60-s window achieved maxima at different starting times for different cells. These starting times occurred randomly across the 10-min experiment for all cells but concentrated in the initial 1–3 min for group A cells (Figures 7A, S7E, and S7F). This further emphasizes the importance of early accumulation of long lifetimes for Ca2+ induction. To delineate differential stimulations received by the groups A and B cells, we analyzed the distributions of individual lifetimes before the maximum Ca2+ level, using the peak average lifetime (0.8 s) at 10 pN (cf. Figure 2B) to classify short vs. long lifetimes. Compared to group A cells and on a per cell basis, group B cells had many more but far shorter lifetimes (Figure 7C). Further, group B cells had a greater number (32 vs. 4 per cell) and a higher fraction (72% vs. 46%) of short lifetimes than group A cells (Figure 7D). To account for the much longer times it took to reach Ca2+ maxima for group B than group A cells, we compared the lifetime distributions within the initial 60-s window for the group A cells and the corresponding 60-s windows with the maximal cumulative lifetimes for the group B cells (to include their longer yet later bond lifetimes). The distribution of group A cells is dominated by long lifetimes with a much smaller short lifetime subpopulation (Figure 7E). In sharp contrast, lifetimes of the group B cells show an equally populated bimodal distribution with similar long lifetime subpopulations but a larger subpopulation and higher fraction of short lifetimes compared to group A cells (Figures 7E and 7F). Since group B cells did not lack long lifetimes (only that these lifetimes were accumulated in later 60-s windows), their inability to flux calcium might result from their early short lifetimes. Early and frequent applications of non durable forces may desensitize the TCR or generate negative signals that prevent later response. The concept of early short lifetimes desensitizing the TCR or generating negative signals can offer a potential mechanism for antagonism, as TCR bonds with antagonist pMHCs were short-lived (Gascoigne et al., 2001; Kersh et al., 1998). This is especially true under force, as antagonists–E1 and R4–formed short-lived slip bonds with the OT1 TCR (Figures 2A and 2C).
Discussion
Our study has elucidated how force regulates TCR–pMHC bond dissociation, determined the magnitude and the duration of force necessary for T-cell Ca2+ triggering, and revealed the optimal force-dependent TCR–pMHC kinetic parameter for T-cell triggering. We have also shown that, by eliciting antigen-specific catch bonds, force amplifies the power of antigen discrimination by separating agonist pMHCs that induce catch bonds from less biologically active pMHCs that exhibit only slip bonds.
Our findings integrate well with and extend the major models of TCR triggering including mechanosensor (Kim et al., 2009; Wang and Reinherz, 2012), receptor deformation/conformational changes (Ma et al., 2008), kinetic segregation (Davis and van der Merwe, 2006), kinetic proofreading (Dushek et al., 2009; McKeithan, 1995), digital triggering (Altan-Bonnet and Germain, 2005), and serial engagement as recently modified (Huang et al., 2010). The mechanosensor model (Wang and Reinherz, 2012) proposes that the αβ TCR acts as a mechanical lever to tilt the Cβ FG loop to push down on the CD3ε, causing a piston-like movement of the rigid CD3γε heterodimer (Sun et al., 2001) for phosphorylation of the ITAMs by Lck (Xu et al., 2008; Zhang et al., 2011). This model is supported by structural studies (Wang and Reinherz, 2012) and the authors’ data that calcium was triggered when optical tweezers-trapped beads bearing pMHC or anti-CD3 were used to continuously engage the TCR and apply sinusoidal forces of 50-pN amplitude tangential (but not normal) to the T-cell surface (Kim et al., 2009). Scenarios of potential tangential force to the T-cell surface may include those generated by cell motility, pseudopodia movement in search of antigen, or transport of TCR microclusters in the IS (Mempel et al., 2004; Mossman et al., 2005; Sims et al., 2007). However, in our experiments calcium was triggered by a 10-pN intermittent tensile force to individual TCRs one at a time. We note that it is difficult to ascertain the direction of force with respect to the TCR–pMHC bond because the T-cell surface has a rough topology with numerous microvilli and ruffles (Majstoravich et al., 2004), which can be easily stretched to reorient with the direction of force (Yao and Shao, 2007). Also, in the optical tweezers experiment (Kim et al., 2009), the trapped bead might rotate, potentially generating tensile forces on the TCR–pMHC bonds at the rear edge.
The receptor deformation model proposes that force originating from actin cytoskeleton pulls on the TCR, causing conformational changes in the TCR/CD3 complex to initiate signaling (Ma et al., 2008). It assumes that TCR forms slip bonds with pMHCs and that antigen specificity is defined by the TCR–pMHC unbinding force, such that the TCR is triggered when the unbinding force exceeds a threshold. While this proposal is not supported by a recent study that finds similar rupture forces for unbinding of the OT1 TCR from a panel of pMHCs with a wide range of biological activities (Puech et al., 2011), the current work reveals force-elicited catch bond and the requirement of rapid lifetime accumulation to induce Ca2+, further restricting any force-based conformational model for T cell triggering. In general, TCR triggering models based on conformational changes have not been substantiated by structural studies (van der Merwe and Dushek, 2011). Thermodynamics analysis suggested that changes of flexibility of the TCR–pMHC binding interface is important to T cell activation (Krogsgaard et al., 2003). However, TCR and pMHC structures or thermodynamic characteristics obtained under force-free conditions may or may not correspond to the triggered state. Our data highlight the importance of force for TCR triggering and suggest that signaling competent conformational and/or flexibility changes may depend on force magnitude, particularly TCR complex quaternary change as previously suggested (Wang and Reinherz, 2012).
The kinetic segregation model proposes that formation of small-sized TCR–pMHC bonds excludes large-sized phosphatases (e.g., CD45), which tilts the homeostatic balance between kinase and phosphatase in favor of the already activated kinases (e.g., Lck) to phosphorylate TCR/CD3 and initiates signaling (Davis and van der Merwe, 2006; van der Merwe and Dushek, 2011). The segregation of phosphatases from kinases is largely based on differential extracellular domain sizes of the molecular species (Davis and van der Merwe, 2006). However, a recent study using a reconstituted system revealed that molecules whose extracellular domains have similar sizes as the TCR were also excluded from the contact zone (James and Vale, 2012). It was suggested that the TCR–pMHC binding energy alone was sufficient to exclude other membrane proteins. Our finding of the TCR–pMHC catch bond may offer a biophysical explanation for these observations. As the T-cell and APC are brought into close proximity by membrane fluctuation or active motion, TCR–pMHC binding would prevent membrane separation by the same processes. This would result in a tensile force on the TCR and a compressive force on the non-binding molecules including but not limited to bulky phosphatases. The compressive force would exclude non-engaged molecules from the contact zone. The tensile force would elicit TCR catch bonds for antigen pMHC, which would increase bond lifetime and in turn strengthen the T-cell–APC linkage. The first TCR–pMHC bond could then serve as a nucleation site for rapid serial formation of additional TCR–pMHC bonds enhanced by exclusion of other molecules that do not bind. Therefore, the antigen-specific catch bond may create a kinetic trap for accelerated engagement of additional TCRs with a built-in positive feedback for segregation by “catchy” TCR–pMHC interactions.
Our data are also relevant to the kinetic proofreading model, which proposes that T-cell activation requires completion of a series of reaction steps that proceed only when the TCR is engaged by a pMHC but would be immediately and completely reversed upon bond dissociation (McKeithan, 1995). The original model has subsequently been refined and extended to accommodate new experimental results (Dushek et al., 2009; Jansson, 2011). One recent extension allows the intermediate signaling states to persist when the pMHC dissociates and the proofreading steps to resume upon pMHC rebinding, thus incorporating the TCR–pMHC on-rate as another important parameter to the model (Dushek et al., 2009). This is supported by our finding that cumulative but not individual bond lifetime best correlates Ca2+. Our data further indicate that rebinding of the dissociated pMHC to the same TCR, which the model assumes, may not be required, as in our experiment the serial bonds that triggered Ca2+ we re likely formed between different TCRs due to the stochastic nature of single-bond formation with excessive TCRs. Our observation that T-cell signaling was induced by a series of contacts with a surrogate APC expressing a low density of antigen pMHC also supports the extended serial engagement model (Huang et al., 2010). Our data suggest that the concentrations of signaling intermediates may be key determinants. They may build up progressively by sequential engagements of different TCRs, and their gradual decay during intermission between two successive TCR–pMHC bonds may provide a memory mechanism (Zarnitsyna et al., 2007). The observation that Ca2+ signaling was digital, i.e., whether a cell fluxed Type α Ca 2+ depended on whether the cumulative lifetime reached the 10-s threshold in the first minute of contacts, further suggests that certain reaction steps are highly cooperative, possibly via a digital positive feedback mechanism (Altan-Bonnet and Germain, 2005).
Based on previous in situ kinetic studies (Huang et al., 2010; Huppa et al., 2010) and the present work, we propose the following model for antigen discrimination and T-cell activation. During antigen recognition, the initial TCR–pMHC bond formation is governed by cellular environment-dependent 2D on-rates with a broad range, providing the first-level antigen discrimination (Huang et al., 2010). The rapid zero-force 2D off-rates allow TCRs to quickly scan various pMHC species displayed by an APC. The pMHCs with high 2D affinities as measured at zero force will engage TCRs and pull on them. At this point, force elicits agonist-specific catch bonds, which selectively prolong lifetimes. The high on-rates allow the dissociated agonist pMHCs to quickly rebind and form serial bonds over time, thereby accumulating long bond lifetimes to induce Ca2+. In contrast, force induces slip bonds in response to less biologically active ligands, which further shorten lifetimes. The low on-rates decrease the weak ligands’ chance to rebind or form serial bonds over time, thereby failing to accumulate sufficiently long lifetimes to activate. Thus, force acts as an additional checkpoint to further discriminate agonists from less biologically active ligands by expanding the dynamic range of 2D off-rates. As antagonism activates negative signals (Altan-Bonnet and Germain, 2005; Kilgore et al., 2003), future work could find that short-lived antagonist-specific slip bonds favor phosphatase activity, which may correspond to different phosphorylation patterns identified for the CD3 cytoplasmic tails (Sloan-Lancaster et al., 1994). The co receptor CD8 or CD4 is also likely affected by force. Thus, our data integrates force as a key concept in the paradigm of T-cell triggering.
Experimental Procedures
Standard experimental procedures including cells and proteins, preparation of RBCs and beads, as well as measurement of molecular densities on the surfaces of T cells and BFP beads are detailed in the Supplemental Information. New experimental methods and analyses are briefly summarized below, with more details described in the Supplemental Information.
Fluorescence biomembrane force probe (fBFP)
Our fBFP were developed to simultaneously measure in situ kinetics of receptor–ligand binding and intracellular signaling with an added fluorescence module (Figure S3A) to the previous BFP (Chen et al., 2008a; Evans et al., 1995). Briefly, the BFP used a pMHC- or antibody-coupled glass bead attached to a micropipette-aspirated RBC as a pico-force probe (Figure 1A) whose position was tracked by a high speed camera at 1,600 frames per second and 3-nm displacement precision. To simultaneously record the fluorescent image, a fluorescence module was added with redesigned light paths (Figure S3A).
BFP single-bond kinetic measurement
Three types of BFP assays were used: force-ramp, force-clamp, and thermal fluctuation assays. Briefly, in the force-ramp assay, TCR–pMHC bond was loaded by retracting the T cell at a constant speed until rupture (Figure 1D). In the force-clamp assay, the retracting T cell was clamped at a preset force until bond rupture (Figure 1C). Bond lifetime was the duration of the clamped phase. In the thermal fluctuation assay, the retraction stopped at zero force. Bond association and dissociation events were identified from reduction and resumption, respectively, of bead fluctuations (Figures S1C and S1D). Bond lifetime was measured as the duration from fluctuation reduction to resumption.
Simultaneous 2D kinetic analysis and Ca2+ imaging
To relate TCR–pMHC interaction characteristics to intracellular signaling at the single-cell level, we used our newly developed fBFP to simultaneously measure 2D kinetics and observe Ca2+ signaling in the same T cells loaded with fura-2 by ratiometric imaging. The T-cell was excited at 340 and 380 nm (two excitations separated by 200 ms in that order) every second, and the fluorescent images were recorded. The experiment was performed at 37 °C and continued for 10 min for each cell, and the kinetic-associated statistics were analyzed.
Measuring intracellular Ca2+ level by ratiometric images
Fluorescence images recorded by fBFP were imported into a customized Matlab (The MathWorks, Inc., Natick, MA) program for fura-2 ratio analysis. Briefly, two adjacent images from the two emission channels were aligned to eliminate errors introduced by cyclic T-cell movements. Fura-2 ratio was calculated by dividing the aligned emission intensity excited by 340 nm by that by 380 nm pixel by pixel over the entire cell. A single fura-2 ratio value calculated by the whole-cell average of fura-2 ratios over all pixels was plotted vs. time (cf. Figures 3C and 3D). The percent increase of fura-2 ratio from the value at the beginning of the experiment to the maximal value was used to represent the overall Ca2+ level (Figures 4, 5A–F, 6B, 6C, and 7B).
Correlative analysis of Ca2+ level and kinetic-associated statistics of TCR–pMHC interaction
To identify the best predictive parameter for Ca2+ signaling, we performed single-cell correlative analysis between the percent increase of fura-2 ratio and two groups of kinetic-associated statistics of TCR–pMHC interaction (Figures 3C and 3D). The first group is event-counting parameters associated with 2D affinity, including the number of adhesions Na (Figure 5A), number of lifetimes Nlt (Figure 5B), and adhesion frequency Pa (Figure 5C). The second group is event duration parameters associated with force-regulated 2D off-rate (Figures 3C and 3D), including average lifetime< t> (Figure 5D), longest lifetime tmax (Figure 5E), and cumulative lifetime Σti (i.e. sum of all bond lifetimes, Figure 5F). Each parameter was calculated as a statistic from the binding events observed in a window (specified by the starting time T0 and window length TL) within the total 10-min experiment for each cell (Figure 6A).
We plotted the percent increase of fura-2 ratio against each parameter defined for a given time window (given T0 and TL) for all individual cells (n = 99) as a scattergram and analyzed their correlation with linear regression (Figures 5A–F, 6B, and 6C). The goodness-of-fit was accessed with the Pearson coefficient R (Figure 5G). For each parameter, the optimal window was identified by selecting the highest R-value for a combination of T0 (0, 30, 45, 60, 90, 120, 150, 240, and 450 s) and TL (30, 45, 60, 90, and 120 s) (Figures 6D–F). The kinetic parameter in the identified optimal window with the highest R-value is considered the best predictor of Ca2+ signaling.
Kinetic analysis on sliding windows
To examine how kinetic-associated statistics calculated in a window of fixed length (e.g. TL = 60 s) vary with its timing (i.e. starting time T0), we slid the window rightward (i.e. increasing T0) at a 5-s increment across the 10-min period and plotted the kinetic- associated statistics calculated for each T0 vs. T0. The maximal cumulative lifetime max{Σti} (e.g., Figure S7A), maximal average lifetime max{<t>}, maximal longest lifetime max{tmax}, maximal number of adhesions max{Na}, maximal number of lifetimes max{Nlt}, and maximal adhesion frequency max{Pa} in 60-s sliding windows were identified for each cell and plotted vs. their timings for all the cells to examine their correlation with T0 (Figures 7A and S7B-F). Based on the thresholds of 50% fura-2 ratio increase and 10-s cumulative lifetime (Figure 7B), the cells were classified into three categories: group A cells with both >50% fura-2 ratio increase and >10 s cumulative lifetime, group B cells with <50% fura-2 ratio increase and >10 s cumulative lifetime, and Group C cells with <50% fura-2 ratio increase and <10-s cumulative lifetime (Figure 7B). For both groups A and B cells, we pooled lifetime events before the Ca2+ peak and analyzed them by histograms on a per cell basis (Figure 7C). Using the peak lifetime on the catch bond curve (Figure 2B) for OT1 TCR interacting with OVA as the threshold, we counted the numbers of short (<0.8 s) and long (>0.8 s) lifetimes for each cell in groups A and B and presented them as mean ± s.e.m. (Figure 7D).
Alternatively, we collected and pooled lifetime events in the initial (i.e. T0 = 0 s) 60-s window for group A cells and in the 60-s window with maximal cumulative lifetime for each cell in group B. These were analyzed by histogram on a per cell basis (Figure 7E), which were fitted with a double log-Gaussian kernel function (1):
| (1) |
where N is the number of lifetimes per cell and t is lifetime (Figure 7E). μi, σi, and wi (i = 1,2) are, respectively, the mean, the standard deviation, and the weight of the ith sub-population. The weight wi represents an approximation to the total number of lifetimes of the ith sub-population. Fraction of each subpopulation is calculated by wi/(w1 + w2).
Supplementary Material
Highlights.
Single-cell assay for concurrent measurement of in-situ kinetics and Ca2+ signaling
Force prolongs lifetimes of TCR bonds with agonists but not less active pMHCs
Both the magnitude and the duration of force are important for Ca2+ triggering
T-cell signaling requires early and rapid accumulation of TCR–pMHC bond lifetimes
Acknowledgments
B.L., W.C., and C.Z. designed experiments; B.L. and W.C. performed experiments; B.L., W.C. and C.Z analyzed the data; all authors contributed to writing the paper. We thank the NIH Tetramer Core Facility at Emory University for providing pMHC monomers, J. Altman for providing the H2-Kbα3A2 construct, L. Doudy for purifying T-cells, M. Krogsgaard for advice on Ca2+ imaging, L. Ju for constructing the BFP-2, J. Hong for initial design of the Ca2+ imaging system, Y. Chen for designing the temperature control unit, Q. Ji for designing the cell chamber, L. Gu for help on statistical analysis, and R. P. McEver, E. L. Reinherz, M. Krogsgaard, H.-T. He, and J. Donnell for helpful comments. This work was supported by NIH grants AI38282 and GM096187 (to C.Z.) and NS071518 and AI096879 (to B.D.E.). The authors declare no competing financial interests.
Footnotes
Publisher's Disclaimer: This is a PDF file of an unedited manuscript that has been accepted for publication. As a service to our customers we are providing this early version of the manuscript. The manuscript will undergo copyediting, typesetting, and review of the resulting proof before it is published in its final citable form. Please note that during the production process errors may be discovered which could affect the content, and all legal disclaimers that apply to the journal pertain.
References
- Adams Jarrett J, Narayanan S, Liu B, Birnbaum Michael E, Kruse Andrew C, Bowerman Natalie A, Chen W, Levin Aron M, Connolly Janet M, Zhu C, et al. T Cell Receptor Signaling Is Limited by Docking Geometry to Peptide-Major Histocompatibility Complex. Immunity. 2011;35:681–693. doi: 10.1016/j.immuni.2011.09.013. [DOI] [PMC free article] [PubMed] [Google Scholar]
- Alam SM, Travers PJ, Wung JL, Nasholds W, Redpath S, Jameson SC, Gascoigne NRJ. T-cell-receptor affinity and thymocyte positive selection. Nature. 1996;381:616–620. doi: 10.1038/381616a0. [DOI] [PubMed] [Google Scholar]
- Aleksic M, Dushek O, Zhang H, Shenderov E, Chen JL, Cerundolo V, Coombs D, van der Merwe PA. Dependence of T Cell Antigen Recognition on T Cell Receptor-Peptide MHC Confinement Time. Immunity. 2010;32:163–174. doi: 10.1016/j.immuni.2009.11.013. [DOI] [PMC free article] [PubMed] [Google Scholar]
- Altan-Bonnet G, Germain RN. Modeling T cell antigen discrimination based on feedback control of digital ERK responses. PLoS Biol. 2005;3:e356. doi: 10.1371/journal.pbio.0030356. [DOI] [PMC free article] [PubMed] [Google Scholar]
- Chen W, Evans EA, McEver RP, Zhu C. Monitoring Receptor-Ligand Interactions between Surfaces by Thermal Fluctuations. Biophys J. 2008a;94:694–701. doi: 10.1529/biophysj.107.117895. [DOI] [PMC free article] [PubMed] [Google Scholar]
- Chen W, Zarnitsyna VI, Sarangapani KK, Huang J, Zhu C. Measuring Receptor-Ligand Binding Kinetics on Cell Surfaces: From Adhesion Frequency to Thermal Fluctuation Methods. Cell Mol Bioeng. 2008b;1:276–288. doi: 10.1007/s12195-008-0024-8. [DOI] [PMC free article] [PubMed] [Google Scholar]
- Chen W, Zhu C. Mechanical regulation of T-cell functions. Immunol Rev. 2013;256:160–176. doi: 10.1111/imr.12122. [DOI] [PMC free article] [PubMed] [Google Scholar]
- Chesla SE, Selvaraj P, Zhu C. Measuring Two-Dimensional Receptor-Ligand Binding Kinetics by Micropipette. Biophys J. 1998;75:1553–1572. doi: 10.1016/S0006-3495(98)74074-3. [DOI] [PMC free article] [PubMed] [Google Scholar]
- Davis SJ, van der Merwe PA. The kinetic-segregation model: TCR triggering and beyond. Nat Immunol. 2006;7:803–809. doi: 10.1038/ni1369. [DOI] [PubMed] [Google Scholar]
- Dushek O, Das R, Coombs D. A Role for Rebinding in Rapid and Reliable T Cell Responses to Antigen. PLoS Comput Biol. 2009;5:e1000578. doi: 10.1371/journal.pcbi.1000578. [DOI] [PMC free article] [PubMed] [Google Scholar]
- Evans E, Ritchie K, Merkel R. Sensitive force technique to probe molecular adhesion and structural linkages at biological interfaces. Biophys J. 1995;68:2580–2587. doi: 10.1016/S0006-3495(95)80441-8. [DOI] [PMC free article] [PubMed] [Google Scholar]
- Gascoigne NR, Zal T, Alam SM. T-cell receptor binding kinetics in T-cell development and activation. Expert Rev Mol Med. 2001;2001:1–17. doi: 10.1017/S1462399401002502. [DOI] [PubMed] [Google Scholar]
- Howarth M, Chinnapen DJ, Gerrow K, Dorrestein PC, Grandy MR, Kelleher NL, El-Husseini A, Ting AY. A monovalent streptavidin with a single femtomolar biotin binding site. Nature Methods. 2006;3:267–273. doi: 10.1038/NMETHXXX. [DOI] [PMC free article] [PubMed] [Google Scholar]
- Huang J, Zarnitsyna VI, Liu B, Edwards LJ, Jiang N, Evavold BD, Zhu C. The kinetics of two-dimensional TCR and pMHC interactions determine T-cell responsiveness. Nature. 2010;464:932–936. doi: 10.1038/nature08944. [DOI] [PMC free article] [PubMed] [Google Scholar]
- Huang JF, Yang Y, Sepulveda H, Shi W, Hwang I, Peterson PA, Jackson MR, Sprent J, Cai Z. TCR-Mediated internalization of peptide-MHC complexes acquired by T cells. Science. 1999;286:952–954. doi: 10.1126/science.286.5441.952. [DOI] [PubMed] [Google Scholar]
- Huppa JB, Axmann M, Mortelmaier MA, Lillemeier BF, Newell EW, Brameshuber M, Klein LO, Schutz GJ, Davis MM. TCR-peptide-MHC interactions in situ show accelerated kinetics and increased affinity. Nature. 2010;463:963–967. doi: 10.1038/nature08746. [DOI] [PMC free article] [PubMed] [Google Scholar]
- Huse M, Klein LO, Girvin AT, Faraj JM, Li QJ, Kuhns MS, Davis MM. Spatial and Temporal Dynamics of T Cell Receptor Signaling with a Photoactivatable Agonist. Immunity. 2007;27:76–88. doi: 10.1016/j.immuni.2007.05.017. [DOI] [PubMed] [Google Scholar]
- Ilani T, Vasiliver-Shamis G, Vardhana S, Bretscher A, Dustin ML. T cell antigen receptor signaling and immunological synapse stability require myosin IIA. Nat Immunol. 2009;10:531–539. doi: 10.1038/ni.1723. [DOI] [PMC free article] [PubMed] [Google Scholar]
- James JR, Vale RD. Biophysical mechanism of T-cell receptor triggering in a reconstituted system. Nature. 2012;487:64–69. doi: 10.1038/nature11220. [DOI] [PMC free article] [PubMed] [Google Scholar]
- Jansson A. Kinetic proofreading and the search for nonself-peptides. Self/nonself. 2011;2:1–3. doi: 10.4161/self.2.1.15362. [DOI] [PMC free article] [PubMed] [Google Scholar]
- Jiang N, Huang J, Edwards LJ, Liu B, Zhang Y, Beal CD, Evavold BD, Zhu C. Two-Stage Cooperative T Cell Receptor-Peptide Major Histocompatibility Complex-CD8 Trimolecular Interactions Amplify Antigen Discrimination. Immunity. 2011;34:13–23. doi: 10.1016/j.immuni.2010.12.017. [DOI] [PMC free article] [PubMed] [Google Scholar]
- Kersh GJ, Kersh EN, Fremont DH, Allen PM. High- and low-potency ligands with similar affinities for the TCR: the importance of kinetics in TCR signaling. Immunity. 1998;9:817–826. doi: 10.1016/s1074-7613(00)80647-0. [DOI] [PubMed] [Google Scholar]
- Kilgore NE, Carter JD, Lorenz U, Evavold BD. Cutting Edge: Dependence of TCR Antagonism on Src Homology 2 Domain-Containing Protein Tyrosine Phosphatase Activity. J Immunol. 2003;170:4891–4895. doi: 10.4049/jimmunol.170.10.4891. [DOI] [PubMed] [Google Scholar]
- Kim ST, Takeuchi K, Sun ZYJ, Touma M, Castro CE, Fahmy A, Lang MJ, Wagner G, Reinherz EL. The alphabeta T cell receptor is an anisotropic mechanosensor. J Biol Chem. 2009;284:31028–31037. doi: 10.1074/jbc.M109.052712. [DOI] [PMC free article] [PubMed] [Google Scholar]
- Krogsgaard M, Prado N, Adams EJ, He X-l, Chow DC, Wilson DB, Garcia KC, Davis MM. Evidence that Structural Rearrangements and/or Flexibility during TCR Binding Can Contribute to T Cell Activation. Mol Cell. 2003;12:1367–1378. doi: 10.1016/s1097-2765(03)00474-x. [DOI] [PubMed] [Google Scholar]
- Li YC, Chen BM, Wu PC, Cheng TL, Kao LS, Tao MH, Lieber A, Roffler SR. Cutting Edge: Mechanical Forces Acting on T Cells Immobilized via the TCR Complex Can Trigger TCR Signaling. J Immunol. 2010;184:5959–5963. doi: 10.4049/jimmunol.0900775. [DOI] [PubMed] [Google Scholar]
- Liu B, Zhong S, Malecek K, Johnson LA, Rosenberg SA, Zhu C, Krogsgaard M. 2D–TCR–pMHC CD8 kinetics determines T-cell responses in a self-antigen-specific TCR system. Eur J Immunol. 2014;44:239–250. doi: 10.1002/eji.201343774. [DOI] [PMC free article] [PubMed] [Google Scholar]
- Ma Z, Janmey PA, Finkel TH. The receptor deformation model of TCR triggering. FASEB J. 2008;22:1002–1008. doi: 10.1096/fj.07-9331hyp. [DOI] [PMC free article] [PubMed] [Google Scholar]
- Majstoravich S, Zhang J, Nicholson-Dykstra S, Linder S, Friedrich W, Siminovitch KA, Higgs HN. Lymphocyte microvilli are dynamic, actin-dependent structures that do not require Wiskott-Aldrich syndrome protein (WASp) for their morphology. Blood. 2004;104:1396–1403. doi: 10.1182/blood-2004-02-0437. [DOI] [PubMed] [Google Scholar]
- Marshall BT, Long M, Piper JW, Yago T, McEver RP, Zhu C. Direct observation of catch bonds involving cell-adhesion molecules. Nature. 2003;423:190–193. doi: 10.1038/nature01605. [DOI] [PubMed] [Google Scholar]
- McKeithan TW. Kinetic proofreading in T-cell receptor signal transduction. Proc Natl Acad Sci USA. 1995;92:5042–5046. doi: 10.1073/pnas.92.11.5042. [DOI] [PMC free article] [PubMed] [Google Scholar]
- McMahan RH, McWilliams JA, Jordan KR, Dow SW, Wilson DB, Slansky JE. Relating TCR-peptide-MHC affinity to immunogenicity for the design of tumor vaccines. J Clin Invest. 2006;116:2543–2551. doi: 10.1172/JCI26936. [DOI] [PMC free article] [PubMed] [Google Scholar]
- Mempel TR, Henrickson SE, von Andrian UH. T-cell priming by dendriticcells in lymph nodes occurs in three distinct phases. Nature. 2004;427:154–159. doi: 10.1038/nature02238. [DOI] [PubMed] [Google Scholar]
- Mossman KD, Campi G, Groves JT, Dustin ML. Altered TCR signaling from geometrically re patterned immunological synapses. Science. 2005;310:1191–1193. doi: 10.1126/science.1119238. [DOI] [PubMed] [Google Scholar]
- Mukhopadhyay H, Cordoba SP, Maini PK, van der Merwe PA, Dushek O. Systems model of T cell receptor proximal signaling reveals emergent ultrasensitivity. PLoS Comput Biol. 2013;9:e1003004. doi: 10.1371/journal.pcbi.1003004. [DOI] [PMC free article] [PubMed] [Google Scholar]
- Puech PH, Nevoltris D, Robert P, Limozin L, Boyer C, Bongrand P. Force Measurements of TCR/pMHC Recognition at T Cell Surface. PLoS ONE. 2011;6:e22344. doi: 10.1371/journal.pone.0022344. [DOI] [PMC free article] [PubMed] [Google Scholar]
- Purbhoo MA, Irvine DJ, Huppa JB, Davis MM. T cell killing does not require the formation of a stable mature immunological synapse. Nat Immunol. 2004;5:524–530. doi: 10.1038/ni1058. [DOI] [PubMed] [Google Scholar]
- Rudolph MG, Stanfield RL, Wilson IA. How TCRs bind MHCs, peptides, and coreceptors. Annu Rev Immunol. 2006;24:419–466. doi: 10.1146/annurev.immunol.23.021704.115658. [DOI] [PubMed] [Google Scholar]
- Sabatino J, Huang J, Zhu C, Evavold B. High prevalence of low affinity peptide-MHC II tetramer-negative effectors during polyclonal CD4+ T cell responses. J Exp Med. 2011;208:81–90. doi: 10.1084/jem.20101574. [DOI] [PMC free article] [PubMed] [Google Scholar]
- Sims TN, Soos TJ, Xenias HS, Dubin-Thaler B, Hofman JM, Waite JC, Cameron TO, Thomas VK, Varma R, Wiggins CH, et al. Opposing effects of PKC theta and WASp on symmetry breaking and relocation of the immunological synapse. Cell. 2007;129:773–785. doi: 10.1016/j.cell.2007.03.037. [DOI] [PubMed] [Google Scholar]
- Sloan-Lancaster J, Shaw AS, Rothbard JB, Allen PM. Partial T cell signaling: altered phospho-zeta and lack of zap70 recruitment in APL-induced T cell anergy. Cell. 1994;79:913–922. doi: 10.1016/0092-8674(94)90080-9. [DOI] [PubMed] [Google Scholar]
- Smith-Garvin JE, Koretzky GA, Jordan MS. T Cell Activation. Annu Rev Immunol. 2009;27:591–619. doi: 10.1146/annurev.immunol.021908.132706. [DOI] [PMC free article] [PubMed] [Google Scholar]
- Sun ZJ, Kim KS, Wagner G, Reinherz EL. Mechanisms contributing to T cell receptor signaling and assembly revealed by the solution structure of an ectodomain fragment of the CD3 epsilon gamma heterodimer. Cell. 2001;105:913–923. doi: 10.1016/s0092-8674(01)00395-6. [DOI] [PubMed] [Google Scholar]
- van der Merwe PA, Dushek O. Mechanisms for T cell receptor triggering. Nat Rev Immunol. 2011;11:47–55. doi: 10.1038/nri2887. [DOI] [PubMed] [Google Scholar]
- Wang J-h, Reinherz EL. The structural basis of αβ T-lineage immune recognition: TCR docking topologies, mechanotransduction, and co-receptor function. Immunol Rev. 2012;250:102–119. doi: 10.1111/j.1600-065X.2012.01161.x. [DOI] [PMC free article] [PubMed] [Google Scholar]
- Xu C, Gagnon E, Call ME, Schnell JR, Schwieters CD, Carman CV, Chou JJ, Wucherpfennig KW. Regulation of T cell receptor activation by dynamic membrane binding of the CD3epsilon cytoplasmic tyrosine-based motif. Cell. 2008;135:702–713. doi: 10.1016/j.cell.2008.09.044. [DOI] [PMC free article] [PubMed] [Google Scholar]
- Yao DK, Shao JY. Flexibility of single microvilli on live neutrophils and lymphocytes. Phys Rev E Stat Nonlin Soft Matter Phys. 2007;76:021907. doi: 10.1103/PhysRevE.76.021907. [DOI] [PubMed] [Google Scholar]
- Zarnitsyna VI, Huang J, Zhang F, Chien YH, Leckband D, Zhu C. Memory in receptor–ligand-mediated cell adhesion. Proc Natl Acad Sci USA. 2007;104:18037–18042. doi: 10.1073/pnas.0704811104. [DOI] [PMC free article] [PubMed] [Google Scholar]
- Zhang H, Cordoba SP, Dushek O, van der Merwe PA. Basic residues in the T-cell receptor zeta cytoplasmic domain mediate membrane association and modulate signaling. Proc Natl Acad Sci USA. 2011;108:19323–19328. doi: 10.1073/pnas.1108052108. [DOI] [PMC free article] [PubMed] [Google Scholar]
- Zhu C, Jiang N, Huang J, Zarnitsyna VI, Evavold BD. Insights from in situ analysis of TCR–pMHC recognition: response of an interaction network. Immunol Rev. 2013;251:49–64. doi: 10.1111/imr.12016. [DOI] [PMC free article] [PubMed] [Google Scholar]
Associated Data
This section collects any data citations, data availability statements, or supplementary materials included in this article.