

Abstract
Whether and how habitat fragmentation and population size jointly affect adaptive genetic variation and adaptive population differentiation are largely unexplored. Owing to pronounced genetic drift, small, fragmented populations are thought to exhibit reduced adaptive genetic variation relative to large populations. Yet fragmentation is known to increase variability within and among habitats as population size decreases. Such variability might instead favour the maintenance of adaptive polymorphisms and/or generate more variability in adaptive differentiation at smaller population size. We investigated these alternative hypotheses by analysing coding-gene, single-nucleotide polymorphisms associated with different biological functions in fragmented brook trout populations of variable sizes. Putative adaptive differentiation was greater between small and large populations or among small populations than among large populations. These trends were stronger for genetic population size measures than demographic ones and were present despite pronounced drift in small populations. Our results suggest that fragmentation affects natural selection and that the changes elicited in the adaptive genetic composition and differentiation of fragmented populations vary with population size. By generating more variable evolutionary responses, the alteration of selective pressures during habitat fragmentation may affect future population persistence independently of, and perhaps long before, the effects of demographic and genetic stochasticity are manifest.
Keywords: habitat fragmentation, population size, genetic variation, adaptive variation, fish
1. Introduction
The study of habitat fragmentation has primarily focused on its ecological effects and classic genetic impacts to populations, such as inbreeding and genetic drift [1–4]. That habitat fragmentation might affect natural selection by altering habitat characteristics as fragment and population size decrease has rarely been considered [5–7]. Consequently, we lack a clear conceptual and theoretical framework for predicting how habitat fragmentation affects the adaptive genetic composition and differentiation of fragmented populations of varying sizes, and how this might affect subsequent responses to environmental change.
One possibility, the ‘Directional Hypothesis’, proposes that habitat characteristics shift in a consistent manner during the habitat fragmentation process [6,7], resulting in directional relationships between these characteristics, population size and the extent of adaptive genetic variation and differentiation. For example, fragmentation might decrease population size while concurrently increasing isolation and reducing habitat quality, leading to greater organismal stress [8,9]. Hence, under this hypothesis, small, fragmented populations are predicted to consistently exhibit reduced adaptive variation/differentiation relative to large populations due to the resulting combined effects of genetic drift, restricted gene flow and/or inbreeding [2,4,10]. However, the Directional Hypothesis might not always typify the nature of adaptive variation. Some empirical work indicates that natural selection can overcome genetic drift at very small population sizes in the wild [11,12]. Moreover, environmental change associated with increased fragmentation and reduced habitat size can result in the increased maintenance of adaptive polymorphisms at small population size through, for example, balancing selection [13].
A possible alternative to the Directional Hypothesis is the ‘Variable Hypothesis’. It posits that habitat characteristics and resulting natural selection pressures become increasingly variable as habitat fragment size and population size decrease [6,7]. This stems from the idea that the evolutionary effects of habitat fragmentation are contingent upon the starting conditions within habitat fragments. For example, habitat complexity is usually greater at larger spatial scales [14], and the fragments that small populations occupy might simply be random samples of the fragments that large populations occupy ([7], references therein). Some of these small population fragments will thus typify the habitat heterogeneity of the larger population fragments while some will be more homogeneous. Therefore, under the Variable Hypothesis, the resulting extent of adaptive genetic variation and differentiation among populations is expected to become more variable with increasing fragmentation and decreasing population size.
These hypotheses provide a useful point of departure for an empirical exploration of the degree to which differences in the size of fragmented populations are associated with differences in adaptive variation and differentiation. Until recently, a lack of technological advancement and high-throughput capability in molecular ecology precluded such investigations [15–17]. Yet, as suggested by Wood et al. [7], if selection pressures within habitat fragments differ or vary more in intensity or direction among small than large populations, such assessments might improve the ability to predict population responses to future environmental change and the setting of species conservation priorities.
We examined patterns of putative adaptive variation and differentiation using detailed analyses of 164 single-nucleotide polymorphisms (SNPs) located in coding genes, with some also linked to QTLs for different phenotypic traits, in 14, varying-sized stream populations of brook trout (Salvelinus fontinalis). We specifically assessed the relationships between population size and: (i) genetic variation; (ii) extent of neutral population differentiation between population pairs and (iii) presence of signatures of diversifying or balancing selection between population pairs. We predicted that the Variable Hypothesis would better explain patterns of probable adaptive genetic variation and differentiation among these populations. Notably, previous work found no consistent difference in the characteristics of habitat fragments that small and large populations occupied, but rather more divergent habitat characteristics and greater spatial habitat variability among small populations [7]. Importantly, both the adult census population size (N) and the effective number of breeders (Nb) were considered in our analyses, the latter being an analogue of effective population size (Ne) but for a single breeding event [18]. Although some research has assumed a correspondence between N and Nb [5], Nb/N ratios can vary widely among populations of closely related species (e.g. [19]). It is also the genetic parameter Nb—not the ecological parameter N—that selection is associated with and that influences the magnitude of adaptive genetic variation and differentiation [20].
2. Material and methods
(a). Study site
Cape Race (CR) is a small, coastal barren region in southeastern Newfoundland, Canada, characterized by a parallel series of low-order streams harbouring pristine, resident populations of brook trout (electronic supplementary material, figure S1). CR streams are small (0.27–8.10 km range in axial length) and they can be comprehensively sampled, resulting in comparatively accurate and precise estimates of N and Nb. Fish residing in different streams form genetically distinct populations [7] that are estimated to have diverged from a common ancestor during the late-Wisconsinan glaciation (10–12 000 ybp; [21]). CR populations also exhibit considerable differences in life histories, probably because of population-specific differences in selective pressures following habitat fragmentation [22,23].
(b). Adult census population size (N) and effective number of breeders (Nb)
Estimates of population size for each study population were obtained from Wood et al. [7] with one exception (Hermitage Pond Brook), based on multi-year N and Nb estimates for most populations (electronic supplementary material, table S1). Either the Schnabel [24] or Petersen [25] method was applied to estimate annual N, whereas Nb was estimated using LDNe software [15] and based on data at 13 neutral microsatellite loci. (Additional details on calculating N and Nb for CR populations are available from [7].) Extremely low polymorphism was expressed in the small-population Hermitage Pond Brook at the 13 microsatellites, the neutral SNPs documented in this study, and at an additional 19 screened microsatellites (DJ Fraser 2014, unpublished results); this prevented us from providing a reliable estimate of Nb. An Nb estimate of 11 was therefore assumed for our analyses, based on a conversion from N of this population, and using the best-fit relationship between reliable estimates of Nb and N for all CR trout populations: inverse(Nb/N) = 5.9567 + 0.0115 × N (see Appendix I in Wood et al. [7]).
(c). Population genotyping
Tissue samples from a total of 446 individuals from 14 CR populations [7] were genotyped at coding gene SNPs previously developed for brook trout ([26,27]; see the electronic supplementary material, figure S1 and table S1, for names and locations of different streams, and numbers of individuals sampled per population). Briefly, these samples were obtained in the summer of 2011 (2012 for Hermitage Pond Brook) as adipose fin clips and stored in 95% ethanol until DNA was extracted, using a modified phenol–chloroform protocol. Samples within populations were obtained from individuals of the same age, unambiguously identifiable as being in their first year of life, based on body size [22,23]. Individuals were randomly sampled from 15 to 30 locations within each stream, using effort-standardized surveys (3-min electrofishing) conducted at each 50 or 100 m intervals originating at the stream mouth, depending on stream length; a subset of these samples was randomly selected for genotyping at 237 SNPs in this study. These SNPs have previously been positioned on a genetic map, tested for association with quantitative trait loci (QTL) at many physiological and growth traits, and annotated when feasible [26,27]. Details of SNP development, validation and sequencing at the Genome Quebec Innovation Center (McGill University, Montreal, QC, Canada) are provided in [26,27]. Three monomorphic SNPs were excluded from all analyses, as were four SNPs having heterozygosities exceeding 50% but for which the second homozygous genotype was missing. Four individuals with call rates of less than 85% across SNPs were also removed. Of 237 SNPs screened in our 446 individuals, 164 SNPs were polymorphic in 442 individuals and retained for analyses after the application of our quality criteria.
(d). Relationship between population size and genetic variation
We firstly assessed whether a relationship existed between heterozygosity, the simplest measure of within-population genetic variation, and population size. The analysis accounted for potential non-independence of loci among populations and within individuals [28], which is often not undertaken.
We applied generalized linear mixed models (GLMMs), using heterozygosity as a binary variable (homozygous = 0, heterozygous = 1), for 71 406 combinations of locus-individual combinations as the response (1.5% of combinations were missing data), the fixed continuous covariates of N or Nb (each mean-centred) and random intercept effects for the 14 populations, 164 loci and 442 individuals (nested within populations). The overall relationship between heterozygosity and population size was estimated across 164 random slope effects of loci (i.e. loci-by-population size effects) that we included in the models. We also estimated the covariance between loci intercepts and loci slope effects. GLMMs were fit with a binomial residual distribution and a logit link function under Laplace approximation, using the ‘glmer’ function of the R-package LME4 [29], and executed in R v. 2.15.3 [30]. Significances of fixed and random terms were tested using deviance-based likelihood ratio tests (LRT) between nested models with and without a respective term.
(e). Adaptive genetic differentiation among populations
We conducted a genome scan for each population pair to determine the probable extent of adaptive genetic differentiation among populations (i.e. total genome scans = 91), based on the numbers of SNPs exhibiting signatures of diversifying or balancing selection between each population pair (see below). Genome scans were conducted by implementing the commonly used software LOSITAN [31]. We estimated loci that deviated significantly higher (diversifying selection) or lower (balancing selection) from neutral genetic differentiation (FST) as predicted by the average relationship of heterozygosity and FST. We first calculated an average ‘neutral’ FST and forced this average FST by repeating runs with each of 50 000 simulations. The expected number of populations in these simulations was 14. The simulation p-values were corrected for the false discovery rate (FDR) after [32]. Only loci with q-values of less than 0.001 were regarded as showing significant signatures of selection. This approach corresponded to an overall FDR of 0.002 as we estimated q-values separately at both ends of the probability distribution.
(f). Relationship between population size and neutral population differentiation
We analysed the relationship between population size and neutral genetic differentiation as estimated from pairwise genome scans. This provided ‘neutral’ FST estimates between each population pair, once SNPs exhibiting signatures of selection in each pairwise comparison were removed from the dataset. Our pairwise estimation process assumed that each pairwise FST estimate might be affected by one or two population sizes, their interaction and/or by the geographical distance separating the population pair (the shortest distance between each pair's stream mouths). Preliminary analyses indicated a positive but non-significant relationship between pairwise FST (range: 0.018–0.828) and geographical distance (range: 0.03–15.29 km). However, to remove any geographical influence from our data, we firstly obtained model residuals from the FST–distance relationship. We then added to these residuals the FST value corresponding to the average pairwise geographical distance, to obtain estimates that were standardized with the average geographical distance. We then fit linear mixed models (LMMs) for the response of ‘remaining variation in FST’ with the two fixed continuous covariates of population size (either N or Nb) for both populations contributing to each respective FST value, plus the interaction between both population sizes. As all data obtained from pairwise comparisons were correlated by two different populations simultaneously, we fit random intercept effects for the two populations in all models. All LMMs were fit with a Gaussian error distribution using the ‘lmer’ function of the LME4 R-package. Significances of the fixed terms were tested using F-tests with denominator degrees of freedom (ddf) adjusted according to [33].
(g). Relationship between population size and adaptive genetic differentiation
We also analysed the relationship between population size and putative adaptive genetic differentiation as obtained from pairwise genome scans using GLMMs. We regarded adaptive genetic differentiation as the detection probability of an investigated locus to be under selection (either balancing or diversifying selection) out of the total number of loci analysed for a given population pair. Accordingly, for each pairwise genome scan, one population size, two population sizes, their interaction and/or the geographical distance separating the population pair (the shortest distance between each pair's stream mouths) might influence the probability to detect loci under selection. Not all of our loci are independent as some are linked [26,27] and this might inflate or deflate detection probabilities, although effects of linkage on genome scans remain to be investigated [34]. To be able to account for linkage group identity of loci in our follow up GLMM analyses, we coded our results as a binary response of each locus in each pairwise comparison (either balancing or diversifying selection; no selection detected = 0, selection detected = 1).
We analysed the binary responses with the three fixed continuous predictors of population sizes (N, Nb) for population pairs, their interaction and geographical distance, fitted with a binomial error distribution and a logit link function. As all binary data were obtained from pairwise comparisons, they were correlated by two different populations simultaneously. To account for this, random effects for each of the two populations and for population pairs were fitted in all models (population pairs effects accounted for non-independence across loci within a given comparison). Lastly, we included linkage group identity random effects to account for non-independence among loci within and across comparisons. Random locus effects were confounded with linkage group effects for many loci, and therefore were not fitted. This was because no linkage was detected in previous studies for 44 out of 164 loci [26,27], and thus we treated these loci as single locus linkage groups. Significance testing of model terms was conducted as for heterozygosity models.
3. Results
(a). Relationship between population size and genetic variation
After accounting for variation caused by non-independence in the data, we detected a significant, positive relationship between multi-locus genetic diversity and both population size measures (N or Nb) (table 1 and figure 1). The largest variance for heterozygosity was present among loci (61% and 62% of the total variance for Nb and N, respectively). The estimated variance among loci for slopes of heterozygosity with population size was also significant (table 1). Furthermore, a negative correlation was exhibited between random locus effects for intercepts and slopes (ρ = −0.42, −0.33 for Nb, N; table 1). That is, loci with low heterozygosity at overall average population size exhibited a larger change in heterozygosity with population size change relative to loci with high heterozygosity. Less but significant variance was also present among populations (12% and 14% of the total variance for heterozygosity for Nb and N, respectively) and among individuals within populations (both models; 0.5% of the total variance for heterozygosity).
Table 1.
Model results on testing the relationship between heterozygosity and population size. Population size is represented either by (a) the effective number of breeders (Nb) or (b) adult census population size (N). Reported for the fixed and random model terms are test statistics (χ2) and p-values (p), and effect estimates (with standard errors) or (co)variance estimates (Var).
| term | type |  |
p | effect or Var |
|---|---|---|---|---|
| (a) | ||||
| intercept | fixed | — | — | −2.19 ± 0.22 |
| Nb | fixed | 4.6 | 0.031 | 0.0068 ± 0.0029 |
| locus | random | 11 280 | <0.001 | 2.37 |
| locus : Nb | random | 639.5 | <0.001 | 0.00004 |
| Cov(locus, locus : Nb) | random | 17.6 | <0.001 | −0.00412 |
| population | random | 736.7 | <0.001 | 0.47 |
| individual | random | 20.8 | <0.001 | 0.02 |
| (b) | ||||
| intercept | fixed | — | — | −2.15 ± 0.23 |
| N | fixed | 1.9 | 0.172 | 0.00013 ± 0.00090 |
| locus | random | 11 197 | <0.001 | 2.30 |
| locus : N | random | 536.4 | <0.001 | 0.00000003 |
| Cov(locus, locus : N) | random | 9.8 | 0.002 | −0.000084 |
| population | random | 779.8 | <0.001 | 0.53 |
| individual | random | 20.5 | <0.001 | 0.02 |
Figure 1.
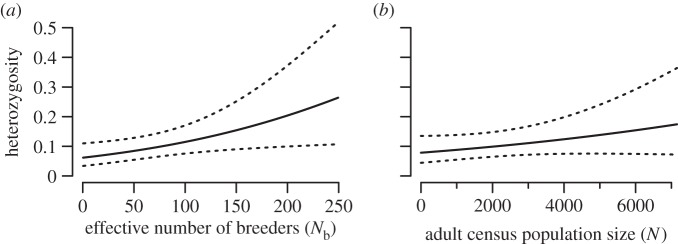
Average heterozygosity as a function of population size for either the effective number of breeders (a) or adult census population size (b). The dotted lines represent approximate 95% CIs.
(b). Adaptive genetic differentiation among populations
The percentage of outlier SNPs differentiating population pairs ranged between 0% and 8%, with a total of 31 and 145 loci showing significant signatures of balancing and diversifying selection, respectively, in at least one pairwise genome scan. Of these, 18 (balancing) and 13 (diversifying) were uniquely exhibited in a single pairwise genome scan. The highest numbers of loci under selection in any pairwise genome scans were 4 (balancing) or 18 (diversifying).
(c). Relationship between population size and neutral genetic differentiation
Depending on the population pair, an average of 113.5 ± 21.3 (1 s.d.) SNPs were used to estimate ‘neutral’ FST after removing outliers (and ‘monomorphic’ SNPs corresponding to that pair). Only non-significant relationships were obtained between variation in pairwise FST based on ‘neutral’ SNPs (and corrected for pairwise geographical distance) and both population size measures (electronic supplementary material, table S2). However, a trend of decreasing FST with increasing population size was observed when using Nb (F1/12 = 3.0, p = 0.111; electronic supplementary material, figure S2) but less so when using N (F1/12 = 1.8, p = 0.207; electronic supplementary material, figure S2), as the rank of N value for a population did not necessarily concur with the same rank for the Nb value (electronic supplementary material, figure S3).
(d). Relationship between population size and adaptive genetic differentiation
We found significant relationships between both population size measures (N, Nb) and the proportion of loci under balancing selection, as well as under diversifying selection for Nb, whereas the geographical distance separating population pairs had only a non-significant effect on the extent of adaptive genetic differentiation (table 2). Accounting for the potential non-independence of loci on the same linkage groups, these significant relationships (or the non-significant trend between N and diversifying selection) were characterized by an influence of the interaction of population sizes from both populations on the probability to detect loci under selection (table 2). Relationships were also consistently stronger for estimates of Nb than N. For balancing selection, the highest probability was modelled for combinations of smallest with largest population sizes, an intermediate probability for small with small populations and the lowest probability for large with large populations (figure 2). For diversifying selection using Nb, the relationship (or trend using N) was similar as for balancing selection, but the differences in probabilities between small with small populations and small with large populations were nearly absent here and effects were weaker (figure 2).
Table 2.
Model results for the relationship between the pairwise estimated detection probability for a locus to be putatively under balancing (a,b) or diversifying (directional) selection (c,d) and population size, represented by either the effective number of breeders (Nb) or adult census population size (N). Included in each of the four models are the fixed continuous covariates of population size for population one (pop1) and population two (pop2), the interaction of both population sizes, the geographical distances separating population pairs (distance) and the linkage group identity for all loci.
| response | term |  |
p |
|---|---|---|---|
| (a) | |||
| prop balancing | distance | 0.5 | 0.485 |
| prop balancing | Nb_pop1 | 0.0a | 1.000 |
| prop balancing | Nb_pop2 | 0.0a | 1.000 |
| prop balancing | Nb_pop1 : Nb_pop2 | 11.1 | <0.001 |
| (b) | |||
| prop balancing | distance | 2.6 | 0.110 |
| prop balancing | N_pop1 | 5.0a | 0.025 |
| prop balancing | N_pop2 | 5.0a | 0.025 |
| prop balancing | N_pop1 : N_pop2 | 10.6 | 0.001 |
| (c) | |||
| prop diversifying | distance | 1.3 | 0.252 |
| prop diversifying | Nb_pop1 | 0.6a | 0.455 |
| prop diversifying | Nb_pop2 | 0.6a | 0.455 |
| prop diversifying | Nb_pop1 : Nb_pop2 | 5.4 | 0.020 |
| (d) | |||
| prop diversifying | distance | 0.9 | 0.350 |
| prop diversifying | N_pop1 | 0.1a | 0.803 |
| prop diversifying | N_pop2 | 0.1a | 0.803 |
| prop diversifying | N_pop1 : N_pop2 | 1.1 | 0.305 |
aTested versus a model without an interaction term.
Figure 2.

Probabilities (in %) of detecting loci under balancing selection (a,b) or diversifying selection (c,d) as a function of two population size measures for population pairs represented by either the effective number of breeders, Nb (a,c), or adult census population size, N (b,d). The shading of the bar corresponds to probabilities of the plotted area.
4. Discussion
Our study revealed evidence of putative adaptive variation in brook trout over a broad range of population sizes for vertebrate species (N = 73–8416; Nb = 11–249) and at a fine geographical scale (0.03–15.29 km). Probable adaptive genetic differentiation was greater between small and large populations or among small populations than among large populations, based on signatures of balancing and/or diversifying selection at SNPs linked to phenotypic traits. These patterns were stronger for estimates of Nb than N, an important finding given that theoretically it is through Nb that selection should influence the magnitude of adaptive genetic differentiation [20,35]. What we did not find was evidence of reduced signatures of selection in small populations relative to large populations, despite that overall genetic variation (multi-locus heterozygosity) and neutral differentiation (pairwise neutral FST) were consistent with pronounced genetic drift in small populations.
Our results strengthen insights from recent work which indicate that selective pressures change during the habitat fragmentation process as fragment and population size decrease [5–7], even once population sizes become very small. These changes lead to (i) more variability (selective pressures vary more among small populations than among large populations); (ii) more ‘buffering’ (selective pressures favour genetic polymorphism underlying some traits in at least some small populations, as shown by evidence for balancing selection in comparisons primarily involving small populations); and to a lesser extent (iii) more diversification (selective pressures in small and large populations can be systematically different).
Our results therefore have elements supporting both the Directional and Variable hypotheses outlined above, so they do not entirely mirror what is known of the physical habitat of our study populations that can affect fitness in brook trout ([7], references therein). For example, Wood et al. [7] found that small trout populations were more often associated with more spatially divergent physical habitats than large populations, and we found that this does in fact result in more divergent selective pressures among small than large populations. Contrastingly, we also found some evidence that small- and large-population selective pressures can be consistently different from each other, suggesting that other underlying environmental selective pressures might be involved in driving the observed adaptive divergence. Many SNPs used in this study have been linked to growth, reproductive and stress response traits in brook trout [26,27]. In fact, of the 17 SNPs linked to QTL that were also polymorphic in CR populations, 16 were outliers in our study in two to 12 pairwise population comparisons. Additional and/or cryptic selective pressures might therefore relate to: (i) temporal variability in the physical habitats among small and large populations that affect growth or survival, specifically greater temporal variability within small populations [9], which might explain the observed prominence of balancing selection in small populations; (ii) diverse, seasonal aspects of intraspecific competition for accessing breeding areas or overwintering habitat, both of which are limited in some CR streams and may be associated with body size [22,23,36]; and/or (iii) interspecific interactions with pathogens or parasites, and less so with competitors or predators (brook trout are the only fish species in most CR streams and avian/mammalian predation is virtually non-existent; [22]). In sum, interactions between all biotic/abiotic factors likely drive the composition and extent of adaptive differentiation among natural, fragmented populations of varying size.
We further suggest that the nature of adaptive variation and differentiation in CR brook trout, a product of natural habitat fragmentation since the Last Pleistocene deglaciation, might not substantially differ from the human-induced fragmentation that many species are being subjected to today. The primary difference between natural and human-induced habitat fragmentation perhaps lies more in the rate at which environmental selective pressures within habitat fragments are altered, than in how these pressures are altered [7]. Indeed, conditions likely vary within landscapes with the end result depending on the initial conditions, regardless of whether fragmentation is natural or human-induced. Isolated populations reduced in size by the relatively slower, incremental environmental changes of natural fragmentation might be more likely to adapt and persist in the long term, but the collective phylogenetic and geological evidence suggests that fragmentation for many CR trout populations arose rapidly ([21]; T Burdon and DJ Fraser 2014, unpublished data).
(a). Possible caveats and assumptions
We used the proportion of SNPs exhibiting signatures of selection to characterize the probable extent of adaptive genetic differentiation between populations of varying size. Although the brook trout genetic map into which this study's SNPs were embedded was sufficiently dense to cover almost all chromosomes [26,27], our metric should be considered heuristic for it assumed that all SNPs were ‘equal’ and did not covary in shaping adaptive differentiation [37]. The use of population pairwise genome scans permitted us to investigate the extent to which, within a ‘matrix’ of populations of varying size, signatures of adaptive genetic variation were most evident. As these pairwise comparisons were therefore not strictly independent, two population random effects and linkage group identity effects were fit in all statistical models, and each population was represented proportionately equally across the 91 genome scans.
The overall percentage of SNPs exhibiting signatures of selection in our study was high, most likely due to the number of populations compared pairwise. Indeed, the range within population pairs (0–8%) was otherwise consistent with that documented for other species [37] and for brook trout, based on the same SNPs [38,39]. Furthermore, a high level of selection was not unexpected with these SNPs given (i) their association with traits potentially underlying fitness in brook trout [26,27] and (ii) that CR trout populations are known to differ extensively in physical environmental characteristics [7] and at several phenotypic traits that have been shown to proffer adaptive value [22,23]. Moreover, it is unlikely that hierarchical population structure might have increased the rate of false-positive signatures of selection given the recent common ancestry of our study populations, and that population isolation appears to have happened rather uniformly (T Burdon and DJ Fraser 2014, unpublished data).
Finally, although we adopted a stringent FDR for detecting outlier SNPs, we cannot rule out the possibility that a few (especially small) study populations might have had a history of severe bottlenecks, which can increase the generation of false-positive signatures of selection in genome scans, especially for diversifying versus balancing selection [40]. On the other hand, more recent simulations suggest that high population differentiation can result in a higher rate of false-negatives [41], yet our study still found greater evidence for selection signatures in pairwise comparisons involving small populations.
(b). Evolutionary and conservation implications
Comprehensive studies on the adaptive genetic composition and differentiation of fragmented populations of known, varying sizes are rare. In our naturally fragmented trout populations originating from a common ancestor, signatures of putative adaptive genetic differentiation were most evident among small and large populations or among small populations. Such findings lend support to the hypothesis that conditions do exist in nature wherein the evolutionary trajectories of very small populations are still very much affected by natural selection, in addition to drift [11,12,42]. They also support the proposition that a fuller understanding of adaptation will come from considering how intra- or interspecific interactions might be altered by habitat changes that are directly or indirectly linked to population size, or how selective pressures might shift temporally as populations expand or decline in size. Similarly, our results suggest that balancing selection at some traits can act in nature at small population size and hence potentially buffer, to some degree, against the loss of genetic diversity at loci of high evolutionary importance [10,13].
The observed differences in selective pressures between small and large populations and the increase in their variability at smaller population size also have potentially important conservation ramifications in the face of growing, worldwide habitat fragmentation of natural populations. These results suggest that habitat fragmentation generates both directional and increasingly diversified changes to selective pressures as population size is reduced. Thus, (i) large and small populations can represent distinct entities, and (ii) collectively, different small populations may in fact harbour unique variation that is adaptive in a wide range of circumstances. Such knowledge is beneficial for a more informed approach to setting biodiversity conservation programmes and priorities.
A last but perhaps most important conservation implication of our work stems from the evidence of more varying selective pressures in small than large populations. This finding supports a previous contention that responses to environmental change, and ultimately the probability of persistence, may become more variable as habitat is fragmented and population sizes are reduced [7]. Indeed, such ‘evolutionary stochasticity’ (to distinguish it from demographic, environmental or genetic stochasticity) might in fact occur well before populations become sufficiently small to succumb to classic genetic effects such as genetic drift and inbreeding depression. Collectively, our work reiterates the need for further integration of natural selection into conservation biology theory [5,20,43].
Supplementary Material
Acknowledgements
We thank M. Yates, J. Wood, S. Belmar-Lucero, L. Weir, A. Harbicht, M. Bonamy and A. Meli for assistance with field sampling, R. Carson for assistance with microsatellite genotyping and A. Belisle from Genome Quebec for assistance with SNP genotyping.
Research undertaken in this study complies with the requirements of the Canadian Council on Animal Care (CCAC).
Data accessibility
SNP datafile: Dryad doi:10.5061/dryad.6t794 (http://datadryad.org/review?wfID=30936&token=9cd8f117–82ea-473f-ace1-fd685d5322fa)
Funding statement
Funding was provided by NSERC (Natural Sciences and Engineering Research Council) Discovery grants to J.A.H. and D.J.F.
References
- 1.MacArthur RH, Wilson EO. 1967. The theory of island biogeography. Princeton, NJ: Princeton University Press. [Google Scholar]
- 2.Saccheri I, Kuussari M, Kankare M, Hanski I. 1998. Inbreeding and extinction in a butterfly metapopulation. Nature 392, 491–494. ( 10.1038/33136) [DOI] [Google Scholar]
- 3.Fahrig L. 2003. Effects of habitat fragmentation on biodiversity. Annu. Rev. Ecol. Evol. Syst. 34, 487–515. ( 10.1146/annurev.ecolsys.34.011802.132419) [DOI] [Google Scholar]
- 4.Bijlsma R, Loeschcke V. 2012. Genetic erosion impedes adaptive responses to stressful environments. Evol. Appl. 5, 117–129. ( 10.1111/j.1752-4571.2011.00214.x) [DOI] [PMC free article] [PubMed] [Google Scholar]
- 5.Willi Y, Van Buskirk J, Schmid B, Fischer M. 2007. Genetic isolation of fragmented populations is exacerbated by drift and selection. J. Evol. Biol. 20, 534–542. ( 10.1111/j.1420-9101.2006.01263.x) [DOI] [PubMed] [Google Scholar]
- 6.Willi Y, Hoffmann AA. 2012. Microgeographic adaptation linked to forest fragmentation and habitat quality in the tropical fruit fly Drosophila birchii. Oikos 121, 1627–1637. ( 10.1111/j.1600-0706.2011.20156.x) [DOI] [Google Scholar]
- 7.Wood JLA, Belmar-Lucero S, Hutchings JA, Fraser DJ. 2014. Relationship of population size to habitat variability in a stream fish. Ecol. Appl. 24, 1085–1100. ( 10.1890/13-1647.1) [DOI] [PubMed] [Google Scholar]
- 8.Hoffman AA, Blows MW. 1994. Species borders: ecological and evolutionary perspectives. Trends Ecol. Evol. 9, 223–227. ( 10.1016/0169-5347(94)90248-8) [DOI] [PubMed] [Google Scholar]
- 9.Kawecki TJ. 2008. Adaptation to marginal habitats. Annu. Rev. Ecol. Evol. Syst. 39, 321–342. ( 10.1146/annurev.ecolsys.38.091206.095622) [DOI] [Google Scholar]
- 10.Frankham R, Ballou JD, Briscoe DA. 2002. Introduction to conservation genetics. Cambridge, UK: Cambridge University Press. [Google Scholar]
- 11.Koskinen MT, Haugen TO, Primmer CR. 2002. Contemporary fisherian life-history evolution in small salmonid populations. Nature 419, 826–830. ( 10.1038/nature01029) [DOI] [PubMed] [Google Scholar]
- 12.Hendry AP, Kinnison MT, Heino M, Day T, Smith TB, Fitt G. 2011. Evolutionary principles and their practical application. Evol. Appl. 4, 159–183. ( 10.1111/j.1752-4571.2010.00165.x) [DOI] [PMC free article] [PubMed] [Google Scholar]
- 13.Aguilar A, Roemer G, Debenham S, Binns M, Garcelon D, Wayne RK. 2004. High MHC diversity maintained by balancing selection in an otherwise genetically monomorphic mammal. Proc. Natl Acad. Sci. USA 101, 3490–3494. ( 10.1073/pnas.0306582101) [DOI] [PMC free article] [PubMed] [Google Scholar]
- 14.Kotliar CB, Baker BW, Whicker AD, Plumb G. 1999. A critical review of assumptions about the prairie dog as a keystone species. Environ. Manag. 24, 177–192. ( 10.1007/s002679900225) [DOI] [PubMed] [Google Scholar]
- 15.Waples RS, Do C. 2008. LDNE: a program for estimating effective population size from data on linkage disequilbrium. Mol. Ecol. Resour. 8, 753–756. ( 10.1111/j.1755-0998.2007.02061.x) [DOI] [PubMed] [Google Scholar]
- 16.Ouborg N, Pertoldi C, Loeschcke V, Bijlsma RK, Hedrick PW. 2010. Conservation genetics in transition to conservation genomics. Trends Genet. 26, 177–187. ( 10.1016/j.tig.2010.01.001) [DOI] [PubMed] [Google Scholar]
- 17.Ellegren H. 2014. Genome sequencing and population genomics in non-model organisms. Trends Ecol. Evol. 29, 51–63. ( 10.1016/j.tree.2013.09.008) [DOI] [PubMed] [Google Scholar]
- 18.Waples RS, Luikart G, Faulkner JR, Tallmon DA. 2013. Simple life history traits explain key effective population size ratios across diverse taxa. Proc. R. Soc. B 280, 20131339 ( 10.1098/rspb.2013.1339) [DOI] [PMC free article] [PubMed] [Google Scholar]
- 19.Palstra FP, Fraser DJ. 2012. Effective/census population size ratio estimation: a compendium and appraisal. Ecol. Evol. 2, 2357–2365. ( 10.1002/ece3.329) [DOI] [PMC free article] [PubMed] [Google Scholar]
- 20.Lande R, Barrowclough GF. 1988. Effective population size, genetic variation, and their use in population management. In Viable populations for conservation (ed. Soulé ME.), pp. 87–123. Cambridge, UK: Cambridge University Press. [Google Scholar]
- 21.Danzmann RG, Morgan R, Jones M, Bernatchez L. 1998. A major sextet of mitochondrial DNA phylogenetic assemblages extant in eastern North American brook charr (Salvelinus fontinalis): distribution and postglacial dispersal patterns. Can. J. Zool. 76, 1300–1318. ( 10.1139/cjz-76-7-1300) [DOI] [Google Scholar]
- 22.Hutchings JA. 1993. Adaptive life histories effected by age-specific survival and growth rate. Ecology 74, 673–684. ( 10.2307/1940795) [DOI] [Google Scholar]
- 23.Hutchings JA. 1994. Age- and size-specific costs of reproduction within populations of brook trout, Salvelinus fontinalis. Oikos 10, 12–20. ( 10.2307/3545693) [DOI] [Google Scholar]
- 24.Schnabel ZE. 1938. Estimation of the total fish population in a lake. Am. Math. Mon. 45, 348–352. ( 10.2307/2304025) [DOI] [Google Scholar]
- 25.Petersen CGJ. 1896. The yearly immigration of young plaice into the Limfjord from the German Sea. Rep. Dan. Biol. Station 1895 6, 1–77. [Google Scholar]
- 26.Sauvage C, Derome N, Audet C, Bernatchez L. 2012. Coding gene SNP mapping reveals QTL related to growth and stress response in brook charr (Salvelinus fontinalis). Genes Genomes Genet. (Bethesda) 2, 707–720. ( 10.1534/g3.112.001990) [DOI] [PMC free article] [PubMed] [Google Scholar]
- 27.Sauvage C, Vagner M, Derome N, Audet C, Bernatchez L. 2012. Coding gene SNP mapping and QTL detection for physiological reproductive traits in brook charr, Salvelinus fontinalis. Genes Genomes Genet. (Bethesda) 2, 379–392. ( 10.1534/g3.111.001867) [DOI] [PMC free article] [PubMed] [Google Scholar]
- 28.Weir BS, Reynolds J, Dodds KG. 1990. The variance of sample heterozygosity. Theor. Pop. Biol. 37, 235–253. ( 10.1016/0040-5809(90)90038-W) [DOI] [PubMed] [Google Scholar]
- 29.Bates D, Maechler M, Bolker B. 2012. lme4: linear mixed-effects models using S4 classes R package v. 0.999999–0 See http://CRAN.R-project.org/package=lme4.
- 30.R Core Team. 2013. R: a language and environment for statistical computing. Vienna, Austria: R Foundation for Statistical Computing; (http://www.R-project.org/) [Google Scholar]
- 31.Antao T, Lopes A, Lopes RJ, Beja-Pereira A, Luikart G. 2008. LOSITAN: a workbench to detect molecular adaptation based on a Fst-outlier method. BMC Bioinform. 9, 323 ( 10.1186/1471-2105-9-323) [DOI] [PMC free article] [PubMed] [Google Scholar]
- 32.Benjamini Y, Hochberg Y. 1995. Controlling the false discovery rate: a practical and powerful approach to multiple testing. J. R. Stat. Soc. B (Stat. Methodol.) 57, 289–300. [Google Scholar]
- 33.Kenward MG, Roger JH. 1997. Small sample inference for fixed effects from restricted maximum likelihood. Biometrics 53, 983–997. ( 10.2307/2533558) [DOI] [PubMed] [Google Scholar]
- 34.Perez-Figueroa A, Garcia-Pereira MJ, Saura M, Rolan-Alvarez E, Caballero A. 2010. Comparing three different methods to detect selective loci using dominant markers. J. Evol. Biol. 23, 2267–2276. ( 10.1111/j.1420-9101.2010.02093.x) [DOI] [PubMed] [Google Scholar]
- 35.Franklin IR. 1980. Evolutionary change in small populations. In Conservation biology: an evolutionary-ecological perspective. Sunderland, MA: Sinauer. [Google Scholar]
- 36.Belmar-Lucero S, Wood JLA, Scott S, Harbicht AB, Hutchings JA, Fraser DJ. 2012. Concurrent habitat and life history influences on effective/census population size ratios in stream-dwelling trout. Ecol. Evol. 2, 562–573. ( 10.1002/ece3.196) [DOI] [PMC free article] [PubMed] [Google Scholar]
- 37.Strasburg JL, Sherman NA, Wright KM, Moyle LC, Willis JH, Rieseberg LH. 2012. What can patterns of differentiation across plant genomes tell us about adaptation and speciation? Phil. Trans. R. Soc. B 367, 364–373. ( 10.1098/rstb.2011.0199) [DOI] [PMC free article] [PubMed] [Google Scholar]
- 38.Lamaze FC, Marie A, Garant D, Bernatchez L. 2012. Dynamics of introgressive hybridization assessed by coding genes SNP population genomics in stocked brook charr (Salvelinus fontinalis). Mol. Ecol. 21, 2877–2895. ( 10.1111/j.1365-294X.2012.05579.x) [DOI] [PubMed] [Google Scholar]
- 39.Fraser DJ, Calvert AM, Bernatchez L, Coon A. 2013. Multidisciplinary population monitoring when demographic data are sparse: a case study of remote trout populations. Ecol. Evol. 3, 4954–4969. ( 10.1002/ece3.871) [DOI] [PMC free article] [PubMed] [Google Scholar]
- 40.Foll M, Gaggiotti O. 2008. A genome-scan method to identify selected loci appropriate for both dominant and codominant markers: a Bayesian perspective. Genetics 180, 977–993. ( 10.1534/genetics.108.092221) [DOI] [PMC free article] [PubMed] [Google Scholar]
- 41.Le Corre V, Kremer A. 2012. The genetic differentiation of quantitative trait loci under local adaptation. Mol. Ecol. 21, 1548–1566. ( 10.1111/j.1365-294X.2012.05479.x) [DOI] [PubMed] [Google Scholar]
- 42.Thompson JN. 2013. Relentless evolution. Chicago, IL: University of Chicago Press. [Google Scholar]
- 43.Stockwell CA, Hendry AP, Kinnison MT. 2003. Contemporary evolution meets conservation biology. Trends Ecol. Evol. 18, 94–101. ( 10.1016/S0169-5347(02)00044-7) [DOI] [Google Scholar]
Associated Data
This section collects any data citations, data availability statements, or supplementary materials included in this article.
Supplementary Materials
Data Availability Statement
SNP datafile: Dryad doi:10.5061/dryad.6t794 (http://datadryad.org/review?wfID=30936&token=9cd8f117–82ea-473f-ace1-fd685d5322fa)