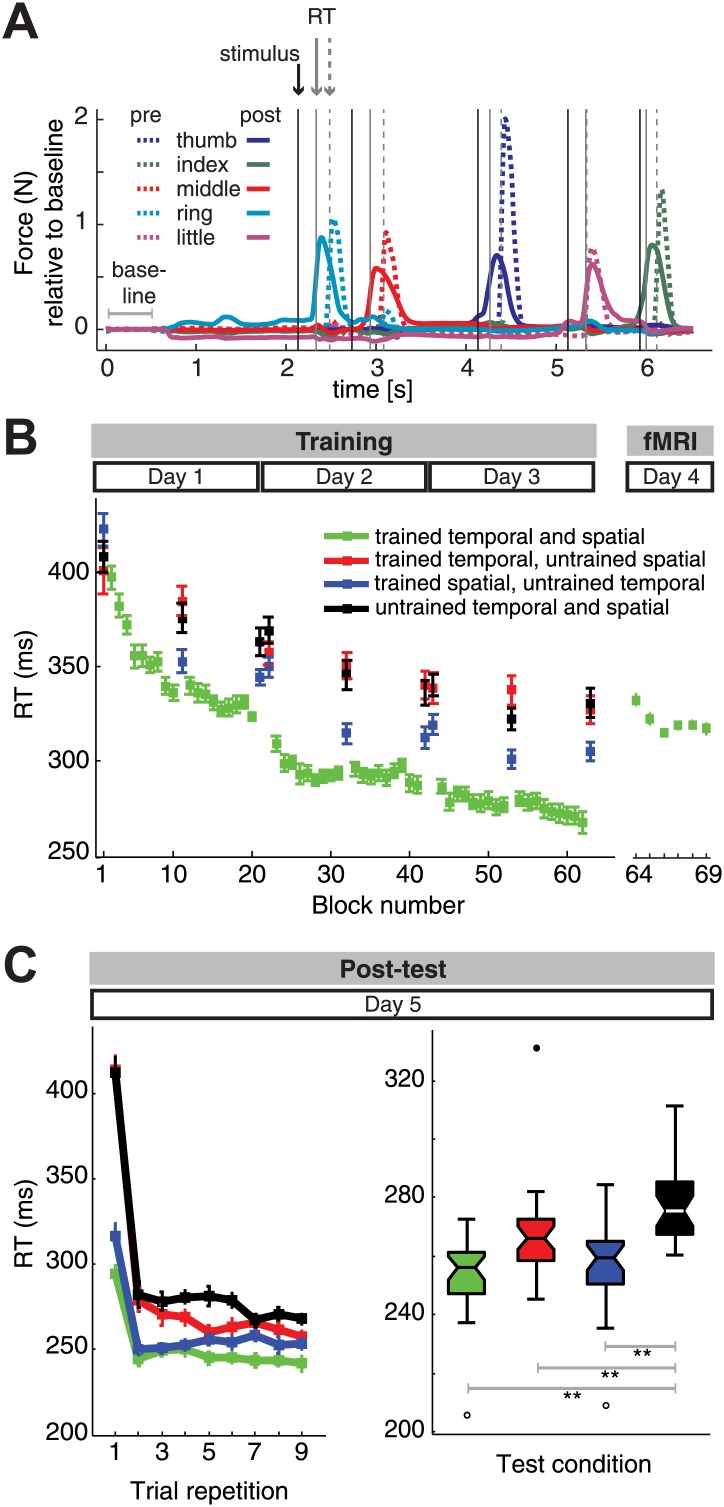
Figure 2. Reaction time (RT) results.
(A) Two trial examples of force traces show faster finger responses to visual stimuli after (‘post’) as opposed to the beginning of training (‘pre’). (B) Subjects showed general and sequence-specific learning during the training of the combined temporal and spatial sequences. The RT remained relatively stable across the fMRI session runs, albeit overall higher than at the end of training outside the MRI environment. (C) Post-test results. Left panel: repeating sequences nine times in the test phase yielded an immediate RT decrease for trained spatial sequences (blue) relative to untrained sequences (black), and only delayed RT differences for trained temporal sequences (red), in line with previous results (Kornysheva et al., 2013). Right panel: a boxplot displaying RT results across subjects and all sequence repetitions in the post-test revealed significant RT advantages for the trained sequence, as well as the trained spatial and trained temporal feature conditions when compared to untrained sequences, suggesting that both the finger order and their relative timing were represented independently. A double asterisk (**) indicates a significant difference between conditions with p<0.01. Errorbars in the lineplots and maximum and minimum RTs (boxplot whiskers) are corrected for differences in the mean RT across individuals, and therefore represent the interindividual variability of relative RT differences across conditions. In the boxplot, upper and lower edges signify the 75th (third quartile) and 25th percentile (first quartile), respectively. The median is designated as a horizontal white or black line in the box. Outliers (equal or above 3*interquartile range above the third quartile or below the first quartile) are depicted as filled circles, suspected outliers (1.5*interquartile range above the third quartile and below the first quartile) are depicted as unfilled circles, respectively.


