Three-station bolus-chase MR angiography with fluoroscopic tracking provides high-spatial-resolution arteriograms along the extent of the peripheral vasculature, enables patient-specific triggering of table motion, and is a promising alternative to contemporary MR angiography and CT angiographic methods.
Abstract
Purpose
To determine the feasibility of using real-time fluoroscopic tracking for bolus-chase magnetic resonance (MR) angiography of peripheral vasculature to image three stations from the aortoiliac bifurcation to the pedal arteries.
Materials and Methods
This prospective study was institutional review board approved and HIPAA compliant. Eight healthy volunteers (three men; mean age, 48 years; age range, 30–81 years) and 13 patients suspected of having peripheral arterial disease (five men; mean age, 67 years; age range, 47–81 years) were enrolled and provided informed consent. All subjects were imaged with the fluoroscopic tracking MR angiographic protocol. Ten patients also underwent a clinical computed tomographic (CT) angiographic runoff examination. Two readers scored the MR angiographic studies for vessel signal intensity and sharpness and presence of confounding artifacts and venous contamination at 35 arterial segments. Mean aggregate scores were assessed. The paired MR angiographic and CT angiographic studies also were scored for visualization of disease, reader confidence, and overall diagnostic quality and were compared by using a Wilcoxon signed rank test.
Results
Real-time fluoroscopic tracking performed well technically in all studies. Vessel segments were scored good to excellent in all but the following categories: For vessel signal intensity and sharpness, the abdominal aorta, iliac arteries, distal plantar arteries, and plantar arch were scored as fair to good; and for presence of confounding artifacts, the abdominal aorta and iliac arteries were scored as fair. The MR angiograms and CT angiograms did not differ significantly in any scoring category (reader 1: P = .50, .39, and .39; reader 2: P = .41, .61, and .33, respectively). CT scores were substantially better in 20% (four of 20) and 25% (five of 20) of the pooled evaluations for the visualization of disease and overall image quality categories, respectively, versus 5% (one of 20) for MR scores in both categories.
Conclusion
Three-station bolus-chase MR angiography with real-time fluoroscopic tracking provided high-spatial-resolution arteriograms of the peripheral vasculature, enabled precise triggering of table motion, and compared well with CT angiograms.
© RSNA, 2014
Introduction
Bolus-chase contrast material–enhanced magnetic resonance (MR) angiography is commonly used to image peripheral arterial disease throughout the lower extremities. Since its introduction 15 years ago (1,2), bolus-chase MR angiography has continued to evolve, with technical advancements that have improved imaging efficiency, spatiotemporal resolution, and acquisition timing. Current techniques use station-specific imaging parameters (3), parallel imaging with an acceleration factor as high as R of 4 (4,5), patient-specific and physiologically based imaging parameters (6), and often, hybrid techniques to acquire time-resolved images at the most distal station before the bolus-chase runoff (7,8). These and other technical developments have made bolus-chase MR angiography a competitive alternative to other modalities such as computed tomographic (CT) angiography and digital subtraction angiography (9–11).
Bolus-chase MR angiography will continue to benefit from technical advancements to address a number of limitations. First, current techniques typically involve two or more injections of contrast material to estimate the contrast material bolus transit time or allow multiple phases of arterial imaging, which adds time, complexity, and possible contrast material dose to the imaging protocol. Second, spatiotemporal resolution is often limited to reduce proximal station dwell times to keep pace with the progressing contrast material bolus. Third, fixed imaging parameters and timing protocols often are used and cannot easily be adapted to efficiently account for patient-specific hemodynamics.
A recently described approach to bolus-chase MR angiography called fluoroscopic tracking potentially can address these limitations. Fluoroscopic tracking has been demonstrated for dual-station imaging of the thighs and calves (12) and calves and feet (13). In these feasibility studies, high net image acceleration (Rnet > 14) and view sharing were applied to acquire three-dimensional (3D) angiograms at two imaging stations with both high spatial (≤ 1.0 mm3) and high temporal (frame time, 2.5–6.7 seconds) resolution. In addition, 3D time frames at the proximal station were reconstructed in real time, enabling visual tracking of the arrival and progression of the contrast material bolus and manual triggering of table advance to the distal station. The method allows imaging after a single injection of contrast material, without prior knowledge of patient hemodynamics or contrast material bolus transit times, and the nominal spatiotemporal resolution observed is competitive with that of single-station contrast-enhanced MR angiographic methods.
The purpose of this study was to perform a preliminary clinical feasibility study of the real-time fluoroscopic tracking technique for bolus-chase MR angiography of peripheral vasculature to image three stations extending from the aortoiliac bifurcation to the pedal arteries.
Materials and Methods
Fluoroscopic Tracking Technique
Fluoroscopic tracking is used to image proximal stations with sufficient spatial and temporal resolution to acquire diagnostic-quality 3D angiograms, enable real-time assessment of contrast material bolus progression, and avoid venous contamination at the most distal station. To accomplish this for three-station imaging, the proximal abdomen-pelvis and thigh stations were imaged with the following technical specifications: (a) frame time of 2.5 seconds to allow precise tracking of the contrast material bolus, (b) isotropic spatial resolution of 1.5 mm for accurate diagnosis, (c) temporal footprint of less than 7 seconds to increase image quality rapidly (14) and enable a short station dwell time (< 10 seconds) to chase the contrast material bolus quickly down the periphery, and (d) latency of reconstructed time frames of less than 250 msec to provide sufficient time for the operator to trigger table motion. The most distal calf-foot station was imaged with isotropic spatial resolution of 1.0 mm and frame time relaxed to 5.2 seconds. Note that the spatial resolution of the proximal stations is not required to be as fine as that of the calf-foot station because of larger vessel size, which allows for higher real-time temporal resolution.
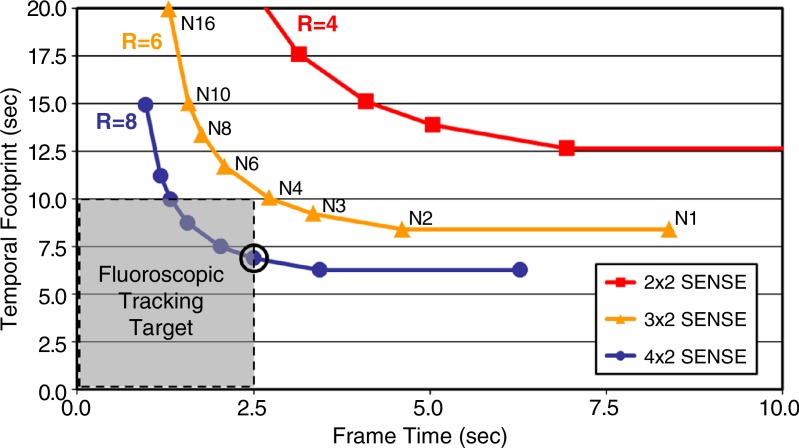
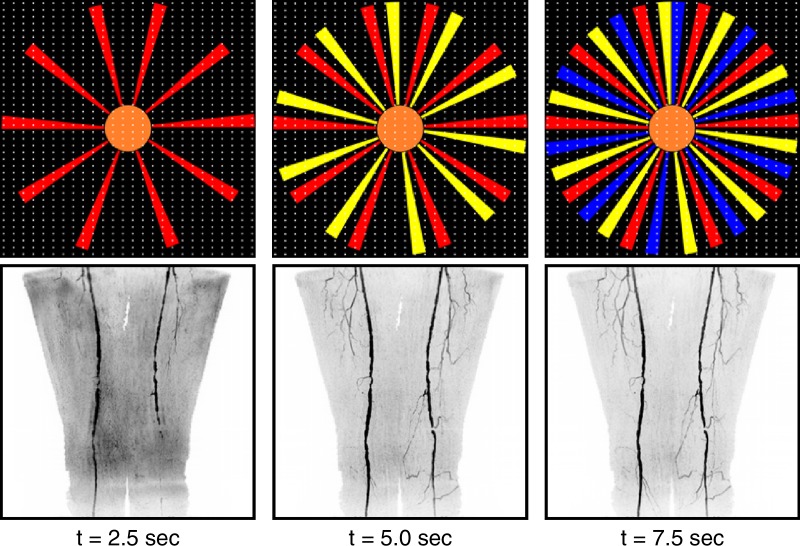
To achieve these technical performance targets, spatial and temporal resolution was carefully balanced by using a highly accelerated acquisition strategy (Fig 1). The CAPR technique (15) was used in combination with two-dimensional sensitivity encoding (R = 8) (16) and two-dimesnional partial Fourier acceleration (R = 1.9) to update time frames rapidly and increase image quality by means of view sharing with a short temporal footprint (14). The fluoroscopic tracking method has been outlined previously for two-station imaging (12) and consists of data collection with multiple receiver arrays, feeding of raw data to a custom reconstruction server, real-time display of reconstructed 3D time-frame maximum intensity projections (MIPs) on a graphic user interface, and operator-triggered table motion with feedback to the imaging system. A similar arrangement was used in this study with real-time processing at two proximal stations.
Figure 1a:
(a) Graph shows temporal footprint versus frame time for Cartesian acquisition with projection-reconstruction–like sampling (CAPR) sequences with view share factor N, two-dimensional (2D) sensitivity-encoding (SENSE) acceleration (R), and imaging parameters matching those for the abdomen-pelvis station (Table 1). Temporal footprint defines temporal extent of information required to sample kY-kZ phase-encoding plane fully. For fluoroscopic tracking at proximal stations, temporal footprint less than 10 seconds and frame time of 2.5 seconds are desired (gray box). N3 CAPR sequence with R of 8 2D sensitivity-encoding (circled point) meets these targets and was used in this study. (b) Temporal filling of N3 CAPR pattern with sample patient coronal MR angiographic thigh station time frames from this study (subject 20) below each phase. During first 2.5 seconds, center of the kY-kZ phase-encoding plane (orange) and one of three high-pass vane sets (red) were sampled, producing first angiogram. During next 2.5 seconds (5.0 seconds total), center is resampled and second vane set (yellow) is sampled, which quickly builds up vessel signal intensity and sharpness in second angiogram. Entire k-space is filled after 7.5 seconds with sampling of third vane set (blue).
Figure 1b:
(a) Graph shows temporal footprint versus frame time for Cartesian acquisition with projection-reconstruction–like sampling (CAPR) sequences with view share factor N, two-dimensional (2D) sensitivity-encoding (SENSE) acceleration (R), and imaging parameters matching those for the abdomen-pelvis station (Table 1). Temporal footprint defines temporal extent of information required to sample kY-kZ phase-encoding plane fully. For fluoroscopic tracking at proximal stations, temporal footprint less than 10 seconds and frame time of 2.5 seconds are desired (gray box). N3 CAPR sequence with R of 8 2D sensitivity-encoding (circled point) meets these targets and was used in this study. (b) Temporal filling of N3 CAPR pattern with sample patient coronal MR angiographic thigh station time frames from this study (subject 20) below each phase. During first 2.5 seconds, center of the kY-kZ phase-encoding plane (orange) and one of three high-pass vane sets (red) were sampled, producing first angiogram. During next 2.5 seconds (5.0 seconds total), center is resampled and second vane set (yellow) is sampled, which quickly builds up vessel signal intensity and sharpness in second angiogram. Entire k-space is filled after 7.5 seconds with sampling of third vane set (blue).
Subjects
The study was approved by the institutional review board, and each participant provided written informed consent. Eight healthy volunteers and 13 patients suspected of having peripheral arterial disease participated in this prospective Health Insurance Portability and Accountability Act–compliant study between October 2011 and December 2012. Three of the healthy subjects were men (mean age, 57 years; age range, 44–81 years) and five were women (mean age, 43 years; range, 30–53 years). Of the patients, five were men (mean age, 77 years; range, 72–81 years) and eight were women (mean age, 61 years; range, 47–79 years). All subjects underwent a three-station contrast-enhanced MR angiographic examination with fluoroscopic tracking. The healthy volunteers and 10 of the patients were recruited, whereas the other three patients were referred clinically for the MR angiographic technique. The 10 recruited patients (four men and six women) also were imaged with bolus-chase CT angiography up to 1 day before MR angiography, which is the standard clinical runoff protocol at our institution. These patients were scheduled for a clinical CT angiographic examination with an indication for peripheral arterial disease at the time of recruitment. Recruitment was only attempted if the MR imaging system on which the fluoroscopic tracking protocol was implemented was available within 1 day of the CT angiographic examination. To be included in the study, participants were required to be at least 18 years old. Study exclusion criteria were metal in body (n = 6); allergy to contrast agent (n = 3); claustrophobia (n = 3); estimated glomerular filtration rate less than 30 mL/min/1.73 m2 (n = 4); pregnancy or breast feeding (n = 0); and scheduling conflicts (n = 12). Qualitative results for five of the healthy volunteers studied were previously reported in a conference abstract (17).
MR Angiographic Imaging Protocol
Subjects were imaged at three stations (abdomen-pelvis, thigh, and calf-foot), each providing 42 cm of superior-to- inferior coverage, by using a 3-T MR imaging system (Discovery MR750; GE Healthcare, Waukesha, Wis). The extended longitudinal field of view (FOV) was 122 cm after two 40-cm table moves. A custom-built 32-channel modular receiver coil array was used to provide high parallel imaging performance at each station. The array consisted of 16 pairs of identically shaped rectangular elements (length, 40 cm; width, 13 cm) that could be combined to fit a variety of body types. In this study, 12, 10, and eight coil elements were typically used at the abdomen-pelvis, thigh, and calf-foot stations, respectively, to provide a close fit to the body. At each station, the elements were configured in a linear array and then wrapped circumferentially around the patient. Before the receiver arrays were secured at each station, the subject’s legs were wrapped in a sheet to minimize motion and the feet were wrapped in a warm blanket to promote vasodilation for improved visibility of the pedal arteries. The three-station imaging protocol consisted of the following steps: (a) scout acquisitions, (b) volume prescriptions and prescanning, (c) calibration acquisitions for unfolding at sensitivity encoding, (d) real-time system initialization and calculation of inversion matrices at sensitivity encoding, (e) subtraction mask acquisitions, (f) contrast material injection, and (g) time-resolved bolus-chase runoff acquisition with fluoroscopic tracking providing real-time triggering of table advance. This protocol typically required 15 minutes to complete all three stations. Patients were instructed to breathe shallowly to reduce respiratory motion while the abdomen-pelvis station was imaged.
Station-specific imaging parameters for the 3D time-resolved bolus-chase MR angiographic acquisition with fluoroscopic tracking are listed in Table 1. The delay time to switch between stations was 5.0 seconds, which included time to close the station sequence after completing the acquisition (1.0 second), physically move the table (3.0 seconds), load the next station sequence (0.65 second), and perform dummy repetitions to reach a sufficient steady-state signal for reliable subtraction (0.35 second). Receiver array coils were switched dynamically so that only coils at the imaging station were sampled. Intravenous administration of a single dose of contrast material by using a power injector (Spectris Solaris; Medrad, Indianola, Pa) consisted of 8–20 mL (mean dose, 0.14 mmol/kg; range, 0.08–0.20 mmol/kg) of gadobenate dimeglumine (MultiHance; Bracco Diagnostics, Princeton, NJ) followed by 20 mL of saline flush injected at a rate of 2–3 mL/sec. The volume of administered contrast material was determined on the basis of each individual’s estimated glomerular filtration rate measured in units of milliliters per minute per 1.73 m2. A standard volume of 20 mL was administered if the estimated glomerular filtration rate was greater than 60 mL/min/1.73 m2. If the estimated glomerular filtration rate was less than 60 mL/min/1.73 m2, then the volume was reduced to yield a dose of 0.08 mmol/kg. For display, proximal station angiograms were interpolated to a 1.0-mm isotropic resolution to match the calf-foot station resolution.
Table 1.
Three-Station Bolus-Chase MR Angiographic Imaging Parameters
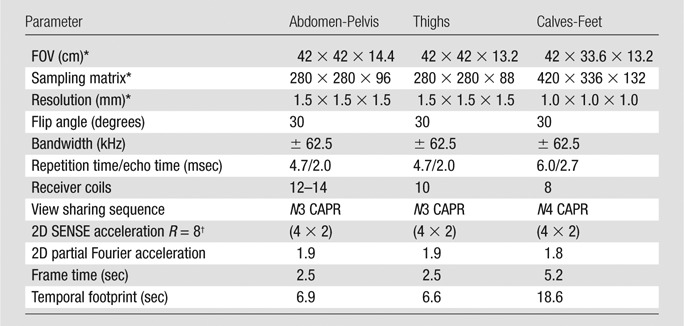
Note.—SENSE = sensitivity encoding, 2D = two-dimensional.
Superior to inferior × left to right × anterior to posterior
Left to right × anterior to posterior
CT Angiographic Imaging Protocol
CT angiography was performed by using a dual-source CT system (Definition; Siemens, Erlangen, Germany) with a detector configuration of 128 × 0.6 mm; rotation time, 0.5 seconds; and pitch, 0.4. Source peak voltage and current were 120 kVp and 250 mA, respectively, and automated tube current modulation was used. Iohexol contrast agent (Omnipaque 350; GE Healthcare) was administered via power injector in a rate-based split injection algorithm (first dose, 20–30 mL at 4–6 mL/sec; second dose, 95–140 mL at 3–4 mL/sec) followed by a 30-mL saline flush at 3–4 mL/sec. Automated triggering was used. Images were reconstructed with in-plane resolution of 0.6 × 0.6 mm2, superior-to-inferior section thickness of 2.0 mm, and intervals of 1.2 mm. Anatomic coverage extended from the top of the diaphragm to the toes. After the first imaging sequence, a second sequence was performed immediately from the knees to the toes in patients older than 50 years in case the first sequence was performed too early to visualize the effect of the contrast material bolus.
Image Quality Assessment
Angiographic image quality was independently evaluated in two parts by two radiologists who specialize in body MR and CT imaging (J.F.G. and P.M.Y., with 16 and 4 years of experience, respectively). The readers had access to all source images of the MR and CT angiographic examinations, including the time series volumes. Evaluations were performed by using a workstation (AW Workstation; GE Healthcare) and software (TeraRecon, Foster City, Calif). In the first part, the MR angiographic studies (n = 21) were scored in four image quality categories: (a) vessel signal intensity, (b) vessel sharpness, (c) presence of confounding artifacts, and (d) presence of confounding venous contamination. Seventeen arterial segments were scored bilaterally, and the distal abdominal aorta (35 segments total) was scored on a scale of 1–5 (1 = poor, 2 = marginal, 3 = fair, 4 = good, and 5 = excellent). No score was given in cases where an arterial segment was not seen (eg, because of disease or being positioned outside of the FOV). In the second part, the 10 companion MR and CT angiograms were scored pairwise in three categories: (a) visualization of disease, (b) reading confidence, and (c) overall diagnostic quality. Scores were given on a ranked scale of −2 to +2 (−2 = MR angiography substantially better, −1 = MR angiography marginally better, 0 = neutral, +1 = CT angiography marginally better, and +2 = CT angiography substantially better).
Bolus Timing Assessment
For all MR angiographic studies, the times at which (a) the contrast material bolus was first observed (detection time), (b) the contrast material bolus was observed to reach the distal end of the station FOV in both legs (traversal time), and (c) table motion was initiated to the subsequent station (trigger time) were recorded at both proximal stations. From these measurements, the station dwell (trigger minus detection), bolus transit (traversal minus detection), and the trigger delay (trigger minus traversal) times were calculated. The contrast material bolus progression was considered rapid if the bolus transit times at the abdomen-pelvis and thigh stations were less than 5 seconds and 2.5 seconds, respectively, and slow if the times were greater than 5 seconds and 2.5 seconds, respectively.
Statistical Analysis
The mean and standard deviation of reader aggregate vessel segment scores for each image quality category were separately calculated for the eight healthy volunteer and 13 patient studies. Scores for each leg were combined in the averages. To determine if either reader scored the MR or CT angiographic studies more favorably in each comparison category, a Wilcoxon signed rank test was used with a significance threshold of α = 0.05 and an estimated power of 0.8. This calculation was performed by using the R software environment (version 3.0.1; R Foundation for Statistical Computing, Vienna, Austria).
Results
Average image quality assessment scores for each arterial segment are shown in Table 2. Two of the segments, the distal plantar and plantar arch, were often outside of the imaging FOV, and thus, did not receive as many scores. For vessel signal intensity and sharpness, the lowest scoring segments were the abdominal aorta, iliac arteries, distal plantar arteries, and plantar arch, with scores ranging from fair to good. All other segments were scored good to excellent. For presence of confounding artifacts, the abdominal aorta and iliac arteries had the lowest scores and were reported as fair. These artifacts are attributed to imperfect subtractions and sensitivity-encoding–related noise amplification and aliasing, which were most pronounced at the abdomen-pelvis station due to the presence of motion and the anatomy filling nearly all of the FOV. All other vessel segments were scored as good. For presence of confounding venous contamination, all vessel segments received scores of good to excellent. In all categories, the studies of the healthy volunteers typically were scored better than were the patient studies. The greatest difference was in the venous contamination scores at the calf-foot station. Seven of the patient studies had rapid arterial-to-venous transit, which resulted in average scores of good as opposed to excellent for segments distal to the tibioperoneal trunk. Patient scores were lower in the other three categories mostly due to the presence of disease (eg, rapid arterial-to-venous transit, stent artifacts, and complex vasculature and flow). One patient study had particularly poor image quality due to gross motion-related artifacts at all three stations.
Table 2.
Vessel Segment Image Quality Assessment Scores for Both Readers in Aggregate
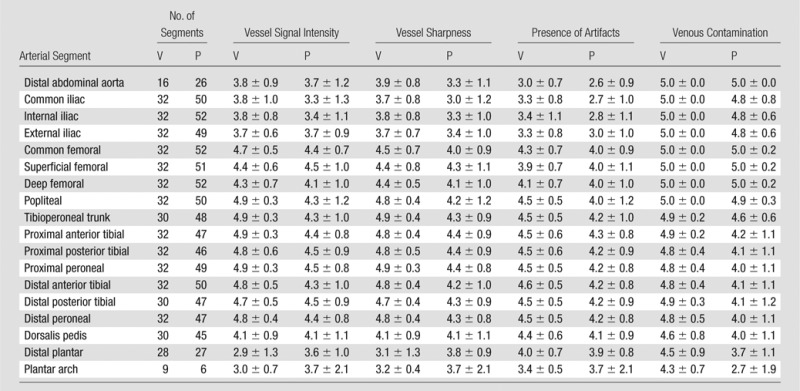
Note.—A five-point scale (5 = best) was used for scoring. Reader aggregate scores are reported as mean ± standard deviation. V = volunteers, P = patients.
No statistically significant differences were observed in the paired MR and CT angiographic comparisons (Table 3). CT angiography tended to be favored overall because it was scored as substantially better in 20% (four of 20) and 25% (five of 20) of the pooled evaluations for the visualization of disease and overall image quality categories, respectively, compared with 5% (one of 20) for MR angiography in both categories. This analysis included subject 18, for whom the CT angiographic study was scored substantially better by both readers in all three categories due to severe motion artifacts in the MR angiographic study. In general, MR angiography was preferred in subjects with slower contrast material bolus progression and arterial-to-venous transit, whereas CT angiography was preferred in subjects whose MR angiograms showed artifacts because of motion, acceleration, or stents or venous contamination due to rapid arterial-to-venous transit.
Table 3.
MR versus CT Angiographic Paired Comparisons
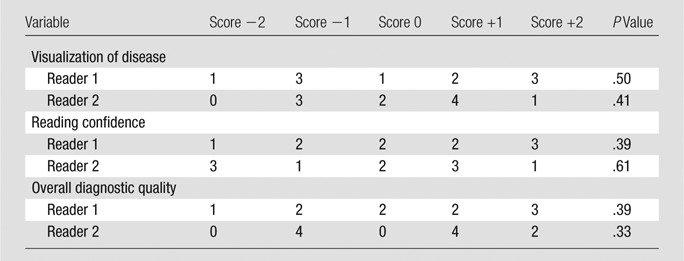
Note.—Score of −2 = MR angiography substantially better, −1 = MR angiography marginally better, 0 = neutral, +1 = CT angiography marginally better, +2 CT angiography substantially better.
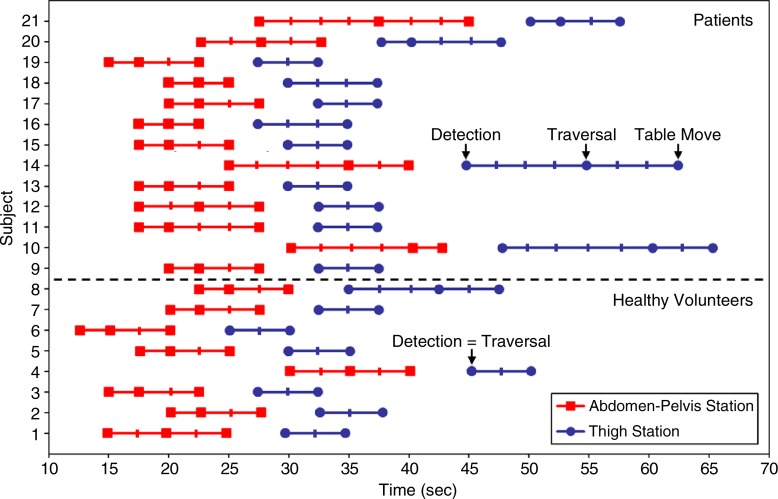
For all 21 patients, the fluoroscopic tracking technique was technically successful in that the contrast material bolus was successfully imaged at both proximal stations in real time, and table advance was successfully triggered by the operator. Bolus timing assessment results are shown in Figure 2 and Table 4. Broad ranges of bolus detection and transit times were accommodated. In most cases, the contrast material bolus had already traversed the thigh station by the time the table had moved to this station. Therefore, the dwell time at this station was typically limited to only 5.0 seconds or two time frames. Despite this short dwell time, image quality at this station was typically good (Table 2). The trigger delay times were usually 5.0 seconds at both stations, which corresponds to triggering the table when the bolus traversed the station FOV.
Figure 2:
Graph shows contrast material bolus detection for all 21 subjects. In many cases, bolus had already traversed thigh station by the time acquisition began there; thus, bolus detection and traversal times were the same. Subjects 1–8 were healthy volunteers and subjects 9–21 were patients. Hash marks on the subject lines indicate fluoroscopic tracking time frame intervals (2.5 seconds), and times are relative to start of contrast material administration.
Table 4.
Bolus Timing Assessment Mean Values and Ranges for All 21 Studies

Note.—Data are means ± standard deviation, with minimum and maximum in parentheses.
Bolus transit is defined as bolus traversal minus bolus detection.
Station dwell is defined as table move minus bolus detection.
Trigger delay is defined as table move minus bolus traversal.
Representative angiograms acquired by using fluoroscopic tracking are shown in Figures 3–6 (also see companion Movies 1–4 [online], respectively, for 3D temporal dynamics and Figures E2 and E3 [online] for additional angiograms). For most healthy volunteers, images were acquired during only two time frames at the thigh station. Despite a resultant short 5.0-second dwell time at this station, image quality was typically good to excellent, and venous contamination was routinely avoided at the calf-foot station (Fig 3, Fig E1 [online]). In patients with slow contrast material bolus progression, fluoroscopic tracking enabled observation of contrast material bolus progression through both proximal stations and led to high image quality throughout the extended FOV (Fig 4). In patients with rapid contrast material bolus progression, the thigh station dwell time was limited to 5.0 seconds, which helped to avoid degrading venous contamination (Fig 5). MR angiograms that were not scored as well typically included artifacts at the abdomen-pelvis station and/or rapid arterial-to-venous transit at the calf-foot station (Fig 6).
Figure 3a:
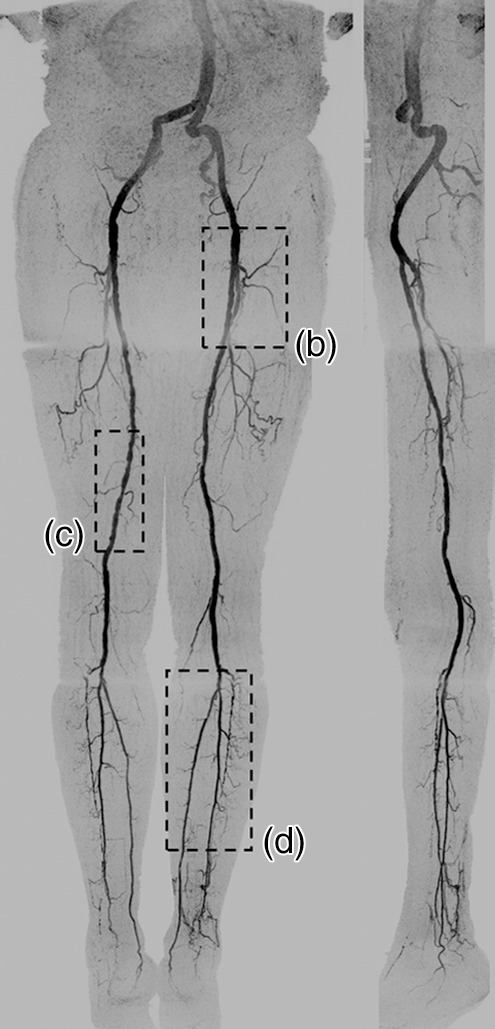
(a) Coronal MIP and sagittal MIP of left leg in a healthy 81-year-old male volunteer (subject 4) generated by using final abdomen-pelvis and thigh station time frames and third calf-foot time frame. Dwell time at thigh station was only 5.0 seconds. (b–d) Targeted coronal MIPs of the boxed regions in a highlight arterial detail. Although this subject was recruited as a healthy volunteer, multiple low-grade stenoses are seen in thigh and calf arteries, and anterior tibial arteries are partially occluded. Contrast material bolus was imaged at four abdomen-pelvis and two thigh station time frames, and venous contamination was avoided at calf-foot station. (Reprinted, with permission, from reference 17.) Also see Figure E1 (online) and Movie 1 (online).
Figure 6:
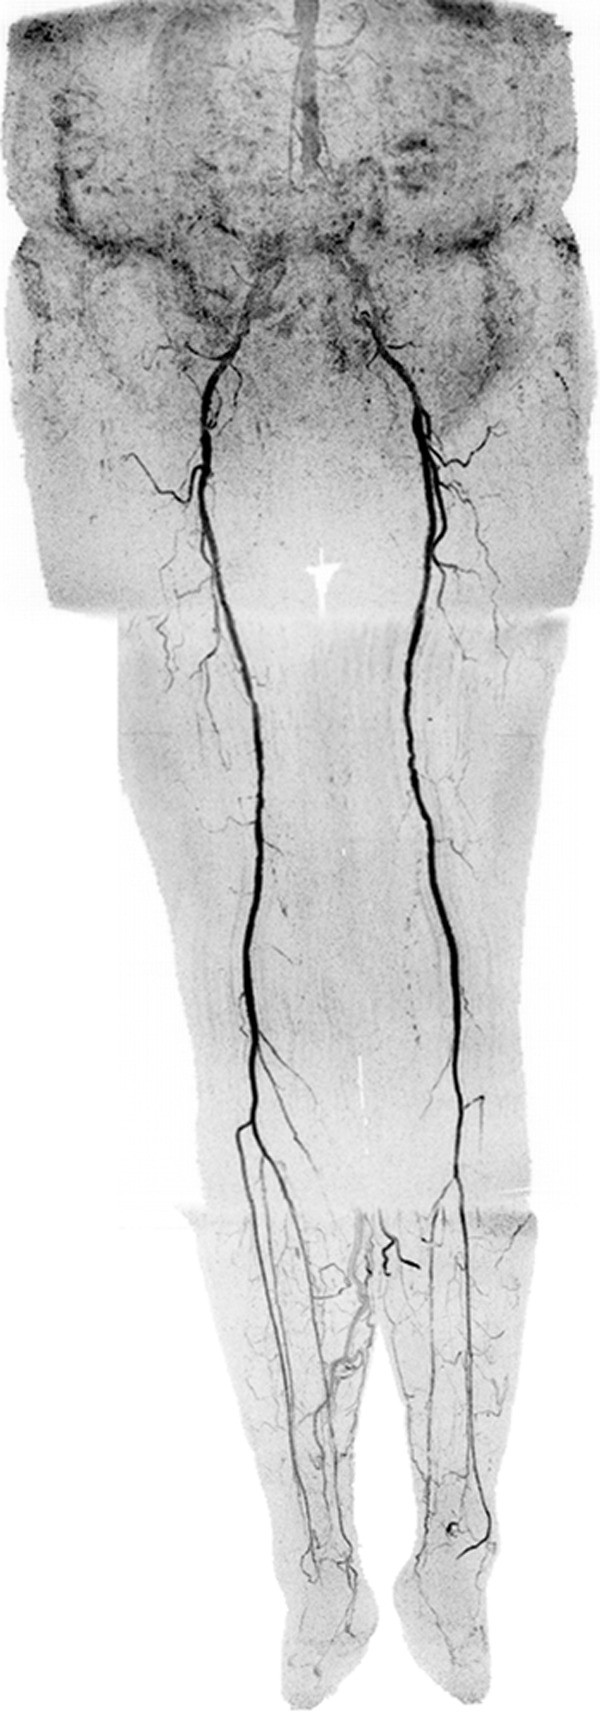
Coronal MIP in a 73-year-old female patient (subject 12) with extensive motion-related artifacts at abdomen-pelvis station and rapid arterial-to-venous transit at calf-foot station. Because of these effects, CT angiography was scored marginally better. Angiogram consists of final abdomen-pelvis and thigh station time frames and third calf-foot time frame. Also see Movie 4 (online).
Figure 4a:
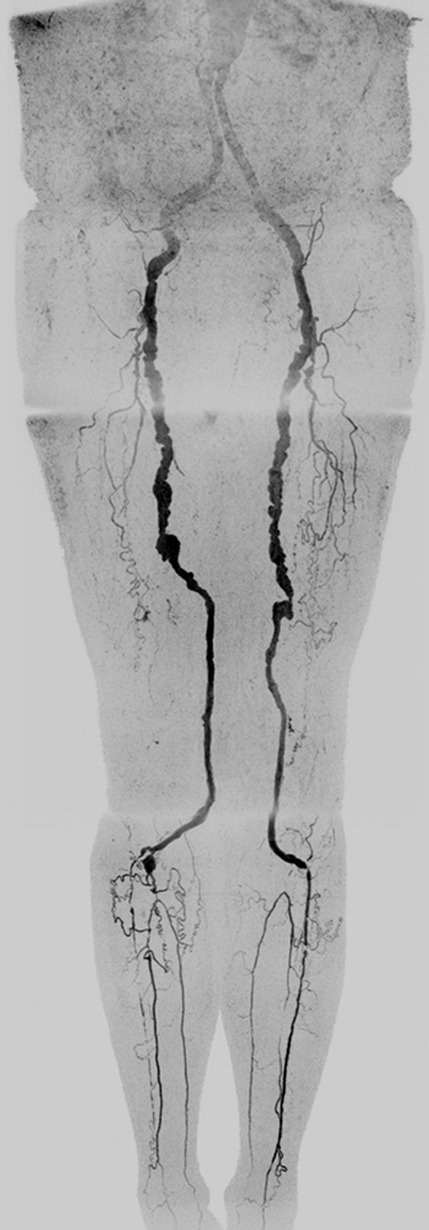
Coronal MIPs of the (a) extended FOV and (b) calf-foot station in an 81-year-old male patient (subject 10) with slow contrast material bolus progression. Transit times at abdomen-pelvis and thigh proximal stations were 10.0 seconds and 12.5 seconds, respectively. Extended FOV angiogram was generated by using last abdomen-pelvis and thigh time frames and second calf-foot frame. Calf-foot MIP shows third time frame, which has excellent arterial contrast and detail. Calf vasculature has extensive disease and complex flow, including occlusion of both tibioperoneal trunks and filling of posterior tibial and peroneal arteries via communicating vessels. Study was scored substantially better than CT angiography because the first CT angiographic sequence progressed ahead of the bolus and there was suboptimal contrast and anatomic coverage in second sequence. Also see Movie 2 (online).
Figure 5:

Extended FOV coronal MIP in a 47-year-old female patient (subject 11) with rapid contrast material bolus transit. When bolus reached distal abdominal aorta, only two additional time frames were acquired at abdomen-pelvis station, and only two time frames were acquired at thigh station. However, arterial-to-venous transit was slow at calf-foot station, thus venous contamination was not seen. MIP consists of final abdomen-pelvis and thigh station time frames and third calf-foot time frame. No preference was given for MR versus CT angiography because CT angiography allowed better visualization of left common iliac stent and left foot vasculature but also showed mild venous contamination near popliteal arteries. Also see Movie 3 (online).
Figure 3b:
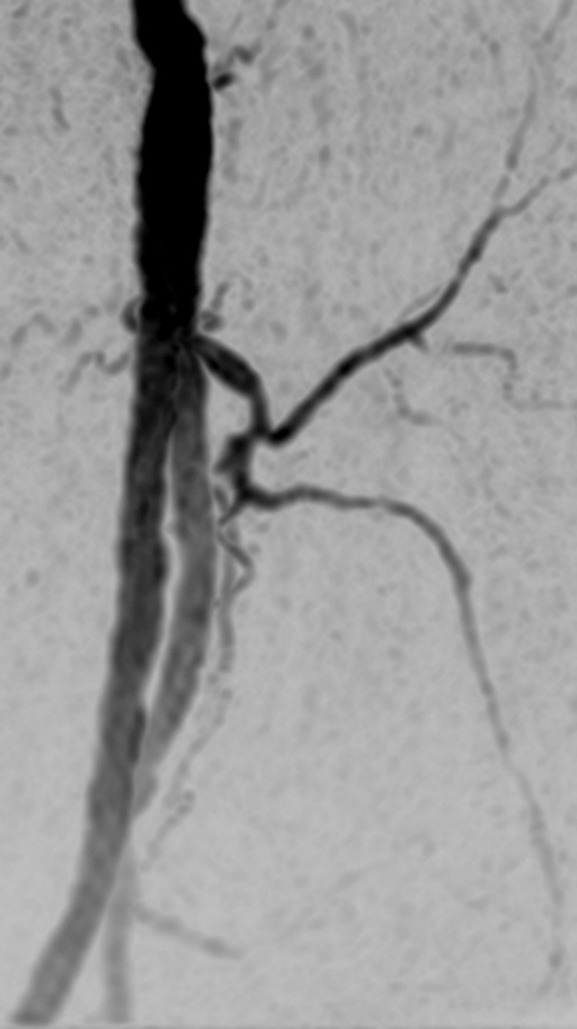
(a) Coronal MIP and sagittal MIP of left leg in a healthy 81-year-old male volunteer (subject 4) generated by using final abdomen-pelvis and thigh station time frames and third calf-foot time frame. Dwell time at thigh station was only 5.0 seconds. (b–d) Targeted coronal MIPs of the boxed regions in a highlight arterial detail. Although this subject was recruited as a healthy volunteer, multiple low-grade stenoses are seen in thigh and calf arteries, and anterior tibial arteries are partially occluded. Contrast material bolus was imaged at four abdomen-pelvis and two thigh station time frames, and venous contamination was avoided at calf-foot station. (Reprinted, with permission, from reference 17.) Also see Figure E1 (online) and Movie 1 (online).
Figure 3c:
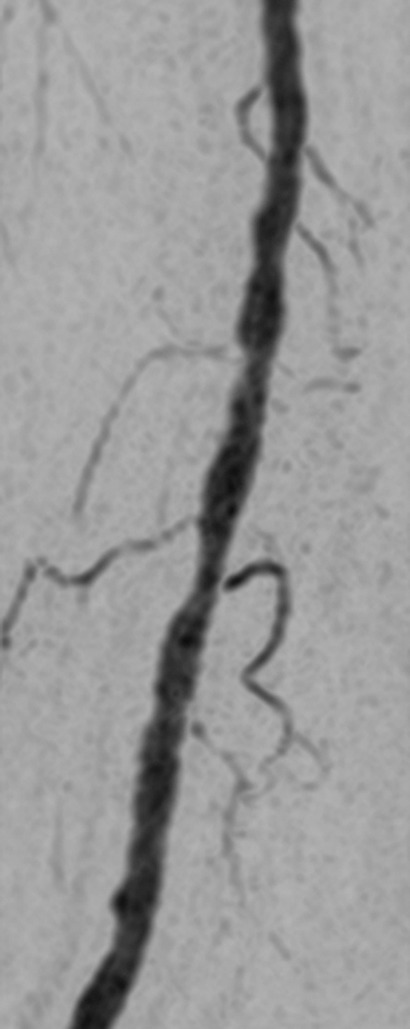
(a) Coronal MIP and sagittal MIP of left leg in a healthy 81-year-old male volunteer (subject 4) generated by using final abdomen-pelvis and thigh station time frames and third calf-foot time frame. Dwell time at thigh station was only 5.0 seconds. (b–d) Targeted coronal MIPs of the boxed regions in a highlight arterial detail. Although this subject was recruited as a healthy volunteer, multiple low-grade stenoses are seen in thigh and calf arteries, and anterior tibial arteries are partially occluded. Contrast material bolus was imaged at four abdomen-pelvis and two thigh station time frames, and venous contamination was avoided at calf-foot station. (Reprinted, with permission, from reference 17.) Also see Figure E1 (online) and Movie 1 (online).
Figure 3d:
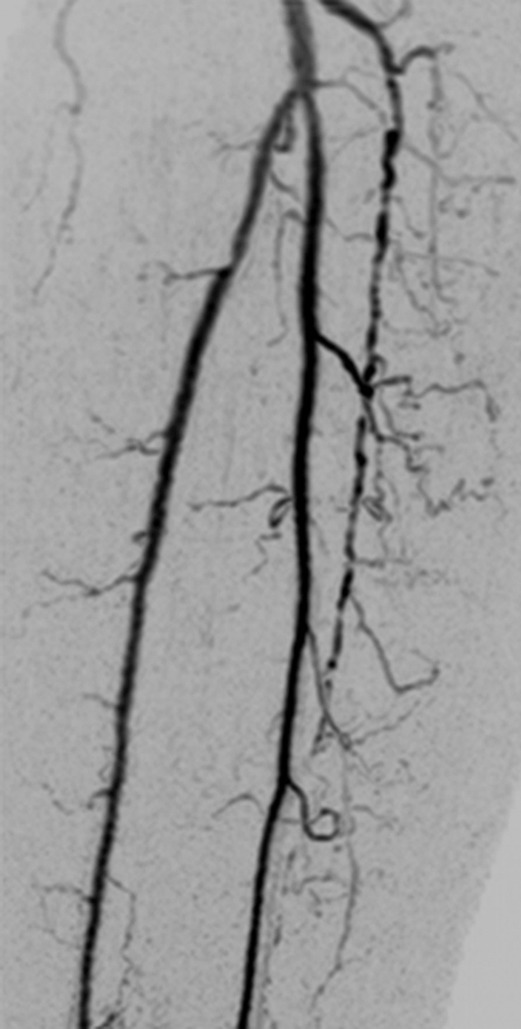
(a) Coronal MIP and sagittal MIP of left leg in a healthy 81-year-old male volunteer (subject 4) generated by using final abdomen-pelvis and thigh station time frames and third calf-foot time frame. Dwell time at thigh station was only 5.0 seconds. (b–d) Targeted coronal MIPs of the boxed regions in a highlight arterial detail. Although this subject was recruited as a healthy volunteer, multiple low-grade stenoses are seen in thigh and calf arteries, and anterior tibial arteries are partially occluded. Contrast material bolus was imaged at four abdomen-pelvis and two thigh station time frames, and venous contamination was avoided at calf-foot station. (Reprinted, with permission, from reference 17.) Also see Figure E1 (online) and Movie 1 (online).
Figure 4b:
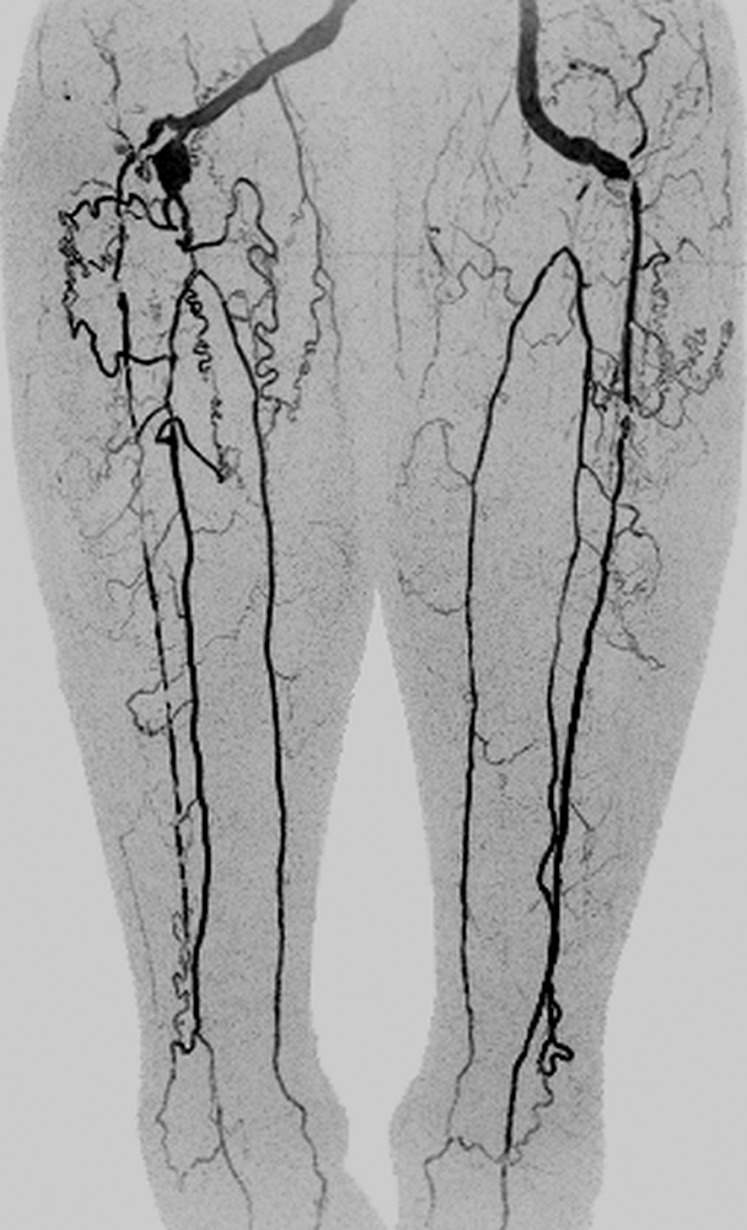
Coronal MIPs of the (a) extended FOV and (b) calf-foot station in an 81-year-old male patient (subject 10) with slow contrast material bolus progression. Transit times at abdomen-pelvis and thigh proximal stations were 10.0 seconds and 12.5 seconds, respectively. Extended FOV angiogram was generated by using last abdomen-pelvis and thigh time frames and second calf-foot frame. Calf-foot MIP shows third time frame, which has excellent arterial contrast and detail. Calf vasculature has extensive disease and complex flow, including occlusion of both tibioperoneal trunks and filling of posterior tibial and peroneal arteries via communicating vessels. Study was scored substantially better than CT angiography because the first CT angiographic sequence progressed ahead of the bolus and there was suboptimal contrast and anatomic coverage in second sequence. Also see Movie 2 (online).
Discussion
Fluoroscopic tracking enabled high-spatial-resolution imaging from the aortoiliac bifurcation to the pedal arteries and flexibly accommodated a broad range of subject hemodynamics. The acquired spatiotemporal resolution at the proximal stations (1.5-mm isotropic and < 7-second temporal footprint) is competitive with, if not superior to, current nontime-resolved bolus-chase MR angiographic protocols, which use voxel volumes of 3.8–6.6 mm3 (1.6–1.9 mm isotropic) and station dwell times of 8–20 seconds at the proximal stations (5,18–21). The method was technically successful in all studies in that the contrast material bolus was consistently tracked effectively and efficiently. Arterial segments were typically scored as being of good quality, and in those cases in which they occurred, artifacts and venous contamination generally did not interfere with diagnosis. However, one of the studies was severely compromised because of patient motion. Fluoroscopic tracking showed promise compared with CT angiography. Favorable scoring was seen where disease was present, with MR angiography typically being advantageous for more distal disease and CT angiography being advantageous for proximal disease and where stents were located. The advantage of MR angiography for distal disease is consistent with results of previous work (22), in which authors directly compared contrast-enhanced MR angiography and CT angiography in imaging of the calves. Motion and acceleration artifacts at the abdomen-pelvis station and venous contamination at the calf-foot station in cases of rapid arterial-to-venous transit are the prime issues that should be addressed next.
The principal advantage of fluoroscopic tracking is its ability not only to show the progress of the contrast material bolus but also to provide simultaneously efficient imaging at each station. If the contrast material bolus is moving quickly, then the fluoroscopic tracking sequence can allow movement of the table in as little as 5.0 seconds on arrival of the contrast material bolus to the station FOV while still creating high image quality. As an alternative, if the contrast material bolus is moving slowly, then the technique can continue to improve image quality with a more extended imaging duration and provide multiple time frames at that station. Thus, the technique provides an efficient tradeoff of image quality and station dwell time. A second advantage is that only a single injection of contrast material is used, obviating the timing bolus or hybrid technique. This saves time, simplifies the imaging protocol, and reduces opportunities for timing errors. A third advantage is that the use of high image acceleration (Rnet >14 at all imaging stations) enables higher nominal spatial resolution and shorter station dwell times than are typical of most bolus-chase MR angiographic protocols. Despite the accompanying intrinsic reduction in signal-to-noise ratio due to high acceleration factors, good image quality was still achieved, as shown in the fine detail of the angiograms and the good assessment scores for both vessel signal intensity and sharpness. We attribute this to the high performance of the circumferentially placed coil arrays (23) at each station and the intrinsic signal-to-noise ratio retention when acceleration is applied to contrast-enhanced MR angiography (24,25).
The fluoroscopic tracking method potentially can be improved in several ways. First, additional techniques for better retention of signal-to-noise ratio at the high two-dimensional acceleration factors could be incorporated, including controlled aliasing in parallel imaging results in higher acceleration (26), compressive sensing (27,28), acceleration apportionment (29), and vascular masking (30). Second, although the technique generally provided good venous suppression at the most distal station, this would be improved by reduction of the 5.0-second move time from one station to the next by eliminating software-related overhead and playing out dummy repetitions while the table moves. It also may be possible to acquire data while the table moves (31,32). As an alternative, in patients who are expected to have rapid arterial-to-venous transit, a targeted time-resolved acquisition at the calf-foot station before or after the bolus-chase runoff could be performed, as is done with hybrid MR angiography. Third, motion-related artifacts potentially can be addressed by using a two-point Dixon technique for MR angiography without subtraction (33). Another option is to use a blood pool contrast agent, which would enable a quick, steady-state acquisition at the abdomen-pelvis station after the first-pass sequence, if needed (34). Last, contrast material dose potentially can be further reduced. Good time-resolved MR angiographic images of the calves have been shown with doses of only 0.03 mmol/kg (8). In addition, given that the station dwell times were short (typically < 10 seconds), the fluoroscopic technique does not use much of the time when the contrast material bolus is present, and a shorter, more compact bolus could prove advantageous.
The main limitation of this preliminary study was the number of clinical examinations performed. Although the patient population was diverse in terms of disease manifestations and hemodynamics, more studies are needed to evaluate the effectiveness of fluoroscopic tracking-based MR angiography versus CT angiography and other MR angiography methods. In particular, the study had marginal statistical power to determine if the MR and CT angiographic results were significantly different. Other limitations included individual variation in contrast material dose, inherent bias in the pairwise evaluation of the MR and CT angiographic studies, and lack of a comparison to a standard clinical MR angiographic or digital subtraction angiographic protocol.
In conclusion, three-station bolus-chase MR angiography with fluoroscopic tracking provides high-spatial-resolution arteriograms along the extent of the peripheral vasculature, enables patient-specific triggering of table motion, and is a promising alternative to contemporary MR and CT angiographic methods.
Advances in Knowledge
■ A dynamic three-station bolus-chase MR angiographic method enables high spatial and temporal resolution imaging of the peripheral arteries while limiting the use of contrast material to a single injection.
■ Fluoroscopic tracking, a method for real-time triggering of table advance, is applied at both proximal stations and effectively eliminates the need for a timing bolus.
Implications for Patient Care
■ The technique provides high spatial and temporal resolution imaging of the peripheral arteries throughout an extended field of view.
■ The fluoroscopic tracking protocol potentially can reduce total examination time and contrast material dose.
SUPPLEMENTAL FIGURES
MOVIES
Acknowledgments
Acknowledgments
The authors thank Kathy J. Brown and Diane M. Sauter for their contributions.
Received July 9, 2013; revision requested September 13; revision received October 25; accepted November 26; final version accepted December 13.
Funding: This research was supported by the National Institutes of Health (grants EB000212, HL070620, and RR018898).
Disclosures of Conflicts of Interest: C.P.J. Financial activities related to the present article: none to disclose. Financial activities not related to the present article: royalties from GE Healthcare. Other relationships: none to disclose. P.T.W. Financial activities related to the present article: none to disclose. Financial activities not related to the present article: royalties and patents from GE Healthcare. Other relationships: none to disclose. E.A.B. No relevant conflicts of interest to disclose. R.C.G. No relevant conflicts of interest to disclose. T.C.H. No relevant conflicts of interest to disclose. C.C.L. No relevant conflicts of interest to disclose. P.J.R. Financial activities related to the present article: none to disclose. Financial activities not related to the present article: patents from GEHC and Toshiba MS. Other relationships: none to disclose. J.F.G. No relevant conflicts of interest to disclose. P.M.Y. No relevant conflicts of interest to disclose. S.J.R. Financial activities related to the present article: none to disclose. Financial activities not related to the present article: patents from GE Healthcare and Toshiba. Other relationships: none to disclose.
Abbreviations:
- CAPR
- Cartesian acquisition with projection-reconstruction–like sampling
- FOV
- field of view
- MIP
- maximum intensity projection
- 3D
- three-dimensional
References
- 1.Ho KY, Leiner T, de Haan MW, Kessels AG, Kitslaar PJ, van Engelshoven JM. Peripheral vascular tree stenoses: evaluation with moving-bed infusion-tracking MR angiography. Radiology 1998;206(3):683–692. [DOI] [PubMed] [Google Scholar]
- 2.Meaney JF, Ridgway JP, Chakraverty S, et al. Stepping-table gadolinium-enhanced digital subtraction MR angiography of the aorta and lower extremity arteries: preliminary experience. Radiology 1999;211(1):59–67. [DOI] [PubMed] [Google Scholar]
- 3.Leiner T, Ho KY, Nelemans PJ, de Haan MW, van Engelshoven JM. Three-dimensional contrast-enhanced moving-bed infusion-tracking (MoBI-track) peripheral MR angiography with flexible choice of imaging parameters for each field of view. J Magn Reson Imaging 2000;11(4):368–377. [DOI] [PubMed] [Google Scholar]
- 4.de Vries M, Nijenhuis RJ, Hoogeveen RM, de Haan MW, van Engelshoven JM, Leiner T. Contrast-enhanced peripheral MR angiography using SENSE in multiple stations: feasibility study. J Magn Reson Imaging 2005;21(1):37–45. [DOI] [PubMed] [Google Scholar]
- 5.Maki JH, Wang M, Wilson GJ, Shutske MG, Leiner T. Highly accelerated first-pass contrast-enhanced magnetic resonance angiography of the peripheral vasculature: comparison of gadofosveset trisodium with gadopentetate dimeglumine contrast agents. J Magn Reson Imaging 2009;30(5):1085–1092. [DOI] [PubMed] [Google Scholar]
- 6.Potthast S, Wilson GJ, Wang MS, Maki JH. Peripheral moving-table contrast-enhanced magnetic resonance angiography (CE-MRA) using a prototype 18-channel peripheral vascular coil and scanning parameters optimized to the patient’s individual hemodynamics. J Magn Reson Imaging 2009;29(5):1106–1115. [DOI] [PubMed] [Google Scholar]
- 7.Berg F, Bangard C, Bovenschulte H, et al. Hybrid contrast-enhanced MR angiography of pelvic and lower extremity vasculature at 3.0 T: initial experience. Eur J Radiol 2009;70(1):170–176. [DOI] [PubMed] [Google Scholar]
- 8.Attenberger UI, Haneder S, Morelli JN, Diehl SJ, Schoenberg SO, Michaely HJ. Peripheral arterial occlusive disease: evaluation of a high spatial and temporal resolution 3-T MR protocol with a low total dose of gadolinium versus conventional angiography. Radiology 2010;257(3):879–887. [DOI] [PubMed] [Google Scholar]
- 9.Ouwendijk R, de Vries M, Pattynama PM, et al. Imaging peripheral arterial disease: a randomized controlled trial comparing contrast-enhanced MR angiography and multi-detector row CT angiography. Radiology 2005;236(3):1094–1103. [DOI] [PubMed] [Google Scholar]
- 10.Berg F, Bangard C, Bovenschulte H, et al. Feasibility of peripheral contrast-enhanced magnetic resonance angiography at 3.0 Tesla with a hybrid technique: comparison with digital subtraction angiography. Invest Radiol 2008;43(9):642–649. [DOI] [PubMed] [Google Scholar]
- 11.Burbelko M, Augsten M, Kalinowski MO, Heverhagen JT. Comparison of contrast-enhanced multi-station MR angiography and digital subtraction angiography of the lower extremity arterial disease. J Magn Reson Imaging 2013;37(6):1427–1435. [DOI] [PubMed] [Google Scholar]
- 12.Johnson CP, Haider CR, Borisch EA, Glockner JF, Riederer SJ. Time-resolved bolus-chase MR angiography with real-time triggering of table motion. Magn Reson Med 2010;64(3):629–637. [DOI] [PMC free article] [PubMed] [Google Scholar]
- 13.Johnson CP, Borisch EA, Glockner JF, Young PM, Riederer SJ. Time-resolved dual-station calf-foot three-dimensional bolus chase MR angiography with fluoroscopic tracking. J Magn Reson Imaging 2012;36(5):1168–1178. [DOI] [PMC free article] [PubMed] [Google Scholar]
- 14.Johnson CP, Polley TW, Glockner JF, Young PM, Riederer SJ. Buildup of image quality in view-shared time-resolved 3D CE-MRA. Magn Reson Med 2013;70(2):348–357. [DOI] [PMC free article] [PubMed] [Google Scholar]
- 15.Haider CR, Hu HH, Campeau NG, Huston J, 3rd, Riederer SJ. 3D high temporal and spatial resolution contrast-enhanced MR angiography of the whole brain. Magn Reson Med 2008;60(3):749–760. [DOI] [PMC free article] [PubMed] [Google Scholar]
- 16.Weiger M, Pruessmann KP, Boesiger P. 2D SENSE for faster 3D MRI. MAGMA 2002;14(1):10–19. [DOI] [PubMed] [Google Scholar]
- 17.Johnson CP, Borisch EA, Rossman PJ, et al. Three-station time-resolved 3D bolus chase MRA with a single injection of contrast material [abstr]. In: Proceedings of the Twentieth Meeting of the International Society for Magnetic Resonance in Medicine. Berkeley, Calif: International Society for Magnetic Resonance in Medicine, 2012; 524. [Google Scholar]
- 18.Maki JH, Wilson GJ, Eubank WB, Hoogeveen RM. Utilizing SENSE to achieve lower station sub-millimeter isotropic resolution and minimal venous enhancement in peripheral MR angiography. J Magn Reson Imaging 2002;15(4):484–491. [DOI] [PubMed] [Google Scholar]
- 19.Leiner T, Nijenhuis RJ, Maki JH, Lemaire E, Hoogeveen R, van Engelshoven JM. Use of a three-station phased array coil to improve peripheral contrast-enhanced magnetic resonance angiography. J Magn Reson Imaging 2004;20(3):417–425. [DOI] [PubMed] [Google Scholar]
- 20.Hadizadeh DR, Gieseke J, Lohmaier SH, et al. Peripheral MR angiography with blood pool contrast agent: prospective intraindividual comparative study of high-spatial-resolution steady-state MR angiography versus standard-resolution first-pass MR angiography and DSA. Radiology 2008;249(2):701–711. [DOI] [PubMed] [Google Scholar]
- 21.Nielsen YW, Eiberg JP, Løgager VB, Just S, Schroeder TV, Thomsen HS. Whole-body magnetic resonance angiography with additional steady-state acquisition of the infragenicular arteries in patients with peripheral arterial disease. Cardiovasc Intervent Radiol 2010;33(3):484–491. [DOI] [PubMed] [Google Scholar]
- 22.Young PM, Mostardi PM, Glockner JF, et al. Prospective comparison of cartesian acquisition with projection-like reconstruction magnetic resonance angiography with computed tomography angiography for evaluation of below-the-knee runoff. J Vasc Interv Radiol 2013;24(3):392–399. [DOI] [PMC free article] [PubMed] [Google Scholar]
- 23.Haider CR, Glockner JF, Stanson AW, Riederer SJ. Peripheral vasculature: high-temporal- and high-spatial-resolution three-dimensional contrast-enhanced MR angiography. Radiology 2009;253(3):831–843. [DOI] [PMC free article] [PubMed] [Google Scholar]
- 24.Hu HH, Campeau NG, Huston J, 3rd, Kruger DG, Haider CR, Riederer SJ. High-spatial-resolution contrast-enhanced MR angiography of the intracranial venous system with fourfold accelerated two-dimensional sensitivity encoding. Radiology 2007;243(3):853–861. [DOI] [PMC free article] [PubMed] [Google Scholar]
- 25.Riederer SJ, Hu HH, Kruger DG, Haider CR, Campeau NG, Huston J, 3rd. Intrinsic signal amplification in the application of 2D SENSE parallel imaging to 3D contrast-enhanced elliptical centric MRA and MRV. Magn Reson Med 2007;58(5):855–864. [DOI] [PMC free article] [PubMed] [Google Scholar]
- 26.Breuer FA, Blaimer M, Mueller MF, et al. Controlled aliasing in volumetric parallel imaging (2D CAIPIRINHA). Magn Reson Med 2006;55(3):549–556. [DOI] [PubMed] [Google Scholar]
- 27.Lustig M, Donoho D, Pauly JM.Sparse MRI: The application of compressed sensing for rapid MR imaging. Magn Reson Med 2007;58(6):1182–1195. [DOI] [PubMed] [Google Scholar]
- 28.Trzasko JD, Haider CR, Borisch EA, et al. Sparse-CAPR: highly accelerated 4D CE-MRA with parallel imaging and nonconvex compressive sensing. Magn Reson Med 2011;66(4):1019–1032. [DOI] [PMC free article] [PubMed] [Google Scholar]
- 29.Weavers PT, Borisch EA, Johnson CP, Riederer SJ. Acceleration apportionment: A method of improved 2D SENSE acceleration applied to 3D contrast-enhanced MR angiography. Magn Reson Med 2014;71(2):672–680. [DOI] [PMC free article] [PubMed] [Google Scholar]
- 30.Stinson EG, Borisch EA, Johnson CP, Trzasko JD, Young PM, Riederer SJ. Vascular masking for improved unfolding in 2D SENSE-accelerated 3D contrast-enhanced MR angiography. J Magn Reson Imaging 2013. [DOI] [PMC free article] [PubMed] [Google Scholar]
- 31.Kruger DG, Riederer SJ, Grimm RC, Rossman PJ. Continuously moving table data acquisition method for long FOV contrast-enhanced MRA and whole-body MRI. Magn Reson Med 2002;47(2):224–231. [DOI] [PubMed] [Google Scholar]
- 32.Voth M, Haneder S, Huck K, Gutfleisch A, Schönberg SO, Michaely HJ. Peripheral magnetic resonance angiography with continuous table movement in combination with high spatial and temporal resolution time-resolved MRA With a total single dose (0.1 mmol/kg) of gadobutrol at 3.0 T. Invest Radiol 2009;44(9):627–633. [DOI] [PubMed] [Google Scholar]
- 33.Leiner T, Habets J, Versluis B, et al. Subtractionless first-pass single contrast medium dose peripheral MR angiography using two-point Dixon fat suppression. Eur Radiol 2013;23(8):2228–2235. [DOI] [PubMed] [Google Scholar]
- 34.Nikolaou K, Kramer H, Grosse C, et al. High-spatial-resolution multistation MR angiography with parallel imaging and blood pool contrast agent: initial experience. Radiology 2006;241(3):861–872. [DOI] [PubMed] [Google Scholar]
Associated Data
This section collects any data citations, data availability statements, or supplementary materials included in this article.


