Abstract
The thermal conductivity of group-IV semiconductors (silicon, germanium, diamond and grey tin) with several isotopic compositions has been calculated from a kinetic-collective model. From this approach, significantly different to Callaway-like models in its physical interpretation, the thermal conductivity expression accounts for a transition from a kinetic (individual phonon transport) to a collective (hydrodynamic phonon transport) behaviour of the phonon field. Within the model, we confirm the theoretical proportionality between the phonon–phonon relaxation times of the group-IV semiconductors. This proportionality depends on some materials properties and it allows us to predict the thermal conductivity of the whole group of materials without the need to fit each material individually. The predictions on thermal conductivities are in good agreement with experimental data over a wide temperature range.
Keywords: heat transport, collective regime, semiconductors, thermal conductivity
1. Introduction
A general model able to predict the phonon contribution to thermal conductivity at all ranges of temperature for different materials and device sizes is still an open challenge, and it represents a central topic in current nanotechnology research, where the control of the thermal conductivity is relevant in problems related to thermoelectrical energy conversion or nanorefrigeration. The usual starting point for thermal conductivity modelling is the Boltzmann transport equation (BTE), but deriving a general predictive solution is a tremendous task that at the moment has not been completely achieved.
In order to deal with this, two different strategies are used to obtain some approximate solutions of the BTE: numerical [1–3] and phenomenological models [4–10]. An example of the numerical approach is to combine ab initio calculations for phonon relaxation times with a recursive method of solution for the BTE. This has led to valuable results for semiconductor bulk samples in the temperature range [50–400] K [11,12]. The goal of these works is to obtain thermal conductivity predictions without using any fitting parameters. The main problem for this kind of approach is the computational cost at low temperatures or in reduced size samples.
On the other hand, phenomenological approaches provide simplified expressions for the thermal conductivity based on applying a minimum set of simplifications to the BTE. Their main goal is not to predict accurately experimental values, but to obtain a reasonable approximation that allows us to interpret the results in terms of physical phenomena. One of the most well-known phenomenological models is the one proposed by Callaway [13] (CM), but in the last years some issues related to the prediction of reduced-size samples have led to explore some modifications [5,7,14]. In the work by de Tomas et al. [15] an alternative kinetic-collective model (KCM) is proposed, improving predictions for silicon thermal conductivity. The strong point of this new model is that two different regimes of phonon thermal transport are established depending on the dominance of non-resistive and resistive scattering, which are the collective and the kinetic regime, respectively.
Although CM and KCM seem similar, the more rigorous mathematical treatment of collisions in the second proposal makes it significantly more accurate in its predictions being a more suitable starting point to study phononic thermal transport in crystals. These mathematical differences have also important consequences on the phenomenological description of this transport phenomena. The model is not only a useful tool to predict thermal conductivity of different shape, size or isotopic composition samples but also gives insight into the physics underlying phonon–phonon interactions in thermal transport. The agreement with experimental data from bulk to nanoscale silicon samples in the whole range of temperatures is remarkable [15]. This good result for silicon has motivated us to check the robustness of the model by applying it to other materials than Si.
It is widely believed that the inclusion of adjustable parameters in a phenomenological model to fit individual samples shows the lack of predictive power of this kind of model. In order to demonstrate its correctness, prediction of samples different from that fitted by only changing calculable parameters is needed. One example of this is to predict isotopically rich samples from natural abundance samples by only changing the mass defect term from isotopic abundances [4,16,17]. Here, we want to go a step further in this kind of approach and aim to predict the thermal conductivity of a set of samples of several materials and isotopic abundances by fitting only one sample and calculating the rest. This global approach, and the large reduction in the fitting parameters, will stress the accuracy of KCM predictions. In order to focus only on the phonon relaxation times and dismiss the effects coming from the crystal structure, we have studied diamond-like crystals, specifically the family of group-IV semiconductors: diamond (C), silicon (Si), germanium (Ge) and grey tin (α-Sn).
The layout of this paper is as follows. In §2, the KCM is summarized. In §3, relaxation times are discussed and we present theoretical relations to calculate the parameters involved in phonon–phonon relaxation time expressions. In §4, we present the dispersion relations, density of states and specific heat of group-IV semiconductors. In §5, we show the thermal conductivity prediction of a set of nine samples of group-IV semiconductors with different isotopic compositions and we discuss the results.
2. Kinetic-collective model
According to de Tomas et al. [15], in the KCM the trade-off between non-resistive and resistive scattering events will determine the behaviour of the phonon collectivity. This leads to establish two limiting behaviour regimes: (i) the kinetic regime, when resistive scattering dominates over non-resistive scattering. In this regime, each phonon contributes independently to the heat flux, that is each phonon participating in thermal transport collides individually, without affecting the remaining phonons. Then, the thermal conductivity in this regime κkin is obtained as the usual kinetic equation
| 2.1 |
where the subindex α≡(j,ω) stands for the phonon branch index j and frequency ω, is the Planck constant, the equilibrium phonon distribution given by the Bose–Einstein distribution function, T the temperature, D(ωj) the density of states, vg,α group velocity and τR,α the total resistive relaxation time accounting for all the resistive scattering events obtained as indicated in §3. (ii) The collective regime, when non-resistive or normal scattering dominates over resistive scattering. In this regime, phonons behave as a collectivity, because the main role of normal scattering is redistributing the conserved momentum among all the phononic modes. Then, any collision (resistive or not) suffered by a phonon of the collectivity affects the remaining phonons. This way, the thermal conductivity in this regime κcoll is
| 2.2 |
where q is the phonon wavevector.
Finally, the total phonon thermal conductivity κ accounts for the transition from one limiting regime to the other, going through all possible intermediate regimes, and it is given by
| 2.3 |
where
| 2.4 |
is a switching factor weighting the relative importance between resistive and normal scattering. Σ takes values in the range [0,1] depending on the averages of normal 〈τN〉 and resistive 〈τR〉 relaxation times. The averaged relaxation times are calculated as
| 2.5 |
with the subindex i indicating resistive R or normal N relaxation time. Note that the denominator in equation (2.5) is in fact the total heat capacity. If resistive processes dominate over normal scattering 〈τN〉≫〈τR〉, then and . Otherwise, normal scattering dominates and 〈τR〉≫〈τN〉, then and . Note that in spite of the effect of the normal scattering, thermal conductivities κkin and κcoll include only resistive collisions through τR and normal scattering is included only in the switching factor Σ. Then, the main difference between κkin and κcoll does not lie in the used relaxation times but in the way they are averaged in each term.
In the collective term of equation (2.3), there is also a form factor F(Leff) depending on the effective size of the sample Leff. The form factor is required in the collective regime to account for surface effects and the geometry of the system due to hydrodynamics considerations and it is detailed in [15,18]. As shown in a previous work [15], when the phonon mean-free path is much larger than the effective length of the sample. If the size of the sample were small enough to give ℓ≫Leff, even when normal scattering is dominating the transport, the collective regime would be suppressed. However, this happens at small enough effective sizes, such as Leff<30 nm, where phonon confinement is expected to appear [15]. In that case, the model should be modified to account for such quantum effects. The special case of materials with quantized transverse direction, like graphene, can be considered as two-dimensional bulk systems with in-plane heat propagation, then Leff should not be calculated as the thickness of the film, but as the layer in-plane width.
Here, as we are dealing with bulk samples, only in the temperature interval where the boundary scattering dominates, we are therefore in the kinetic regime and this term does not mask the final thermal conductivity. Moreover, the geometry and shape of the material is considered in the model through the effective length Leff, as it is calculated through a geometric integral according to Zhang [19]. Results for cylindrical wires, square-section wires and thin-films are reported by de Tomas et al. [15].
3. Relaxation times
Phonon scattering mechanisms can be classified depending on its resistive or non-resistive nature. Resistive scatterings are those where momentum is not conserved during the collision, therefore they contribute to heat flux resistivity. There are three main resistive mechanisms as follows:
- (3) Phonon–phonon umklapp scattering (U-processes). The dependence of U-processes with frequency and temperature has been widely discussed [26–28]. Here, we keep the expression
tested on silicon in a previous work, where ΘD is the Debye temperature and ΘU is the umklapp extinction temperature calculated from the dispersion relations [15].3.3
Table 1.
Values of mass-fluctuation Γ, cross-section A and effective size Leff for natural occurring and isotopically enriched Si, Ge, C and α-Sn samples.
| sample | Γ | A (mm2) | Leff (mm) | reference |
|---|---|---|---|---|
| naSi | 20.01×10⁻⁵ | 2.00×3.12 | 2.8 | [21] |
| 28Si | 3.2×10⁻⁷ | 2.00×3.12 | 2.8 | [21] |
| naGe | 58.7×10⁻⁵ | 2.46×2.50 | 2.78 | [17] |
| 70/76Ge | 1.53×10⁻³ | 2.02×2.00 | 2.25 | [17] |
| 70Ge99.99 | 1.8×10⁻⁷ | 2.20×2.50 | 2.63 | [17] |
| 70Ge96.3 | 7.57×10⁻⁵ | 2.50×2.50 | 2.8 | [17] |
| naC | 7.54×10⁻⁵ | ∼1×1 | 0.82 | [22] |
| 13C | 6.94×10⁻⁶ | 1×2 | 1.58 | [23] |
| naSn | 33.46×10⁻⁵ | 2.5×2.5 | 2.8 | — |
The total resistive scattering rate is calculated through the Mathiessen rule
| 3.4 |
Regarding non-resistive or normal scattering processes (N-processes), they do not contribute to heat flux resistivity because momentum is conserved during the collision.
For N-processes, we also use
| 3.5 |
according to de Tomas et al. [15].
Expressions (3.3) and (3.5) agree to those provided by Ward & Broido [27] obtained by ab initio calculations in the temperature range 50–300 K where they compare to experimental data. Note that all the scattering rates depend on phonon mode, either directly through the frequency in (3.2), (3.3) and (3.5) or indirectly through the group velocity vg,α in (3.1) and (3.2), which has different values for each mode.
(a). Relations between phonon–phonon relaxation times expressions
The exact functional form of τU and τN (let us drop the subindex α here and onward for the sake of simplicity) is a matter of great discussion. However, it is known that relaxation times exhibit a behaviour , where the dependence on frequency and temperature relies on empirical values of the exponents a and b, and the presence of an adjustable parameter B is required. Generally, B parameters have appeared in the literature as fitting parameters forgetting the information they may hide. In an early work by Leibfried & Schlömann [29], a semiempiric expression to calculate BU and BN in terms of a material’s properties with the dependence on frequency and temperature appears for the first time. Later recovered by Morelli et al. [4], this expression is written for both parameters as
| 3.6 |
where KB is the Boltzmann constant, the Planck constant, γ the Grüneisen parameter and M the atomic mass, being a and b the exponents of frequency and temperature, respectively. This expression can be used to relate the parameters of different materials.
In our specific case for Umklapp scattering, we have from equation (3.3)
| 3.7 |
therefore a=4 and b=1 (fulfilling the condition a+b=5). Then, entering these exponents in equation (3.6), we have
| 3.8 |
Analogously, for normal scattering we have from equation (3.5): (i) at low temperatures
| 3.9 |
therefore a=2 and b=3 (fulfilling again the condition a+b=5). Then, entering these exponents in equation (3.6), we have
| 3.10 |
and (ii) at high temperatures, where the condition a+b=5 is no longer valid, since τN should follow a T−1 law [26], we have
| 3.11 |
therefore a=0 and b=1. Then, entering these exponents in equation (3.6), we have
| 3.12 |
Note that BU, BN and B′N are frequency and temperature independent (they depend on T only indirectly through the group velocity and the Grüneisen parameter), although they have dimensions of time and temperature. Moreover, their units and magnitudes are different since they belong to different scattering rate functional forms. As KB and are constants, we can drop them and express BU and BN depending only on material’s properties γ,vg,V and M, then they exhibit the same dependence on these properties and we can relate their values between different materials using the same conversion factor fx in equation (3.13).
Expression (3.6) allows to express the B parameters of our set of materials in terms of the values of one of them. We take Si as the reference material. First, we have to obtain the values BU,Si,BN,Si and B′N,Si that provide the best fit for naturally occurring Si (naSi). Then, we calculate the respective values for the other materials as BU/N,x=fxBU/N,Si and B′N,x=f′xB′N,Si, where x denotes the material, being
| 3.13 |
the conversion factors for the low- and high-temperature parameters, BU/N and B′N, respectively. Calculated values of fx and f′x are given in table 3 using the values γ,vg,V and M, which are characteristic of each material, appearing in table 2. The same mean value γ=0.7 can be used for all the group-IV materials considered here, as indicated by Ehrenreich et al. [30]. For vg, we calculate the mean value at the zone-centre of the Brillouin zone from dispersion relations using v=[2/3vT+1/3vL]−1, the obtained values are shown in table 2 and are in very good agreement with both experimental and other theoretical calculations [12], V and M are standard values in the literature.
Table 3.
Conversion factors fx and f′x calculated from equations (3.13) for each material.
| parameter | factor | α-Sn | Ge | Si | C |
|---|---|---|---|---|---|
| BU/N | fx | 24.01 | 4.60 | 1 | 0.013 |
| B′N | f′x | 0.45 | 0.59 | 1 | 1.158 |
Table 2.
Materials properties: Debye temperature ΘD, atomic mass M, atomic volume V , mean zone-centre velocity v and umklapp extinction temperature ΘU.
| material | ΘD (K) | M (g mol−1) | V (m3) | v (m s−1) | ΘU (K) |
|---|---|---|---|---|---|
| Si | 645 | 28.086 | 20.01×10⁻³⁰ | 6272 | 126 |
| Ge | 375 | 72.63 | 22.75×10⁻³⁰ | 3923 | 70 |
| C | 1850 | 12 | 5.67×10⁻³⁰ | 13 746 | 405 |
| α-Sn | 230 | 118.69 | 34.05×10⁻³⁰ | 2769 | 37 |
4. Group-IV semiconductors: dispersion relations and specific heat
The family of group-IV semiconductors consists on four elements with diamond-like crystal structure. This is, diamond (C), silicon (Si), germanium (Ge) and grey tin (α-Sn).
In order to predict their dispersion relations, we have used the Bond-charge Model (BCM), because it gives very accurate predictions for this kind of materials with a minimum set of parameters [31]. In figures 1a–4a, we show the obtained dispersion relations for each material and we compare them with data from neutron scattering experiments. It can be seen that the predictions give very good agreement with data. Particularly, transversal acoustic phonon branches close to the border of the Brillouin zone are very well reproduced. In figures 1b–4b, we show the corresponding density of states for each material. Another important characteristic of each material arising from dispersion relations is the Debye temperature ΘD. The higher phonon branches are in frequency, the higher ΘD is expected. It is worthy then to calculate the specific heat cv from the obtained dispersion relations for each material and check the arising values of ΘD. As the heat capacity is
| 4.1 |
the molar specific heat is then calculated from equation (4.1). Calculated molar specific heat for C, Si, Ge and α-Sn are shown in figure 5. In the plot, the Debye temperature for each material has been marked and the values are reported in figure 5 and in table 2. Note that the values are chosen to keep proportional between them and correspond to tabulated values in literature.
Figure 2.
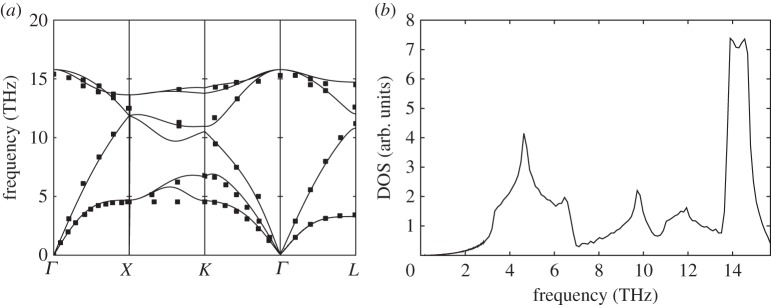
Phonon dispersion relations and density of sates for silicon (Si). (a) Solid lines: theoretical dispersion relations obtained with the BCM, where the x-axis indicates q values along the high-symmetry directions of the Brillouin zone. Symbols: data from neutron scattering experiments [33]. (b) Density of states calculated from BCM dispersion relations.
Figure 3.
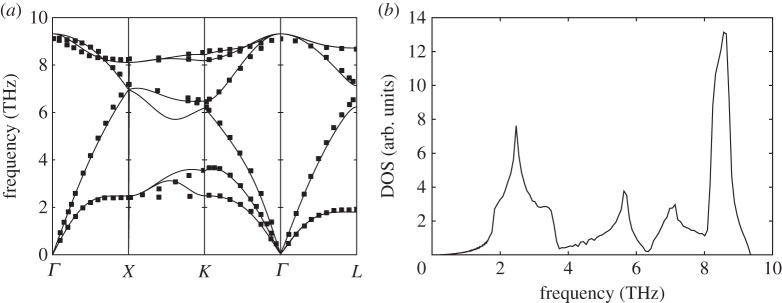
Phonon dispersion relations and density of sates for germanium (Ge). (a) Solid lines: theoretical dispersion relations obtained with the BCM, where the x-axis indicates q values along the high-symmetry directions of the Brillouin zone. Symbols: data from neutron scattering experiments [33]. (b) Density of states calculated from BCM dispersion relations.
Figure 1.
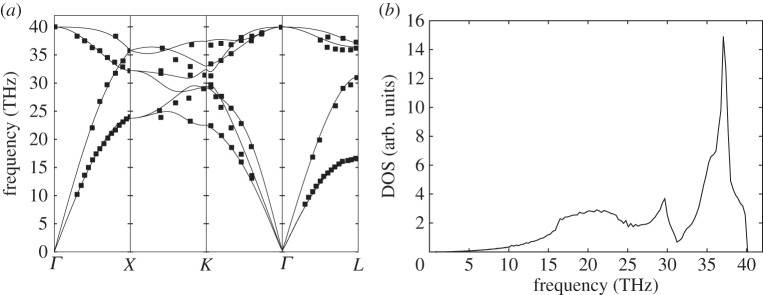
Phonon dispersion relations and density of sates for diamond (C). (a) Solid lines: theoretical dispersion relations obtained with the BCM, where the x-axis indicates q values along the high-symmetry directions of the Brillouin zone. Symbols: data from neutron scattering experiments [32]. (b) Density of states calculated from BCM dispersion relations.
Figure 4.
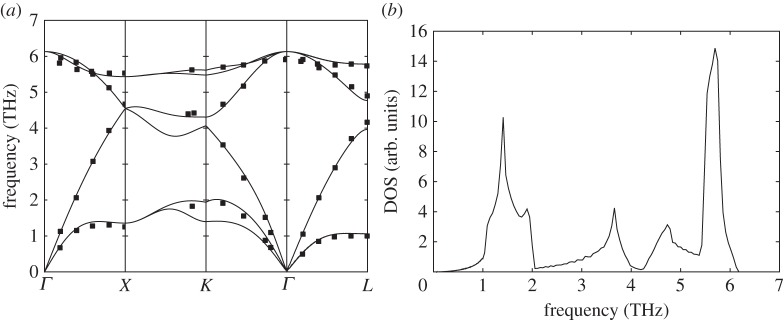
Phonon dispersion relations and density of sates for grey tin (α-Sn). (a) Solid lines: theoretical dispersion relations obtained with the BCM, where the x-axis indicates q values along the high-symmetry directions of the Brillouin zone. Symbols: data from neutron scattering experiments [34]. (b) Density of states calculated from BCM dispersion relations.
Figure 5.
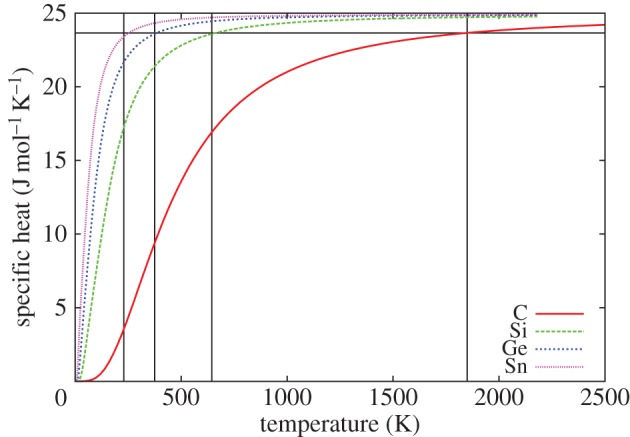
Temperature dependence of the specific heat Cv of group-IV semiconductors. Debye temperature ΘD can be read from the grid for each material (1850 K for C, 645 K for Si, 375 K for Ge and 230 K for α-Sn). (Online version in colour.)
5. Thermal conductivity calculations
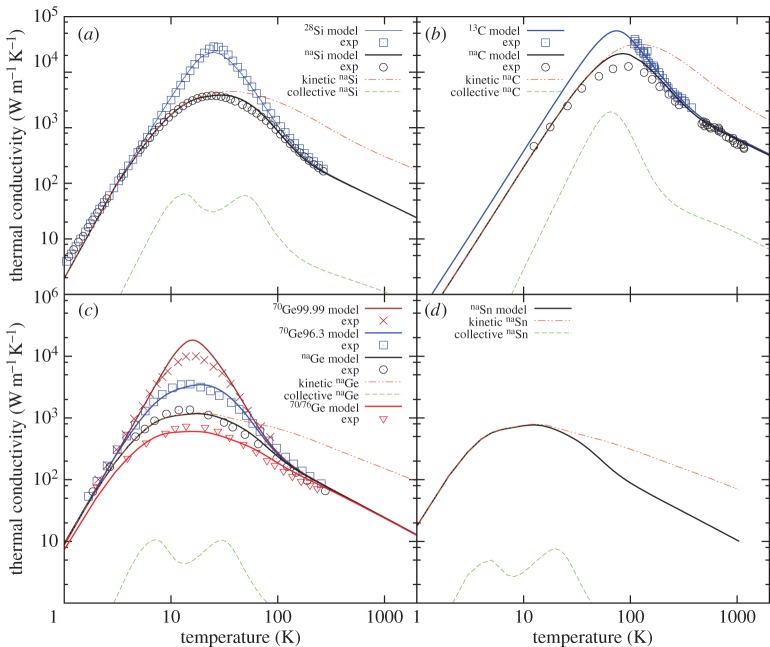
We have first calculated the thermal conductivity of naSi using equation (2.3) using the relaxation times given in §3 and the full dispersion relations computed in §4. The values of the normal and Umklapp relaxation times parameters providing the best fit to naSi experimental data are , and . The resulting κ is shown in figure 6a together with measurements from Inyushkin et al. [21]. Secondly, we have calculated κ for the other naturally occurring samples using the conversion factors given in table 3 to calculate the B parameters as explained in §3a. The obtained κ for naC, naGe and naSn is shown in figure 6b–d, respectively, and compared with experimental data from Asen-Palmer et al. [17] for germanium and from Onn et al. [22] for diamond. Thermal conductivity prediction for naturally occurring α-Sn awaits experimental evidence.
Figure 6.
Thermal conductivity of the set of group-IV semiconductors. The fit for naSi (solid line) is shown in (a). Predictions (solid lines) are shown for 28Si in (a), for diamond samples in (b), Ge samples in (c) and α-Sn in (d). The kinetic (dashed-dotted lines) and collective (dashed lines) contributions are plotted for each natural occurring samples. Experimental data from [21] for Si, from [17] for Ge and from [22,23] for C appear in symbols. (Online version in colour.)
Finally, the isotopic effect on thermal conductivity is also considered. The thermal conductivity of isotopically enriched samples (13C, 28Si, 70/76Ge, 70Ge99.99 and 70Ge96.3) is calculated in each case by only changing the value of Γ and Leff for the corresponding ones reported in table 1. The predictions are shown in figure 6a–c and compared with experimental data from [17,21,23].
These results are better than expected, as it is known that some of the materials properties (like V or γ) may depend on T. This may lead to consider that our phenomenological expressions are only valid to obtain general trends in the behaviour of κ. However, the agreement between our theory and the experiments is remarkably good. Note that we have not considered the effect of dislocations in 70Ge99.99 and unknown impurities in naC reported by their authors in each case. These are the only samples where the predictions slightly differ from experiments in the temperature region where κ exhibits the peak and these effects are expecting to affect the peak.
Also plotted in figure 6 are the kinetic and the collective limit for natural occurring samples (naSi, naC, naGe and naSn). From them, it can be seen that as T rises, κ makes a transition from a purely kinetic to a collective behaviour. At low temperatures, resistive boundary scattering is dominant and consequently thermal transport is kinetic. As temperature increases, normal scattering is starting to be important and the collective behaviour appears making the total thermal conductivity separate from a pure kinetic regime. The importance of the collective contribution is the same for all the samples. The only difference between them is the temperature at which this behaviour begins to be experienced. The insufficient attention to this transition in usual theoretical models may be the cause for the difficulties in trying to obtain the same predictions by using the CM. Although CM and KCM give the same results in the limits Σ=1 or Σ=0 [15], the transition happening in the KCM provides significantly different results.
From these results, it can be deduced that usual relaxation times expressions are good enough to calculate thermal conductivity, and that some of the issues when fitting experimental values could be related to the phenomenological model.
6. Concluding remarks
In conclusion, we have shown that using a KCM, the thermal conductivity can be predicted for a group of samples of several materials without additional fitting parameters. The model allows to interpret the behaviour of the thermal conductivity as a transition from a kinetic to a collective regime. The transition happens as normal scattering gains importance versus resistive scatterings. The results can shed light to the understanding of the phonon–phonon interaction in this kind of samples.
Acknowledgements
The authors thank Prof. D. Jou for a critical reading of the manuscript. Thanks are also given to the Red Española de Supercomputación providing access to the supercomputer TIRANT.
Funding statement
The authors acknowledge financial support from projects CSD2010-00044, FIS2012-32099, MAT2012-33483 and 2009-SGR00164, and from a Marie Curie Reintegration grant.
References
- 1.Esfarjani K, Chen G, Stokes HT. 2011. Heat transport in silicon from first-principles calculations. Phys. Rev. B 84, 085204 (doi:10.1103/PhysRevB.84.085204) [Google Scholar]
- 2.Fugallo G, Lazzeri M, Paulatto L, Mauri F. 2013. Ab initio variational approach for evaluating lattice thermal conductivity. Phys. Revi. B 88, 045430 (doi:10.1103/PhysRevB.88.045430) [Google Scholar]
- 3.Li W, Mingo N. 2013. Thermal conductivity of bulk and nanowire InAs, AlN, and BeO polymorphs from first principles. J. Appl. Phys. 114, 183505 (doi:10.1063/1.4827419) [Google Scholar]
- 4.Morelli D, Heremans J, Slack G. 2002. Estimation of the isotope effect on the lattice thermal conductivity of group IV and group III-V semiconductors. Phys. Rev. B 66, 195304 (doi:10.1103/PhysRevB.66.195304) [Google Scholar]
- 5.Mingo N. 2003. Calculation of Si nanowire thermal conductivity using complete phonon dispersion relations. Phys. Rev. B 68, 113308 (doi:10.1103/PhysRevB.68.113308) [Google Scholar]
- 6.Chantrenne P, Barrat JL, Blase X, Gale JD. 2005. An analytical model for the thermal conductivity of silicon nanostructures. J. Appl. Phys. 97, 104318 (doi:10.1063/1.1898437) [Google Scholar]
- 7.Allen PB. 2013. Improved Callaway model for lattice thermal conductivity. Phys. Rev. B 88, 144302 (doi:10.1103/PhysRevB.88.144302) [Google Scholar]
- 8.Alvarez FX, Alvarez-Quintana J, Jou D, Viejo JR. 2010. Analytical expression for thermal conductivity of superlattices. J. Appl. Phys. 107, 084303 (doi:10.1063/1.3386464) [Google Scholar]
- 9.Krumhansl JA. 1965. Thermal conductivity of insulating crystals in the presence of normal processes. Proc. Phys. Soc. 85, 921–930 (doi:10.1088/0370-1328/85/5/310) [Google Scholar]
- 10.Guyer R, Krumhansl J. 1966. Thermal conductivity, second sound, and phonon hydrodynamic phenomena in nonmetallic crystals. Phys. Rev. 148, 778–788 (doi:10.1103/PhysRev.148.778) [Google Scholar]
- 11.Broido DA, Malorny M, Birner G, Mingo N, Stewart DA. 2007. Intrinsic lattice thermal conductivity of semiconductors from first principles. Appl. Phys. Lett. 91, 231922 (doi:10.1063/1.2822891) [Google Scholar]
- 12.Ward A, Broido D, Stewart D, Deinzer G. 2009. Ab initio theory of the lattice thermal conductivity in diamond. Phys. Rev. B 80, 125203 (doi:10.1103/PhysRevB.80.125203) [Google Scholar]
- 13.Callaway J. 1959. Model for lattice thermal conductivity at low temperatures. Phys. Rev. 113, 1046–1051 (doi:10.1103/PhysRev.113.1046) [Google Scholar]
- 14.Kazan M, Guisbiers G, Pereira S, Correia MR, Masri P, Bruyant A, Volz S, Royer P. 2010. Thermal conductivity of silicon bulk and nanowires: effects of isotopic composition, phonon confinement, and surface roughness. J. Appl. Phys. 107, 83503 (doi:10.1063/1.3340973) [Google Scholar]
- 15.de Tomas C, Cantarero A, Lopeandia AF, Alvarez FX. 2014. From kinetic to collective behavior in thermal transport on semiconductors and semiconductor nanostructures. J. Appl. Phys. 115, 164314 (doi:10.1063/1.4871672) [Google Scholar]
- 16.Barman S, Srivastava G. 2007. Temperature dependence of the thermal conductivity of different forms of diamond. J. Appl. Phys. 101, 123507 (doi:10.1063/1.2747540) [Google Scholar]
- 17.Asen-Palmer M, Bartkowski K, Gmelin E, Cardona M, Zhernov A, Inyushkin A, Taldenkov A, Ozhogin V, Itoh K, Haller E. 1997. Thermal conductivity of germanium crystals with different isotopic compositions. Phys. Rev. B 56, 9431–9447 (doi:10.1103/PhysRevB.56.9431) [Google Scholar]
- 18.Jou D, Sellitto A, Alvarez FX. 2011. Heat waves and phonon–wall collisions in nanowires. Proc. R. Soc. A 467, 2520–2533 (doi:10.1098/rspa.2010.0645) [Google Scholar]
- 19.Zhang Z. 2007. Nano/microscale heat transfer. New York, NY: McGraw Hill Professional [Google Scholar]
- 20.Casimir H. 1938. Note on the conduction of heat in crystals. Physica 5, 495–500 (doi:10.1016/S0031-8914(38)80162-2) [Google Scholar]
- 21.Inyushkin AV, Taldenkov AN, Gibin AM, Gusev AV, Pohl H-J. 2004. On the isotope effect in thermal conductivity of silicon. Phys. Status Solidi (c) 1, 2995–2998 (doi:10.1002/pssc.200405341) [Google Scholar]
- 22.Onn D, Witek A, Qiu Y, Anthony T, Banholzer W. 1992. Some aspects of the thermal conductivity of isotopically enriched diamond single crystals. Phys. Rev. Lett. 68, 2806–2809 (doi:10.1103/PhysRevLett.68.2806) [DOI] [PubMed] [Google Scholar]
- 23.Wei L, Kuo P, Thomas R, Anthony T, Banholzer W. 1993. Thermal conductivity of isotopically modified single crystal diamond. Phys. Rev. Lett. 70, 3764–3767 (doi:10.1103/PhysRevLett.70.3764) [DOI] [PubMed] [Google Scholar]
- 24.Klemens PG. 1955. The scattering of low-frequency lattice waves by static imperfections. Proc. Phys. Soc. A 68, 1113–1128 (doi:10.1088/0370-1298/68/12/303) [Google Scholar]
- 25.Tamura S-i. 1983. Isotope scattering of dispersive phonons in Ge. Phys. Rev. B 27, 858–866 (doi:10.1103/PhysRevB.27.858) [Google Scholar]
- 26.Herring C. 1954. Role of low-energy phonons in thermal conduction. Phys. Rev. 95, 954–965 (doi:10.1103/PhysRev.95.954) [Google Scholar]
- 27.Ward A, Broido DA. 2010. Intrinsic phonon relaxation times from first-principles studies of the thermal conductivities of Si and Ge. Phys. Rev. B 81, 085205 (doi:10.1103/PhysRevB.81.085205) [Google Scholar]
- 28.Slack G, Galginaitis S. 1964. Thermal conductivity and phonon scattering by magnetic impurities in CdTe. Phys. Rev. 133, 253 (doi:10.1103/PhysRev.133.A253) [Google Scholar]
- 29.Leibfried G, Schlömann E. 1954. Heat conduction in electrically insulating crystals. Nach. Akad. Wiss. Gottingen. Math. Phys. Klasse. 2a 71, 71–93 [Google Scholar]
- 30.Ehrenreich H, Seitz F, Turnbull D, Slack GA. 1979. The thermal conductivity of nonmetallic crystals. Solid State Phys. 34, 1–71 (doi:10.1016/S0081-1947(08)60359-8) [Google Scholar]
- 31.Weber W. 1974. New Bond-Charge Model for the lattice dynamics of diamond-type semiconductors. Phys. Rev. Lett. 33, 371–374 (doi:10.1103/PhysRevLett.33.371) [Google Scholar]
- 32.Warren J, Yarnell J, Dolling G, Cowley R. 1967. Lattice dynamics of diamond. Phys. Rev. 158, 805–808 (doi:10.1103/PhysRev.158.805) [Google Scholar]
- 33.Nilsson G, Nelin G. 1972. Study of the homology between silicon and germanium by thermal-neutron spectrometry. Phys. Rev. B 6, 3777–3786 (doi:10.1103/PhysRevB.6.3777) [Google Scholar]
- 34.Price D, Rowe J, Nicklow R. 1971. Lattice dynamics of grey tin and indium antimonide. Phys. Rev. B 3, 1268–1279 (doi:10.1103/PhysRevB.3.1268) [Google Scholar]


