

Abstract
Background
Omega-6 (n6) polyunsaturated fatty acids (PUFAs) and their metabolites are involved in cell signaling, inflammation, clot formation, and other crucial biological processes. Genetic components, such as variants of fatty acid desaturase (FADS) genes, determine the composition of n6 PUFAs.
Methods and Results
To elucidate undiscovered biologic pathways that may influence n6 PUFA composition, we conducted genome-wide association studies and meta-analyses of associations of common genetic variants with five plasma n6 PUFAs in 8,631 Caucasian adults (55% female) across five prospective studies. Plasma phospholipid or total plasma fatty acids were analyzed by similar gas chromatography techniques. The n6 fatty acids linoleic acid (LA), gamma-linolenic acid (GLA), dihomo-gamma-linoleic acid (DGLA), arachidonic acid (AA), and adrenic acid (AdrA) were expressed as % of total fatty acids. We performed linear regression with robust standard errors to test for SNP-fatty acid associations, with pooling using inverse-variance weighted meta-analysis. Novel regions were identified on chromosome 10 associated with LA (rs10740118, p-value = 8.1x10⁻⁹; near NRBF2); on chromosome 16 with LA, GLA, DGLA, and AA ( rs16966952, p-value = 1.2×10⁻¹⁵, 5.0×10⁻¹¹, 7.6×10−65, and 2.4×10⁻¹⁰, respectively; NTAN1); and on chromosome 6 with AdrA following adjustment for AA (rs3134950, p-value = 2.1×10⁻¹⁰; AGPAT1). We confirmed previous findings of the FADS cluster on chromosome 11 with LA and AA, and further observed novel genome-wide significant association of this cluster with GLA, DGLA, and AdrA (p-value = 2.3×10−72, 2.6×10−151, and 6.3×10−140, respectively).
Conclusions
Our findings suggest that along with the FADS gene cluster, additional genes may influence n6 PUFA composition.
Keywords: fatty acid, Genome Wide Association Study, epidemiology, n6 fatty acids
Introduction
It is well documented that certain long chain polyunsaturated fatty acids (PUFAs) such as the omega-3's (n3) in fatty fish are beneficial with respect to cardiovascular health. More recently it has been proposed that the omega-6 (n6) PUFAs may also have health benefits1-4, though opposing findings have also been reported 5-7. N6 PUFAs metabolize into the powerful bioactive eicosanoids such as leukotrienes, thromboxanes, and lipoxins that influence biological processes that relate to health such as inflammation and platelet aggregation. N6 PUFAs have been differentially associated with inflammatory cytokines, clotting factors, and endothelial dysfunction markers, but only for certain n6 PUFAs8-10. As plasma and cell membranes may be composed of different n6 PUFAs in variable concentrations, it is important to characterize the determinants of plasma and cell membrane n6 PUFA composition. Dietary intake, lifestyle, and demographic characteristics11-15 are well known to influence n6 levels; however, recent findings from genome-wide association studies (GWAS) and the Kibbutzim Family Study indicate a strong genetic component in determining plasma and erythrocyte fatty acid composition16-18.
To date, the best characterized genes shown to affect plasma and membrane PUFA composition are the fatty acid desaturase (FADS) genes, FADS1 and FADS2. These biologically relevant candidate genes encode the delta-5 and delta-6 desaturases which participate in the metabolic conversion of the essential fatty acid linoleic acid (LA) to longer chain n6 PUFAs (Figure 1). Candidate gene studies have demonstrated significant associations of the minor alleles in the FADS cluster with multiple n6 PUFAs including arachidonic acid (20:4n6, AA), linoleic acid (18:2n6, LA), gamma linoleic acid (18:3n6, GLA), dihomo gamma linoleic acid (20:3n6, DGLA), and adrenic acid (22:4n6, AdrA)19-22. A recent GWAS of fatty acids confirmed the association of genetic variants in FADS1, FADS2, and FADS3 with LA and AA18; however, it remains unknown whether other loci beyond FADS influence LA and AA composition, and whether any genetic loci influence levels of the other n6 fatty acids including GLA, DGLA, and AdrA.
Figure 1.

N6 polyunsaturated fatty acid metabolic pathway and summary of genome-wide significant associations. The associations of loci with each fatty acid are shown with dashed arrows. + and – signs indicate the direction of the associations.
Given the gaps in our current knowledge of genetic determinants of n6 PUFA composition, we carried out a large-scale meta-analysis of GWAS from five participating cohorts in the Cohorts for Heart and Aging Research in Genomic Epidemiology (CHARGE) Consortium23 to identify common genetic variants associated with plasma n6 fatty acid phenotypes, including LA, GLA, DGLA, AA, and AdrA.
Materials and Methods
Ethics statement
Informed consent forms were signed by participants and each local institutional review board of the participating cohort studies approved the study protocols.
Study population
Study participants in the current GWAS were of European ancestry, had available plasma n6 PUFA and genetic data, and were enrolled in one of five cohorts, including the Atherosclerosis Risk in Communities (ARIC) study (n=3,269), Coronary Artery Risk Development in Young Adults (CARDIA) study (n=1,507), Cardiovascular Health Study (CHS) (n=2,404), Invecchiare in Chianti (InCHIANTI) Study (n=1,075), and an ancillary study to the Multi-Ethnic Study of Atherosclerosis (MESA) (n=707). Descriptions of each of these studies have been previously published 24-28.
Measurement of Plasma Phospholipid or Total Plasma Fatty acids
Details of plasma fatty acid measurement have been described previously (Supplemental text). In the ARIC, CARDIA, and MESA cohorts, phospholipid fatty acids were analyzed according to Cao et al.29. First, total lipids were extracted and phospholipid fraction was isolated by thin layer chromatography. Isolated phospholipids were then converted to fatty acid methyl esters for further separation by gas chromatography. CHS used a similar method (Supplemental text). In the InCHIANTI study, total plasma fatty acids were directly measured by gas chromatography30. AdrA was measured in the ARIC and CHS cohorts only. N6 fatty acids in all studies were expressed as % of total fatty acids.
Imputation and Statistical Analysis
Genotyping was done in each cohort separately using high-density SNP marker platforms (ARIC, CARDIA and MESA - Affymetrix 6.0, CHS - Illumina 370, InCHIANTI - Illumina 550). Samples with call rates below 95% (ARIC, CARDIA, MESA), or 97% (CHS, InCHIANTI) at genotyped markers were excluded. Genotypes were imputed to ~2.5 million HapMap SNPs using MACH31 (ARIC, InCHIANTI), BIMBAM32 (CHS), BEAGLE33 (CARDIA) or IMPUTE2.1.034 (MESA). SNPs for which testing Hardy Weinberg equilibrium resulted in p<10−5 were excluded from imputation. SNPs with minor allele frequency (MAF) < 1% or imputation quality score (estimated r2) < 0.3 were excluded from the meta-analyses. Additional details on genotyping and imputation per cohort are provided in Supplementary Table 1.
The main analysis was linear regression of each fatty acid on single-SNP allele dosage from imputation, including covariates to account for age, sex, site of recruitment when appropriate (InCHIANTI, CARDIA, CHS and MESA), as well as the top 2 (MESA) or top 10 (CARDIA, CHS) principal components to adjust for potential population structure. To reduce the complexity of analysis by each cohort, we chose a conservative model without adjusting for diet and other lifestyle variables. In all cohorts, we used a robust Huber-White sandwich variance estimator which provides protection against miss-specified mean models, as well as non-constant variance (heteroskedasticity)35-37. The association results in each cohort were corrected by genomic control method38, which provides additional protection against spurious findings due to population stratification, the results were then combined using inverse-variance weighted meta-analysis in METAL (www.sph.umich.edu/csg/abecasis/metal). Cochran's Q-test was used to assess potential heterogeneity among results from multiple cohorts39. As the Cochran Q-test p-value for each meta-analysis in our study was ≥0.05, we chose the fixed effect meta-analysis to pool results across the cohorts. We declared a fatty acid-SNP association “genome-wide significant” if the nominal p-value for the SNP was < 5 × 10⁻⁸. For the significantly associated SNPs, we calculated the “proportion of variation explained” by a particular variant in each cohort using an approximation: (β2*2*MAF*(1-MAF))/Var(Y), where β is the regression coefficient for one copy of the allele, MAF is the minor allele frequency and Var(Y) is the variance of the fatty acid in the corresponding cohort.
To explore additional independent susceptibility variants at the loci identified in the main analysis, we repeated the GWAS and meta-analysis conditioning on the most significant SNPs in each loci, specifically rs10740118 (chromosome 10), rs174547 (chromosome 11), and rs16966952 (chromosome 16).
We also performed GWAS and meta-analysis in which each SNP was tested for association with n6 fatty acid levels, adjusting for levels of the preceding fatty acid in the biological pathway (Figure 1). For example, to identify additional SNPs associated with GLA (18:3n6), we conducted a GWAS of GLA with adjustment for LA (18:2n6).
Results
The five cohort studies included 8,631 adults (55% female) of European ancestry who were average age 60 years (Table 1). The mean proportion of LA in plasma phospholipids was ~20% of total phospholipid fatty acids, ranging from 19.96% in CHS to 21.98% in CARDIA The mean proportion of AA ranged from 10.87% in CHS to 12.1% in MESA. InCHIANTI, total plasma LA was slightly higher (24.78%) and AA was lower (8.00%), relative to the phospholipid fatty acid fraction in other cohorts8. GLA and DGLA were present in substantially smaller amounts across studies (ranging 0.09-0.12% and 3.13-3.33%, respectively). In ARIC and CHS, plasma phospholipid fatty acids were analyzed for AdrA and the proportions were similar in the two studies.
Table 1.
Characteristics of participants included in the n6 GWAS meta-analysis, n=8,631
| Cohort Studies | N | Age, Years (SD) | Women % | Phospholipid fatty acids % of total fatty acid distribution | ||||
|---|---|---|---|---|---|---|---|---|
| LA* | GLA* | DGLA* | AA* | AdrA* | ||||
| ARIC | 3269 | 53.8 (5.6) | 51.3 | 21.97 | 0.11 | 3.33 | 11.45 | 0.52 |
| CARDIA | 1507 | 45.8 (3.4) | 53.1 | 21.98 | 0.11 | 3.26 | 11.80 | NA |
| CHS | 2404 | 72.0 (5.1) | 61.6 | 19.96 | 0.09 | 3.13 | 10.87 | 0.50 |
| InChianti | 1075 | 68.4 (15.5) | 54.9 | 24.78 | NA† | NA† | 8.00 | NA |
| MESA | 707 | 61.6 (10.4) | 53.2 | 20.90 | 0.12 | 3.26 | 12.1 | NA |
| Total | 8,962 | 60.3 | 54.8 | |||||
LA=linoleic acid; GLA=gamma linolenic acid; DGLA=dihomo gamma linoleic acid; AA=arachidonic acid; AdrA=adrenic acid;
NA=not available
Meta-analysis of genome-wide associations of n6 fatty acids
Figures 2a-e show the Manhattan plots for the meta-analysis of the genome-wide association results for LA, AA, GLA, DGLA, and AdrA. The genomic inflation factors are 1.02, 0.99, 1.01, 1.02, and 1.02 for LA, GLA, DGLA, AA, and AdrA, respectively. For the primary analysis, adjusting for only age and sex (and other covariates where applicable), genome-wide significant signals were identified on chromosome 10, 11, and 16 for LA, GLA, DLGA, AA, and/or AdrA (Table 2).
Figure 2A-E.
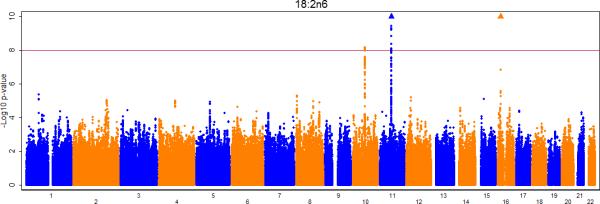
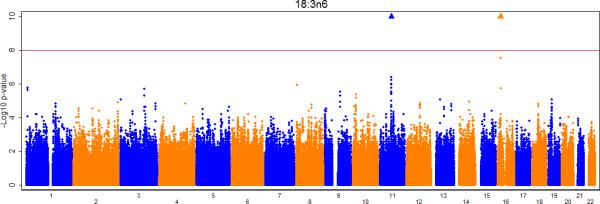
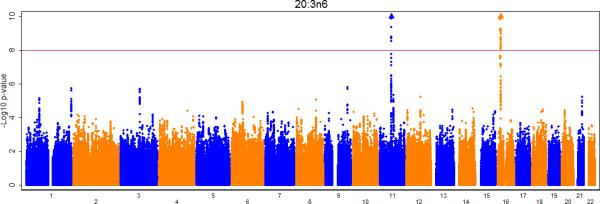
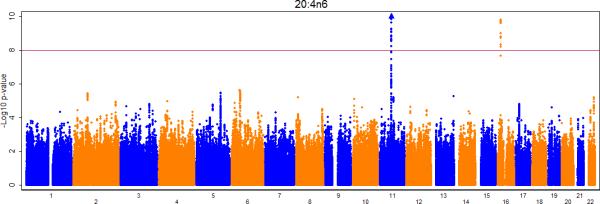
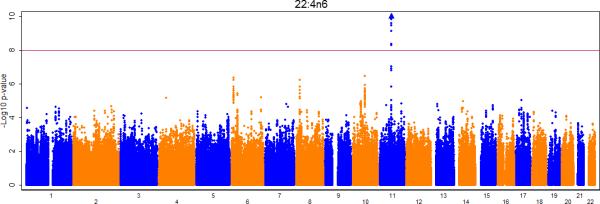
Meta-analysis of genome-wide associations with n6 polyunsaturated fatty acids: A. Linoleic acid (LA; 18:2,n6), B. Gamma linolenic acid (GLA; 18:3,n6), C. Dihomo-gamma-linolenic acid (DGLA; 20:3,n6), D. Arachidonic acid (AA; 20:4,n6), E Adrenic acid (AdrA; 22:4,n6). Associations were graphed by chromosome position and –log10 (p-value) up to p-values of 10−10. Triangles indicate additional SNPs with p-values < 10−10. Genes of interest within the significant SNPs are indicated.
Table 2.
Genetic loci where common polymorphisms are associated with plasma fatty acid (% total fatty acids) with p<5 X 10⁻⁸
| Most significant Single-Nucleotide Polymorphisms (SNPs) | |||||||
|---|---|---|---|---|---|---|---|
| Fatty acid/ chromosome | Model | No. of SNPs (p<5.0x10⁻⁸) | SNP, allele | MAF* | p-value | Parameter coefficient (SE) | % variance explained† |
| Linoleic acid (LA; 18:2,n6) | |||||||
| 10 | Main effect‡ Adj top SNP (rs10740118) § |
26 0 |
rs10740118,c --- |
0.44 --- |
8.1x10−09 --- |
−.25 (.05) | 0.2-0.7 |
| 11 | Main effect‡ Adj top SNP(rs174547)§ |
114 16 |
rs174547, c rs2727270, t |
0.33 0.44 |
5.0x10−274 2.6x10⁻²¹ |
1.47 (.05) .69 (.07) |
7.6-18.1 0.5-2.4 |
| 16 | Main effect‡ Adj top SNP (rs16966952) § |
16 3 |
rs16966952,a rs2280018,a |
0.31 0.38 |
1.2x10⁻¹⁵ 3.6x10⁻¹⁴ |
−.35 (.04) .38 (.05) |
0.5-2.5 0.6-1.4 |
| Gamma linolenic acid (GLA; 18:3,n6) | |||||||
| 11 | Main effect‡ Adj top SNP (rs174547)§ Adj preceding FA (LA)¶ |
66 0 35 |
rs174547, c --- rs174547, c |
0.33 --- 0.33 |
2.3x10−72 --- 1.5x10⁻²⁰ |
−.016 (.001) --- −.0085 (.0008) |
2.2-4.6 0.6-1.4 |
| 16 | Main effect‡ Adj top SNP (rs16966952) § Adj preceding FA (LA) ¶ |
16 0 0 |
rs16966952,a --- --- |
0.31 | 5.0x10⁻¹¹ --- --- |
−.0061 (.0010) | 0.3-1.8 |
| Dihomo-gamma-linolenic acid (DGLA; 20:3,n6) | |||||||
| 11 | Main effect‡ Adj top SNP (rs174547)§ Adj preceding FA (GLA)¶ |
92 22 100 |
rs174547, c rs968567, t rs174547, c |
0.33 0.16 0.33 |
2.6x10−151 1.3x10−42 1.7x10−184 |
.36 (.01) .29 (.02) .42 (.02) |
8.7-11.1 1.4-7.9 11.7-15.4 |
| 16 | Main effect‡ Adj top SNP (rs16966952) § Adj preceding FA (GLA)¶ |
89 5 79 |
rs16966952,a rs2280018,a rs16966952,a |
0.31 0.39 0.31 |
7.6x10−65 4.5x10⁻²⁵ 1.8x10−56 |
−.22 (.02) −.16 (.02) −.20 (.01) |
2.0-4.5 1.4-2.8 1.6-3.9 |
| Arachidonic acid (AA; 20:4,n6) | |||||||
| 11 | Main effect‡ Adj top SNP (rs174547)§ Adj preceding FA (DGLA)¶ |
186 8 173 |
rs174547, c rs102275, c rs174547, c |
0.33 0.30 0.33 |
3.0x10−971 6.6x10−147 5.0x10−850 |
−1.69 (.02) −2.49 (.10) −1.79 (.03) |
3.7-37.6** 0.3-5.8 24.0-40.0 |
| 16 | Main effect‡ Adj top SNP (rs16966952) § Adj preceding FA (DGLA) ¶ |
16 0 17 |
rs16966952,a --- rs16966952,a |
0.31 --- 0.31 |
2.4x10⁻¹⁰ --- 1.3x10⁻¹⁷ |
−.20 (.03) --- −.29 (.03) |
0.1-0.6 --- 0.7-1.1 |
| Adrenic acid (22:4,n6) | |||||||
| 11# | Main effect‡ Adj top SNP (rs174547)§ Adj preceding FA (AA) ¶ |
77 0 0 |
rs174547, c --- --- |
0.33 --- --- |
6.3x10−140 --- --- |
−.048 (.002) --- --- |
7.8-10.9 |
| 6# | Main effect‡ Adj top SNP (rs174547)§ Adj preceding FA (AA) ¶ |
0 0 3 |
--- --- rs3134950, c |
--- --- 0.38 |
--- --- 2.1x10⁻¹⁰ |
--- --- .012 (.002) |
--- --- 0.3-0.9 |
MAF = minor allele frequency
Range of %variance explained across 5 cohorts.
Main effect model is adjusted for age and sex
Adj top SNP model is adjusted for age, sex, and the top SNP
Adj shorter (preceding) FA model is adjusted for age, sex, and the shorter, adjacent fatty acid
The signal on chromosome 11 was significant in main analysis of AdrA, but non-significant when the top SNPs or preceding FA being adjusted; the signal on chromosome 6 became genome-wide significant when preceding FA was adjusted in the model.
%variance explained for ARIC, CARDIA, CHS, InChianti, and MESA was 37.6, 26.8, 37.5, 3.7, and 22.9, respectively.
LA was associated with multiple SNPs on chromosome 10 in a region that included nuclear receptor binding factor 2 (NRBF2), jumonji domain containing 1C (JMJD1c), and receptor accessory protein 3 (REEP3) (Figure 3a). The most significant SNP was rs10740118 (p = 8.1×10⁻⁹). There was no association of SNPs in this region with the other n6 fatty acids. We found the most significant associations of SNP rs174547 in FADS1 on chromosome 11 with all five n6 fatty acids. Several other SNPs were also genome-wide significant, falling within the FADS2 and FADS3 regions. Four n6 fatty acids (LA, GLA, DGLA, and AA) were associated with SNPs in a region of chromosome 16 that included pyridoxal-dependent decarboxylase domain containing 1 (PDXDC1), N-terminal asparagine amidase (NTAN1), and RNA polymerase I-specific transcription initiation factor (RRN3). Using LA as an example, Figure 3 shows regional association plots for the three identified regions.
Figure 3A-C.
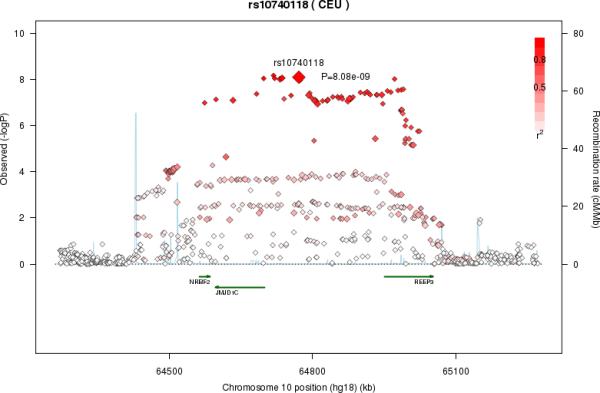
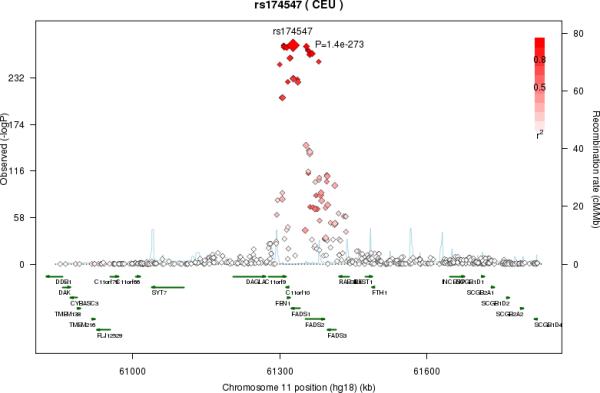
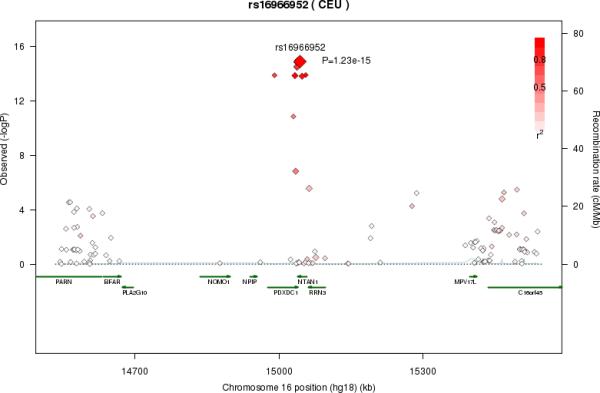
Regional association plots in the genome-wide association of Linoleic acid (LA; 18:2,n6). The color scheme is red for strong linkage disequilibrium (LD) and fading color for lower LD. A. Regional association plot for rs10740118 on chromosome 10. B. Regional association plot for rs174547 on chromosome 11. C. Regional association plot for rs16966952 on chromosome 16
Notably, in the five cohorts, the top SNP rs174547 on chromosome 11 independently explained a relatively large proportion of variation in certain n6 PUFA, for example, 8.7-11.1% for DGLA across the five cohorts, and >20% for AA in four of the five cohorts. rs16966952 on chromosome 16 independently explained 0.1-0.6% to 2.0-4.5% of total variation in AA and DGLA, respectively; and rs10740118 on chromosome 10 independently explained 0.2-0.7% of variation in LA (Table 2). These three SNPs were genotyped in four of the five cohorts except CHS, in which the imputation R2 was 0.80 for rs10740118, and >0.98 for the other two SNPs. Forest plots (Supplementary Figure S1, Supplementary Table 2) were shown for associations between each SNP and LA, and the plots for other n6 fatty acids were similar.
Large numbers of SNPs reached genome-wide significance in each of the three identified regions. To identify potential secondary signals within these regions, we conducted conditional analysis for each of the 5 n6 PUFA by adjusting for the top SNP in addition to the covariates included in the main analysis (Table 2; Supplementary Tables 3-7). For LA, no other significant association on chromosome 10 was evident after adjustment for the top SNP (rs10740118). Similarly, after adjustment for rs174547, no additional significant association was observed for GLA or AdrA in the region of chromosome 11. Interestingly, after adjusting for rs174547, additional significant associations were identified for LA (rs2727270, p-value = 2.6×10⁻²¹), DGLA (rs968567, p-value = 1.3×10−42), and AA (rs102275, p-value = 6.6×10−147). In the region of chromosome 16, we observed no additional significant associations with GLA or AA after adjusting for the top SNP rs16966952. However, in analyses adjusted for rs16966952, another SNP (rs228018) was identified that was significantly associated with LA and DGLA (p-value = 3.6×10⁻¹⁴ and 4.5×10⁻²⁵).
Circulating levels of the five n6 PUFA were correlated with each other, with correlation coefficients ranging from −0.63 to 0.49 (Supplementary Table 8). In analyses of GLA adjusted for its precursor LA, estimated effect sizes of the most significant SNPs (rs174547 and rs16966952) in the main unadjusted analysis decreased by 47% and 31%, respectively (Table 3); rs174547 was still genome wide significant (p-value = 1.5×10⁻²⁰), but rs16966952 failed to reach genome-wide significance (p-value = 3.1×10⁻⁶) (Table 3). This observation is consistent with the finding that SNP – LA associations partially explained SNP – GLA associations. Similarly, in analyses of AdrA adjusted for AA, no genome-wide significant signal was observed on chromosome 11 for AdrA (p-value = 2.0×10⁻² for rs174547).
Table 3.
Estimated effects of top SNPs in main analysis and secondary analysis adjusting for preceding fatty acid in metabolic pathway.
| Fatty acid (outcome) | Preceding fatty acid (covariate) | Correlation* | Most significant SNP | Risk allele | Estimated effect (p-value) Main analysis | Estimated effect (p-value) Secondary analysis |
|---|---|---|---|---|---|---|
| GLA (18:3,n6) | LA (18:2,n6) | −.26 | rs174547 | c | −.016 (2.3x10−72) | −.0085 (1.5x10⁻²⁰) |
| rs16966952 | a | −.0061 (5.0x10⁻¹¹) | −.0042 (3.1x10⁻⁶) | |||
| DGLA (20:3,n6) | GLA (18:3,n6) | .22 | rs174547 | c | .36 (2.6x10−151) | .42 (1.7x10−184) |
| rs16966952 | a | −.22 (7.6x10−65) | −.20 (1.8x10−56) | |||
| AA (20:4,n6) | DGLA (20:3,n6) | −.15 | rs174547 | c | −1.69 (3.0x10−971) | −1.79 (5.0x10−850) |
| rs16966952 | a | −.20 (2.4x10⁻¹⁰) | −.29 (1.3x10⁻¹⁷) | |||
| AdrA (22:4,n6) | AA (20:4,n6) | .49 | rs174547 | c | −.048 (6.3x10−140) | .0056 (2.0x10⁻²) |
| rs3134950 | c | −.0097 (5.7x10⁻⁶) | −.012 (2.1x10⁻¹⁰) |
Pearson correlation coefficient between the two fatty acids
Another motivation for the exploratory analyses was the possibility of discovering new associations: When two fatty acids are positively correlated, there is greater statistical power to identify SNP-fatty acid associations that are in the opposite directions for the fatty acid and its precursor. Indeed, in analyses of DGLA adjusted for its precursor GLA, and in analyses of AA adjusted for its precursor DGLA, the rs174547-DGLA and rs16966952-AA associations became more significant (with greater effect sizes) (Table 3). Furthermore, in analyses of AdrA adjusted for AA, a novel region on chromosome 6 was found. The most significant SNP, rs3134950 (p-value = 2.1×10⁻¹⁰), was positively associated with AA (coefficient = .085, p-value = 6.6×10⁻³), but inversely associated with AdrA (coefficient = −.0097, p-value = 5.7−10−6) in the main analyses. Multiple genes were near the association signals on chromosome 6, including 1-acylglycerol-3-phosphate O-acyltransferase 1 (AGPAT1) (Figure 4).
Figure 4.
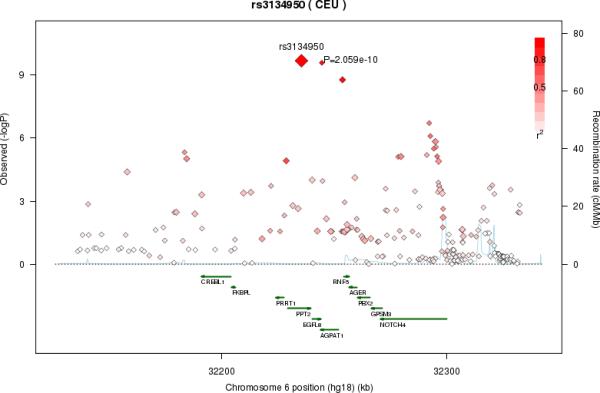
Regional association plot on chromosome 6 in the secondary analyses, adjusting arachidonic acid (AA) for adrenic acid (AdrA). The color scheme is red for strong linkage disequilibrium (LD) and fading color for lower LD.
Each of the identified significant SNPs were either directly genotyped or imputed with high quality scores in the five cohorts, with the mean imputation quality score (r2) between 0.93 and 1.00. We further examined the potential effect modification of obesity on fatty acid metabolism in the ARIC cohort, the study with the largest sample (n=3269), using body mass index (BMI) information categorized into normal weight (BMI<25), overweight (25<BMI<30), and obese (BMI>30). There was no significant interaction observed between the BMI categories and any of our top SNPs (all p>0.10). Finally, to investigate the potential impact of BMI, physical activity, and dietary intakes of total calories and linoleic acid on the study results, we conducted additional analyses using ARIC data. There was little change in the estimated coefficients and p-values with or without these covariates in the models and no new signal reached genome-wide significance in the five GWASs. We included in Supplementary Table 9 the estimated effect sizes of the top 3 SNPs in the main analysis.
Discussion
With over 8900 adults of European ancestry across five prospective cohorts, the present analysis represents the largest GWAS of circulating n6 fatty acids to date. We confirmed previous findings that the FADS cluster on chromosome 11 associates with LA and AA18-22, and further extended these findings to additional n6 PUFAs. In addition, we identified multiple novel regions on chromosomes 6, 10, and 16 with multiple n6 PUFAs.
FADS1 and FADS2 genetic variants play a clear role in regulating n6 PUFAs. In particular, the C allele of rs174547 in FADS1 was associated with a higher proportion of LA and lower GLA (consistent with lower delta-6 desaturase activity), and a higher proportion of DGLA and lower AA (consistent with lower delta-5 desaturase activity). This polymorphism has previously been recognized for its association with n6 PUFAs and desaturase activities22, and our findings build upon and extend these prior observations by documenting additional inverse associations with GLA and DGLA. Conditional analysis identified additional SNPs in FADS2 associated with higher LA and DGLA and a site upstream from FADS1 associated with lower AA. Together, the data suggest that FADS gene minor allele polymorphisms in FADS1 and FADS2 may suppress delta-5 and delta-6 desaturase expression and/or activity resulting in less flux through the pathway and lower rates of AA and AdrA syntheses. It remains unclear whether such FADS polymorphisms have biological effects on plasma FA composition40-43, and our findings highlight the need for additional study of potential interaction among FADS variation, n6 PUFAs, and metabolic biomarkers and health outcomes.
Further, rs174547 was highly correlated with rs174538 (r2=.83) in the current study, which was the SNP most significantly associated with n3 FA in our prior GWAS17. The 18-carbon N3 fatty acid alpha-linolenic acid (ALA) is converted to the 20- and 22-carbon N3 fatty acids (e.g. EPA and DHA) via the same enzymatic pathway that converts the 18-carbon LA to the longer chain N6 fatty acids. Therefore, our identification of highly correlated SNPs in the FADS1/2 cluster that relate to both N3 and N6 fatty acids is consistent with existing biochemical knowledge and highlight the important inter-related nature of N3/N6 PUFA metabolism.
Apart from our novel findings for the FADS gene cluster, additional novel associations were observed among multiple n6 PUFAs and gene variants of NRBF2, PDXDC1, AGPAT1, and NTAN1. Notably, all genes except PDXDC1 encode proteins shown to be involved in fatty acid metabolism which may account for the associations found here. For example, NRBF2 encodes nuclear receptor-binding factor 2 which interacts with PPAR-α44—a transcription factor that upregulates lipoprotein lipase activity and fatty acid oxidation. Though the specific mechanism that accounts for the association between the rs10740118 NRBF2 variant and LA is not established, we hypothesize that variants of nuclear receptor-binding factor 2 may differentially bind PPAR-α, thus affecting fatty acid bioavailability. Our novel findings indicate the need for additional studies of how NRBF2 influences fatty acid biology and LA in particular.
For AGPAT1 on chromosome 6, we observed an association of the rs3134950 SNP and AdrA, following adjustment for its fatty acid precursor, AA. The AGPAT1-encoded protein, 1-acyl-sn-glycerol-3-phosphate acyltransferase α, is a critical enzyme in phospholipid and triglyceride biosynthesis, catalyzing the conversion of lysophosphatidic acid to phosphatidic acid45. In experimental studies, the AGPAT1 protein shows a preference for LA as a fatty acid substrate46. Though AdrA was not investigated as a possible substrate of AGPAT1, our findings suggest the possibility that variation in the AGPAT1 gene may influence the availability of LA and fatty acids downstream in the pathway.
An additional novel finding was the association of genetic variants in NTAN1 on chromosome 16 with lower proportions of all n6 fatty acids except AdrA. Notably, the most significant genetic variant in NTAN1 (rs16966952) is in linkage disequilibrium (LD, r2 =0.76) with SNP (rs4985167) of the PDXDC1 gene that we previously found to be associated with the n3 fatty acid, α-linolenic acid (18:3n3)17. Biochemically, the PDXDC1-encoded protein is a vitamin B6-dependent decarboxylase that is preferentially expressed in the intestine, but its physiological importance remains unknown. Alternatively, the associated SNPs on chromosome 16 are also proximate to the PLA2G10 gene, which encodes the secretory phospholipase group-10 enzyme (X-sPLA2). Functionally, X-sPLA2 hydrolyzes phospholipids to release free fatty acids47 and promotes the liberation and bioavailability of n6 AA from glycerophospholipids48. Notably, the above findings in the PDXDC1 and PLA2G10 genes are in agreement with a previous report of associations of both genes with phospholipid fatty acid species49. Overall, the mechanisms that explain the novel associations of NRBF2 rs10740118, NTAN1 rs16966952 and AGPAT1 SNP rs3134950 with these n6 PUFAs are not completely understood at present, but may be due to the corresponding enzyme/protein's role in n6 fatty acid metabolism. Further research is warranted to fully explain these associations.
The FADS gene polymorphisms have been associated with lipid and cholesterol levels as well as incident coronary heart disease (CHD). In a study of 4635 Swedish subjects, the rs174547 C allele was found to be associated with modestly lower LDL-C levels but not with HDL-C or triglyceride levels in individuals with relatively lower N3 dietary intake40. In contrast, a case-control study of CHD in Chinese subjects revealed the CC variant of rs174547 was associated with higher HDL-C and triglyceride levels41. The investigators proposed that these variations in lipid levels may be partially attributable to the FADS variant which may contribute to CHD development. Finally, a candidate gene case-control study of coronary artery disease reported that certain FADS haplotypes were associated with disease risk42. Contrary to these studies, null findings have also been reported in the cohorts of the Nurses’ Health Study (n=1200) and the Health Professionals Follow-Up Study (n=1295)43. It remains important to identify the relationship(s) between SNPs and lipid traits which improve our biological understanding of these pathways. Further, studies are needed to investigate the association of the new genes with the intermediate endpoints, such as leukotrienes, thromboxanes, and lipoxins, and with disease outcomes.
The current study highlights the unique strength of non-hypothesis-driven GWAS for identifying novel common genetic polymorphisms associated with n6 PUFAs. Using samples with European ancestry from each cohort, as well as including factors for population stratification using principal components analysis, reduces the potential for confounding by population stratification. The meta-analysis approach combines results from multiple cohorts to increase the statistical power to identify genes that may not have been identified due to small effects or low frequency. Importantly, our meta-analysis results were consistent across all participating cohorts [Supplementary Figure 1], further increasing confidence in the validity and generalizability of the findings.
Potential limitations may be considered. First, InCHIANTI examined total plasma fatty acid composition, while the other cohorts examined the composition of phospholipid fatty acid fraction. Yet, findings from InCHIANTI were similar to those observed in the other cohorts. Both the magnitude and direction of associations were consistent across all 5 cohorts (Supplementary Figure 1). We also carried out meta-analysis excluding the InCHIANTI study. Notably, the observed associations on chromosome 10, 11, and 16 were weaker but still consistent (data not shown) which suggests that the tissue where fatty acids were measured had minimal effects on the identified SNP-fatty acid associations. Second, it is possible that environmental factors may influence the gene-fatty acid associations. However, the fatty acid-SNP associations changed little when including BMI, physical activity and dietary linoleic acid and energy intakes in the statistical models using ARIC data (Supplementary Table 9). Third, it must be acknowledged that the present analysis is a hypothesis generating study. And although we have speculated on potential mechanisms, further research is required to elucidate the biological effects of the identified polymorphisms. In addition, due to the high LD in identified loci, it is unclear which SNPs are causal with the associated FA, and finer mapping of these regions is needed to identify the functional SNP. Lastly, although our findings passed stringent thresholds for multiple testing corrections, future replication studies are still needed to confirm our results in other European populations as well other cohorts of different racial groups.
Our study confirmed previous GWAS findings that FADS gene variants are associated with plasma and cell membrane fatty acid composition for n6 fatty acids. Notably, we identified novel associations between N6 PUFAs and SNPs in NTAN1, AGPAT1, and NRBF2 genes. Our findings provide a roadmap for further investigation of genetic and metabolic pathways that may influence N6 PUFA.
Supplementary Material
Acknowledgments
The authors thank the other investigators, the staff and the participants of the ARIC study, the CARDIA study, CHS, MESA, and the InCHIANTI study for their important contributions. A full list of principal CHS investigators and institutions can be found at http://www.CHS-NHLBI.org. A full list of principal CARDIA investigators and institutions can be found at http://www.cardia.dopm.uab.edu/. A full list of participating MESA investigators and institutions can be found at http://www.mesa-nhlbi.org. The authors acknowledge the essential role of the CHARGE (Cohorts for Heart and Aging Research in Genomic Epidemiology) Consortium in development and support of this. CHARGE members include NHLBI's Atherosclerosis Risk in Communities (ARIC) Study, NIA's Iceland Age Gene/Environment Susceptibility Study, NHLBI's Cardiovascular Health Study (CHS) and Framingham Heart Study, and the Netherland's Rotterdam Study. The authors acknowledge the use of the SNAP server from the Broad Institute (http://www.broadinstitute.org/mpg/snap/) to construct regional association plots.
Funding Sources:
Infrastructure for the CHARGE Consortium is supported in part by the National Heart, Lung, and Blood Institute grant HL105756.
The Atherosclerosis Risk in Communities (ARIC) Study is carried out as a collaborative study supported by NHLBI contracts HHSN268201100005C, HHSN268201100006C, HHSN268201100007C, HHSN268201100008C, HHSN268201100009C, HHSN268201100010C, HHSN268201100011C, HHSN268201100012C, R01HL087641, R01HL59367, and R01HL086694; National Human Genome Research Institute (NHGRI) contract U01HG004402; and NIH contract HSN268200625226C. Infrastructure was partly supported by Grant Number UL1RR025005, a component of the NIH Roadmap for Medical Research.
The Cardiovascular Health Study (CHS) was supported by contracts HHSN268201200036C, HHSN268200800007C, N01HC55222, N01HC85079, N01HC85080, N01HC85081, N01HC85082, N01HC85083, N01HC85086; and grants HL080295, HL087652, HL105756 from the National Heart, Lung, and Blood Institute (NHLBI), with additional contribution from the National Institute of Neurological Disorders and Stroke (NINDS). Additional support was provided by AG023629 from the National Institute on Aging (NIA). The provision of genotyping data was supported in part by the National Center for Advancing Translational Sciences, CTSI grant UL1TR000124, and the National Institute of Diabetes and Digestive and Kidney Disease Diabetes Research Center (DRC) grant DK063491 to the Southern California Diabetes Endocrinology Research Center. The fatty acid measurements were supported by grant HL085710 from NHLBI.
The Coronary Artery Risk Development in Young Adults (CARDIA) study is funded by contracts N01-HC-95095, N01-HC-48047, N01-HC-48048, N01-HC-48049, N01-HC-48050, N01-HC-45134, N01-HC-05187, N01-HC-45205, and N01-HC-45204 from the NHLBI to the CARDIA investigators. Genotyping of the CARDIA participants was supported by grants U01-HG-004729, U01-HG-004446, and U01-HG-004424 from the NHGRI and R01-HL-084099 from the NHLBI to MF.
The InCHIANTI Study baseline (1998-2000) was supported as a ‘‘targeted project’’ (ICS110.1/RF97.71) by the Italian Ministry of Health and in part by the U.S. NIA Contracts 263 MD 9164 and 263 MD 821336 and was supported in part by the Intramural research program of the NIA, NIH, Baltimore, Maryland.
The Multi-Ethnic Study of Atherosclerosis (MESA) and MESA SHARe were supported by contracts N01-HC-95159 through N01-HC-95169 and RR-024156 from the NHLBI. Funding for MESA SHARe genotyping was provided by NHLBI Contract N02HL64278. The authors thank the other investigators, the staff, and the participants of the MESA study for their valuable contributions. A full list of participating MESA investigators and institutions can be found at http://www.mesa-nhlbi.org. JA Nettleton was supported by a K01 from the NIDDK (5K01DK082729-02).
The funders had no role in study design, data collection and analysis, decision to publish, or preparation of the manuscript. The content is solely the responsibility of the authors and does not necessarily represent the official views of the National Institutes of Health.
Footnotes
Conflict of Interest Disclosures: None.
References
- 1.Harris WS, Poston WC, Haddock CK. Tissue n3 and n6 fatty acids and risk for coronary heart disease events. Atherosclerosis. 2007;193:1–10. doi: 10.1016/j.atherosclerosis.2007.03.018. [DOI] [PubMed] [Google Scholar]
- 2.Shekelle RB, Shryock AM, Paul O, Lepper M, Stamler J, Liu K, et al. Diet, serum cholesterol and death from coronary heart disease: the Western Electric Study. N Engl J Med. 1981;304:65–70. doi: 10.1056/NEJM198101083040201. [DOI] [PubMed] [Google Scholar]
- 3.Laaksonen DE, Nyyssonen K, Niskanen L, Rissanen TH, Salonen JT. Prediction of cardiovascular mortality in middle-aged men by dietary and serum linoleic and polyunsaturated fatty acids. Arch Intern Med. 2005;165:193–199. doi: 10.1001/archinte.165.2.193. [DOI] [PubMed] [Google Scholar]
- 4.Oh K, Hu FB, Manson JE, Stampfer JM, Willett WC. Dietary fat intake and risk of coronary heart disease in women: 20 years of follow-up of the Nurses’ Health Study. Am J Epidemiol. 2005;161:672–679. doi: 10.1093/aje/kwi085. [DOI] [PubMed] [Google Scholar]
- 5.Baylin A, Campos H. Arachidonic acid in adipose tissue is associated with nonfatal myocardial infarction in the central valley of Costa Rica. J Nutr. 2004;134:3095–3099. doi: 10.1093/jn/134.11.3095. [DOI] [PubMed] [Google Scholar]
- 6.Kark JD, Kaufmann NA, Binka F, Goldberger N, Berry EM. Adipose tissue n6 fatty acids and acute myocardial infarction in a population consuming a diet high in polyunsaturated fatty acids. Am J Clin Nutr. 2003;77:796–802. doi: 10.1093/ajcn/77.4.796. [DOI] [PubMed] [Google Scholar]
- 7.McGee DL, Reed DM, Yano K, Kagan A, Tillotson J. Ten-year incidence of coronary heart disease in the Honolulu Heart Program: relationship to nutrient intake. Am J Epidemiol. 1984;119:667–676. doi: 10.1093/oxfordjournals.aje.a113788. [DOI] [PubMed] [Google Scholar]
- 8.Steffen BT, Steffen LM, Tracy R, Siscovick D, Jacobs D, Liu K, et al. Ethnicity, plasma phospholipid fatty acid composition and inflammatory/endothelial activation biomarkers in the Multi-Ethnic Study of Atherosclerosis (MESA). Eur J Clin Nutr. 2012;66:600–605. doi: 10.1038/ejcn.2011.215. [DOI] [PMC free article] [PubMed] [Google Scholar]
- 9.Ferrucci L, Cherubini A, Bandinelli S, Bartali B, Corsi A, Lauretani F, et al. Relationship of plasma polyunsaturated fatty acids to circulating inflammatory markers. J Clin Endocrinol Metab. 2006;91:439–446. doi: 10.1210/jc.2005-1303. [DOI] [PubMed] [Google Scholar]
- 10.Kalogeropoulos N, Panagiotakos DB, Pitsavos C, Chrysohoou C, Rousinou G, Toutouza M, et al. Unsaturated fatty acids are inversely associated and n-6/n-3 ratios are positively related to inflammation and coagulation markers in plasma of apparently healthy adults. Clin Chim Acta. 2010;411:584–591. doi: 10.1016/j.cca.2010.01.023. [DOI] [PubMed] [Google Scholar]
- 11.Hodson L, Skeaff CM, Fielding BA. Fatty acid composition of adipose tissue and blood in humans and its use as a biomarker of dietary intake. Prog Lipid Res. 2008;47:348–380. doi: 10.1016/j.plipres.2008.03.003. [DOI] [PubMed] [Google Scholar]
- 12.Asciutti-Moura LS, Guilland JC, Fuchs F, Richard D, Klepping J. Fatty acid composition of serum lipids and its relation to diet in an elderly institutionalized population. Am J Clin Nutr. 1988;48:980–987. doi: 10.1093/ajcn/48.4.980. [DOI] [PubMed] [Google Scholar]
- 13.Crowe FL, Skeaff CM, Green TJ, Gray AR. Serum n3 long chain PUFA differ by sex and age in a population-based survey of New Zealand adolescents and adults. Brit J Nutr. 2008;99:168–174. doi: 10.1017/S000711450779387X. [DOI] [PubMed] [Google Scholar]
- 14.Bates C, van Dam C, Horrobin DF, Morse N, Huang YS, Manku MS. Plasma essential fatty acids in pure and mixed race American Indians on and off a diet exceptionally rich in salmon. Prostaglandins, Leukotrienes Medicine. 1985;17:77–84. doi: 10.1016/0262-1746(85)90036-8. [DOI] [PubMed] [Google Scholar]
- 15.Pawlosky RJ, Hibbeln JR, Salem N., Jr Compartmental analyses of plasma n3 essential fatty acids among male and female smokers and nonsmokers. J Lipid Res. 2007;48:935–943. doi: 10.1194/jlr.M600310-JLR200. [DOI] [PubMed] [Google Scholar]
- 16.Lemaitre RN, Siscovick DS, Berry EM, Kark JD, Friedlander Y. Familial aggregation of red blood cell membrane fatty acid composition: the Kibbutzim Family Study. Metabolism. 2008;57:662–668. doi: 10.1016/j.metabol.2007.12.011. [DOI] [PubMed] [Google Scholar]
- 17.Lemaitre RN, Tanaka T, Tang W, Manichaikul A, Foy M, Kabagambe E, et al. Genetic loci associated with plasma phospholipid n-3 fatty acids: A meta-analysis of genome-wide association studies from the CHARGE consortium. PLoS Genet. 2011;7:e1002193. doi: 10.1371/journal.pgen.1002193. [DOI] [PMC free article] [PubMed] [Google Scholar]
- 18.Tanaka T, Shen J, Abecasis GR, Kisialiou A, Ordovas JM, Guralnik JM, et al. Genome-wide association study of plasma polyunsaturated fatty acids in the InCHIANTI Study. PLoS Genet. 2009;5:e1000338. doi: 10.1371/journal.pgen.1000338. [DOI] [PMC free article] [PubMed] [Google Scholar]
- 19.Schaeffer L, Gohlke H, Müller M, Heid IM, Palmer LJ, Kompauer I, et al. Common genetic variants of the FADS1 FADS2 gene cluster and their reconstructed haplotypes are associated with the fatty acid composition in phospholipids. Hum Mol Genet. 2006;15:1745–1756. doi: 10.1093/hmg/ddl117. [DOI] [PubMed] [Google Scholar]
- 20.Mathias RA, Vergara C, Gao L, Rafaels N, Hand T, Campbell M, et al. FADS genetic variants and omega-6 polyunsaturated fatty acid metabolism in a homogeneous island population. J Lipid Res. 2010;51:2766–2774. doi: 10.1194/jlr.M008359. [DOI] [PMC free article] [PubMed] [Google Scholar]
- 21.Mathias RA, Sergeant S, Ruczinski I, Torgerson DG, Hugenschmidt CE, Kubala M, et al. The impact of FADS genetic variants on ω6 polyunsaturated fatty acid metabolism in African Americans. BMC Genet. 2011;12:50. doi: 10.1186/1471-2156-12-50. [DOI] [PMC free article] [PubMed] [Google Scholar]
- 22.Merino DM, Johnston H, Clarke S, Roke K, Nielsen D, Badawi A, et al. Polymorphisms in FADS1 and FADS2 alter desaturase activity in young Caucasian and Asian adults. Mol Genet Metabol. 2011;103:171–178. doi: 10.1016/j.ymgme.2011.02.012. [DOI] [PubMed] [Google Scholar]
- 23.Psaty BM, O'Donnell CJ, Gudnason V, Lunetta KL, Folsom AR, Rotter JI, et al. Cohorts for Heart and Aging Research in Genomic Epidemiology (CHARGE) Consortium: Design of prospective meta-analyses of genome-wide association atudies from 5 cohorts. Circ Cardiovasc Genet. 2009;2:73–80. doi: 10.1161/CIRCGENETICS.108.829747. [DOI] [PMC free article] [PubMed] [Google Scholar]
- 24.The Atherosclerosis Risk in Communities (ARIC) Study: design and objectives. The ARIC investigators. Am J Epidemiol. 1989;129:687–702. [PubMed] [Google Scholar]
- 25.Friedman GD, Cutter GR, Donahue RP, Hughes GH, Hulley SB, Jacobs DR, et al. CARDIA: study design, recruitment, and some characteristics of the examined subjects. J Clin Epidemiol. 1988;41:1105–1116. doi: 10.1016/0895-4356(88)90080-7. [DOI] [PubMed] [Google Scholar]
- 26.Fried LP, Borhani NO, Enright P, Furberg CD, Gardin JM, Kronmal RA, et al. The Cardiovascular Health Study: design and rationale. Ann Epidemiol. 1991;1:263–276. doi: 10.1016/1047-2797(91)90005-w. [DOI] [PubMed] [Google Scholar]
- 27.Ferrucci L, Bandinelli S, Benvenuti E, Di Iorio A, Macchi C, Harris TB, et al. Subsystems contributing to the decline in ability to walk: bridging the gap between epidemiology and geriatric practice in the InCHIANTI study. J Am Geriatr Soc. 2000;48:1618–1625. doi: 10.1111/j.1532-5415.2000.tb03873.x. [DOI] [PubMed] [Google Scholar]
- 28.Bild DE, Bluemke DA, Burke GL, Detrano R, Diez Roux AV. Multi-Ethnic Study of Atherosclerosis: Objectives and design. Am J Epidemiol. 2002;156:871–881. doi: 10.1093/aje/kwf113. [DOI] [PubMed] [Google Scholar]
- 29.Cao J, Schwichtenberg KA, Hanson NQ, Tsai MY. Incorporation and clearance of omega-3 fatty acids in erythrocyte membranes and plasma phospholipids. Clin Chem. 2006;52:2265–2272. doi: 10.1373/clinchem.2006.072322. [DOI] [PubMed] [Google Scholar]
- 30.Lepage G, Roy CC. Direct transesterification of all classes of lipids in a one-step reaction. J Lipid Res. 1986;27:114–120. [PubMed] [Google Scholar]
- 31.Li Y, Willer CJ, Ding J, Scheet P, Abecasis GR. MaCH: using sequence and genotype data to estimate haplotypes and unobserved genotypes. Genet Epidemiol. 2010;34:816–834. doi: 10.1002/gepi.20533. [DOI] [PMC free article] [PubMed] [Google Scholar]
- 32.Servin B, Stephens M. Imputation-based analysis of association studies: candidate regions and quantitative traits. PLoS Genet. 2007;3:e114. doi: 10.1371/journal.pgen.0030114. [DOI] [PMC free article] [PubMed] [Google Scholar]
- 33.Browning BL, Browning SR. A unified approach to genotype imputation and haplotype-phase inference for large data sets of trios and unrelated individuals. Am J Hum Genet. 2009;84:210–223. doi: 10.1016/j.ajhg.2009.01.005. [DOI] [PMC free article] [PubMed] [Google Scholar]
- 34.Marchini J, Howie B, Myers S, McVean G, Donnelly P. A new multipoint method for genome-wide association studies by imputation of genotypes. Nat Genet. 2007;39:906–913. doi: 10.1038/ng2088. [DOI] [PubMed] [Google Scholar]
- 35.White H. Maximum likelihood estimation of misspecified models. Econometrica. 1982;50:1–25. [Google Scholar]
- 36.Hayes AF, Cai L. Using heteroskedasticity-consistent standard error estimators in OLS regression: an introduction and software implementation. Behav Res Methods. 2007;39:709–722. doi: 10.3758/bf03192961. [DOI] [PubMed] [Google Scholar]
- 37.MacKinnon JG, White H. Some heteroskedastic-consistent covariance matrix estimators with improved finite sample properties. J Econometrics. 1985;29:305–325. [Google Scholar]
- 38.Devlin B, Roeder K. Genomic control for association studies. Biometrics. 1999;55:997–1004. doi: 10.1111/j.0006-341x.1999.00997.x. [DOI] [PubMed] [Google Scholar]
- 39.Cochran WG. The combination of estimates from different experiments. Biometrics. 1954;10:101–129. [Google Scholar]
- 40.Hellstrand S, Sonestedt E, Ericson U, Gullberg B, Wirfält E, Hedblad B, et al. Intake levels of dietary long-chain PUFAs modify the association between genetic variation in FADS and LDL-C. J Lipid Res. 2012;53:1183–1189. doi: 10.1194/jlr.P023721. [DOI] [PMC free article] [PubMed] [Google Scholar]
- 41.Liu SJ, Zhi H, Chen PZ, Chen W, Lu F, Ma GS, et al. Fatty acid desaturase 1 polymorphisms are associated with coronary heart disease in a Chinese population. Chin Med J (Engl) 2012;125:801–806. [PubMed] [Google Scholar]
- 42.Martinelli N, Girelli D, Malerba G, Guarini P, Illig T, Trabetti E, et al. FADS genotypes and desaturase activity estimated by the ratio of arachidonic acid to linoleic acid are associated with inflammation and coronary artery disease. Am J Clin Nutr. 2008;88:941–949. doi: 10.1093/ajcn/88.4.941. [DOI] [PubMed] [Google Scholar]
- 43.Aslibekyan S, Jensen MK, Campos H, Linkletter CD, Loucks EB. Fatty Acid desaturase gene variants, cardiovascular risk factors, and myocardial infarction in the Costa Rica study. Front Genet. 2012;3:72. doi: 10.3389/fgene.2012.00072. [DOI] [PMC free article] [PubMed] [Google Scholar]
- 44.Yasumo H, Masuda N, Furusawa T, Tsukamoto T, Sadano H, Osumi T. Nuclear receptor binding factor-2 (NRBF-2), a possible gene activator protein interacting with nuclear hormone receptors. Biochim Biophys Acta. 2000;1490:189–197. doi: 10.1016/s0167-4781(99)00244-4. [DOI] [PubMed] [Google Scholar]
- 45.Leung DW. The structure and functions of human lysophosphatidic acid acyltransferases. Front Biosci. 2001;6:D944–953. doi: 10.2741/leung. [DOI] [PubMed] [Google Scholar]
- 46.Yamashita A, Nakanishi H, Suzuki H, Kamata R, Tanaka K, Waku K, et al. Topology of acyltransferase motifs and substrate specificity and accessibility in 1-acyl-sn-glycero-3-phosphate acyltransferase 1. Biochim Biophys Acta. 2007;1771:1202–1215. doi: 10.1016/j.bbalip.2007.07.002. [DOI] [PubMed] [Google Scholar]
- 47.Ghesquiere SA, Hofker MH, de Winther MP. The role of phospholipases in lipid modification and atherosclerosis. Cardiovasc Toxicol. 2005;5:161–182. doi: 10.1385/ct:5:2:161. [DOI] [PubMed] [Google Scholar]
- 48.Bezzine S, Koduri RS, Valentin E, Murakami M, Kudo I, Ghomashchi F, et al. Exogenously added human group X secreted phospholipase A(2) but not the group IB, IIA, and V enzymes efficiently release arachidonic acid from adherent mammalian cells. J Biol Chem. 2000;275:3179–3191. doi: 10.1074/jbc.275.5.3179. [DOI] [PubMed] [Google Scholar]
- 49.Demrikan A, van Duijn CM, Ugocsai P, Isaacs A, Pramstaller PP, Liebisch G, et al. Genome-wide association study identifies novel loci associated with circulating phospho- and sphingolipid concentrations. PLoS Genet. 2012;8:e1002490. doi: 10.1371/journal.pgen.1002490. [DOI] [PMC free article] [PubMed] [Google Scholar]
Associated Data
This section collects any data citations, data availability statements, or supplementary materials included in this article.