

Abstract
To fully assess contrast-enhanced acoustic bioeffects in diagnostic and therapeutic procedures, the mechanical properties of microbubbles need to be considered. In the present study, direct measurements of the microbubble stiffness were performed using atomic force microscopy by applying nanoscale compressions (up to 25 nN/s) on size-isolated, lipid-coated microbubbles (diameter ranges of 4 to 6 μm and 6 to 8 μm). The stiffness was found to lie between 4 and 22 mN/m and to decrease exponentially with the microbubble size within the diameter range investigated. No cantilever spring constant effect was found on the measured stiffness. The Young’s modulus of the size-isolated microbubbles used in our study ranged between 0.4 and 2 MPa. Microstructures on the surface of the microbubbles were found to influence the overall microbubble elasticity. Our results indicated that more detailed theoretical models are needed to account for the size-dependent microbubble mechanical properties to accurately predict their acoustic behavior. The findings provided useful insights into guidance of cavitation-induced drug and gene delivery and could be used as part of the framework in studies on the shear stresses induced on the blood vessel walls by oscillating microbubbles.
I. Introduction
Microbubbles have been widely used as contrast agents to increase the blood backscatter in diagnostic ultrasound imaging [1]–[3]. More recently, it has been shown that microbubbles may also hold great potential for disease treatment, including oxygen delivery to hypoxic tissues [4], drug and gene delivery [5], [6], cavitation-assisted thrombolysis [7] as well as localized and transient opening of the blood–brain barrier (BBB) for targeted drug and gene delivery [8]–[10]. For many drug and gene delivery applications, the therapeutic efficacy relies on the microbubbles’ ability to transiently increase the porosity and permeability of the cell membranes and blood vessel walls. As the microbubbles circulate in the vasculature, they can expand and contract according to the applied ultrasound frequency. It has been hypothesized that the mechanical stresses applied on the vessel walls during microbubble oscillation could be one of the potential mechanisms for the transiently and reversibly increased cellular [11] and vascular [12] permeability.
Our group has previously reported that the transcranially detected inertial cavitation varied with microbubble size during focused ultrasound disruption of the BBB [13]. High-speed optical imaging findings have also indicated that the pressure threshold of microbubble fragmentation increased with the microbubble diameter [14]. It is highly possible that the cavitation response of insonated microbubbles is directly related to their mechanical properties because the encapsulation strongly affects the modulation of microbubble acoustic behavior. However, no direct experimental measurements have been performed to link microbubble mechanical properties to their cavitation threshold. However, such information is extremely useful, because microbubble stiffness can potentially be changed [i.e., through modification of its physicochemical properties such as lipid composition and poly(ethylene glycol) (PEG) chain length] to achieve, or to avoid, acoustic cavitation for controlled drug/gene delivery. In addition, knowledge of the microbubble elasticity will enable further studies of the mechanical stresses induced on the cell membranes, allowing more precise understanding of microbubble interaction with the blood vessel walls.
To date, several methods have been developed to assess the microbubble mechanical properties, including backscatter and attenuation detection [15], high-speed optical imaging [16], [17], light scattering [18], and atomic force microscopy (AFM) [19]–[21]. Backscattering and attenuation measurements can provide accurate spectral and temporal measurements of microbubble scattering [17]. High-speed optical imaging allows direct observation of the microbubble oscillatory motion [16]. Light scattering techniques offer the capability of analyzing real-time data of a single microbubble over a large number of successive acoustic pulses (i.e., microbubble evolution) [18]. However, all these techniques rely heavily on numerical models. Only AFM offers direct measurements of the mechanical parameters (i.e., stiffness) without the need for theoretical modeling [20], [21]. AFM, when combined with optical microscopy, has been successfully used to study the nano-compressional responses of cells [22], lipid unilamellar vesicles [23], polyelectrolyte multilayer microcapsules [24], [25], hollow microspheres [20], [26], and lipid- [21], [27] or polymer-coated [19], [28] microbubbles. It has been proven to provide high force and spatial resolution of the order of piconewtons and angstroms, respectively [29], [30].
In the current study, phospholipid-coated microbubbles with diameter ranges of 4 to 6 μm and 6 to 8 μm were size-isolated using the differential centrifugation technique. These size ranges were selected for investigation because of their potential clinical advantages, including longer circulation persistence [1], [31], higher contrast enhancement [1], and increased efficacy of BBB opening in mice [13], [32]. AFM was utilized to apply nanoscale compressional forces on these microbubbles in aqueous conditions to study the effect of microbubble stiffness on their stability and dynamics. With a better understanding of the microbubble stiffness in vitro, the mechanical characteristics of these contrast agents could be fine-tuned to develop microbubbles with desired cavitation properties for future diagnostic and therapeutic applications.
II. Materials and Methods
A. Materials
All phospholipids were purchased from Avanti Polar Lipids Inc. (Alabaster, AL), including 1,2-disterayol-sn-glycero-3-phosphocholine (DSPC); 1,2-disterayol-sn-glycero-3-phosphoethanolamine-N-[carboxyl(polyethlyne glycol)2000] (DSPE-PEG2000-C); and 1,2-disterayol-sn-glycero-3-phosphoethanolamine-N-[methoxy(polyethlyne glycol)2000] (DSPE-PEG2000). All phospholipids were stored in the freezer at −20°C. The perfluorobutane gas (PFB, 99 wt% purity) used for microbubble generation was obtained from FluoroMed LP (Round Rock, TX). The poly-L-lysine (PLL) was purchased from Sigma-Aldrich Co. LLC (St. Louis, MO) and stored in the freezer at −20°C. All chemicals were used as purchased without further purification.
B. Microbubble Generation and Size Isolation
Microbubbles were coated with DSPC:DSPE-PEG2000:DSPE-PEG2000-C at a molar ratio of 90:5:5. They were generated using the probe sonication method, as described elsewhere [33]. Briefly, the indicated amount of each phospholipid species was mixed and hydrated with a phosphate buffered saline (PBS) mixture (90 vol% PBS:10 vol% 1,2-propanediol:10 vol% glycerol; Sigma-Aldrich) to a final lipid concentration of 1 mg/mL. The lipid suspension was heated in a water bath at 65°C for approximately 15 min and then sonicated with a 20-kHz probe (model S-250D; Branson Ultrasonics, Danbury, CT) at 20% of its maximum power output (~19 W) to heat the lipid suspension above the DSPC main phase transition temperature (~55°C) and further disperse the lipid aggregates into small, unilamellar liposomes. PFB was introduced by flowing it over the surface of the lipid suspension. Subsequently, high-power sonication (100% of its maximum power output ~119 W) was applied to the suspension for about 10 s at the gas–liquid interface to generate microbubbles.
Microbubbles of 4 to 6 μm and 6 to 8 μm in diameter were selected using differential centrifugation in a bucket-rotor centrifuge (model GS-6; Beckman Coulter Inc., Brea, CA), as previously described [33]. A Multisizer III particle counter (Beckman Coulter Inc., Opa Locka, FL) with a 50-μm aperture was used to measure the microbubble suspension size distribution and concentration. The final size-isolated microbubble sample was stored at room temperature overnight. Bright-field images of the 4 to 6 μm microbubble suspensions were captured using an Olympus DP30BW digital camera mounted on an upright Olympus BX61 microscope (Olympus America Inc., Center Valley, PA); the images of the 6 to 8 μm microbubble suspensions were captured using an Olympus IX70 inverted microscope equipped with an Orca-R2 digital camera (Hamamatsu Photonics, Hamamatsu, Japan). All microbubble suspensions used during the study were diluted to a final concentration of 1 × 10⁸ particles/mL immediately before surface adsorption.
C. Surface Preparation
The AFM slides used were coated with PLL solution to serve as an adhesive to ensure the complete immobilization of microbubbles onto the surface. The PLL solution was prepared by dissolving PLL in filtered deionized water to a final concentration of 0.1 mg/mL. The glass slides were washed with hydrochloric acid (Sigma-Aldrich) and ethanol (Sigma-Aldrich) to ensure an even film of coating. The final film of PLL was formed by covering the slides with PLL solution for 30 min and then dried at room temperature overnight. The adsorption of microbubbles was achieved by applying 500 μL of diluted microbubble suspension to the PLL-coated slides and allowing the attachment of microbubbles to the surface via electrostatic interactions between the carboxyl PEG chains and the PLL film. Visual inspection of the microbubbles during the experiments confirmed the complete immobilization. All measurements were performed with microbubbles attached to the surface of the glass slides within the suspension.
D. Atomic Force Microscopy Force-Distance Measurements
The microbubble stiffness was determined using a BioScope Catalyst atomic force microscope (Bruker AXS Inc., Madison, WI) in combination with an Olympus IX70 inverted microscope. The Orca-R2 digital camera mounted on the microscope was used to capture optical images with a 20× objective, and the images were processed offline to determine the microbubble diameters using ImageJ software (National Institutes of Health, Bethesda, MD). Tipless nitride cantilevers (MLCT-O10, Bruker AXS Inc.) with nominal spring constants, kc, ranging between 0.03 and 0.6 N/m were used to generate the force–distance curves. Prior to measurements, the cantilever spring constant was determined automatically using the built-in thermal tuning method, and the laser beam deflection sensitivity was calibrated using the same PLL-coated hard glass surface before microbubble introduction. At least three different locations on the glass surface were randomly chosen for the deflection sensitivity calibration to account for any possible uneven PLL coating. During the measurements, special care was taken to ensure that the cantilever was positioned parallel to the slides while the microbubbles were placed entirely below the cantilever and as close to the cantilever edge as possible so that the applied force was exerted as close to the microbubble’s axis of symmetry as possible (Fig. 1). All force–distance measurements were made in the closed Z-axis loading and unloading loop to eliminate any piezo-crystal hysteresis effects [19], [28]. The total piezo-crystal scan size (approaching and retracting) was kept at approximately 1 μm and the scan rate was set at 1 Hz. Thus, the cantilever speed was kept constant at approximately 2 μm/s for all measurements. Additional measurements were made to test the effect of the scanning speed on the force–distance curves, and no significant variations were observed when the scanning speed was varied between 0.5 and 3 μm/s. At least 10 force–distance curves were acquired for each microbubble to ensure the reproducibility of the results.
Fig. 1.

Diagram showing microbubble surface structure and attachment to the glass substrate during the atomic force microscopy measurement. Tipless cantilevers with various spring constants were used for compression. The arrow shows the piezo-crystal movement direction. A continuous 1 Hz cantilever scan rate was used. (a) As the cantilever was approaching the microbubble, (b) the shell imposed a resistance to collapse, and the force exerted on the cantilever was recorded as a function of microbubble shell deformation to calculate the system spring constant. The lipid monolayer was assumed to be an elastic spring with a constant thickness of 5 nm.
E. Data Analysis
The deformation of the microbubble shell was calculated automatically using the NanoScope software (Veeco Instruments Inc., Plainview, NY) as the difference between the change in the piezo crystal displacement and the change in the cantilever deflection. Because the cantilever deflection was calibrated using a PLL-coated hard glass surface (Fig. 1), any change in the cantilever deflection could then be attributed to the microbubble deformation. The contact point was defined as the point at which the measured force increased by 2% relative to the baseline value for 10 consecutive data points [21]. Using Hooke’s Law, the applied force to the system was the product of the microbubble deformation times its effective system spring constant, ksys. A linear regression fit was applied at the beginning of the force–deformation curve (start at approximately 20 nm for a minimum of 20 data points) using Prism 5 (GraphPad Software Inc., La Jolla, CA) to obtain the gradient of the force curves, or ksys [Fig. 2(a)]. For more complex force curves that showed discontinued linear regions, the linear regression was performed for the initial linear part of the force curve before the onset of any discontinuities, jumps, or steps [Fig. 2(b)]. A minimum of 20 nm range (approximately 4 times the microbubble shell thickness) was used for the data fitting to ensure a more accurate calculation of the slope. The stiffness or the effective spring constant of the microbubble, km, could then be calculated by modeling the compression of the cantilever/ microbubble system as two springs in series [21], [28], i.e.,
Fig. 2.

Typical force–deformation curves during microbubble compression. The dashed lines are the fitted curves of the initial linear regions of the experimental data, which were associated with the effective system spring constants. Both force curves were obtained using the same cantilever with a spring constant kc = 0.03 N/m: (a) D = 5.9 μm, (b) D = 6.1 μm.
| (1) |
The final effective stiffness of the microbubble was obtained by averaging individual km values from each force–deformation curve. For microbubbles undergoing permanent deformation, the effective stiffness was determined from only the first 5 to 10 force curves, before the initiation of the shell permanent deformation.
The Young’s modulus was calculated using the relationship proposed by de Jong et al. [34], assuming the microbubble shell had a constant thickness:
| (2) |
where E is the Young’s modulus, ε is the shell thickness, and ν is the Poisson’s ratio. For our study, as a first degree approximation, the microbubble shell thickness was assumed to be 5 nm [35], and the Poisson’s ratio was assumed to be 0.499.
III. Results
A. Microbubble Formation
Microbubbles were initially generated using the probe sonication method and then size-selected using the differential centrifugation technique [33]. The probe sonication method produced an opaque milky microbubble suspension that was stable during the experimental time-frame. Fig. 3 shows the bright-field microcopy images of the phospholipid-coated microbubbles after size isolation. The insets show the number-weighted size distributions of the microbubbles as measured by the Multisizer III. The size distributions for both diameter ranges among different batches of microbubbles were statistically the same, and the number-weighted mean diameters all fell within either the 4 to 6 μm or 6 to 8 μm range (5.87 ± 1.36 and 6.60 ± 1.88 μm, respectively). Although it has previously been shown that size-isolated microbubble suspensions remained stable at 4°C for at least 2 weeks [33], all of the microbubble samples used for this study were freshly prepared within 24 h to ensure experimental consistency.
Fig. 3.
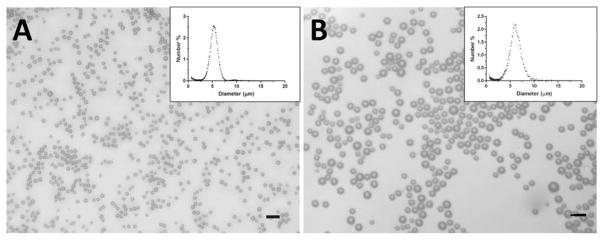
Optical microscopy images of microbubbles after size isolation using differential centrifugation technique [33]. The size distributions measured using the Multisizer III showed a mean diameter between (a) 4 and 6 μm and (b) 6 and 8 μm (inset). Scale bars correspond to 10 μm.
B. Microbubble Surface Attachment
Fig. 4 shows the typical force–deformation curves of the PLL-coated glass surface before microbubble introduction using a cantilever with a spring constant kc = 0.6 N/m. The loading curve shows an initial repulsive behavior of the system at approximately −20 to −5 nm as the cantilever was approaching the surface. The negative deformation values signify that there was a positive separation (i.e., no contact) between the cantilever and the glass surface until the deformation reached zero when contact was established. Upon contact, the force exerted on the cantilever showed a sharp increase with no measurable deformation to the surface as the cantilever continued to compress. As the cantilever retracted away from the surface (i.e., unloading), the force–deformation curve showed a small attractive force (~0.5 nN), indicating the adhesive nature of the PLL coating. Similar behavior was observed for all of the PLL-coated glass slides using cantilevers with different spring constants (data not shown). Because no notable deformation to the surface was detected before microbubble attachment, it was assumed that any measurable cantilever deflection could be attributed entirely to the microbubble deformation, rather than to the PLL coating.
Fig. 4.

Typical force–deformation curves of the poly-L-lysine (PLL)-coated glass surface without microbubble attachment using a cantilever with a spring constant kc = 0.6 N/m. No measurable surface deformation was detected. As the cantilever retracted away from the surface (i.e., unloading), the force-indentation curve showed a small attractive behavior (~0.5 nN), indicating the adhesive nature of the PLL coating.
Fig. 5 shows the representative optical images of the cantilever and microbubbles captured before and after AFM measurement. Special care was taken during the measurement to position the cantilever parallel to the glass surface and directly above the microbubble central axis [Fig. 5(a)]. It is noted that the cantilever was slightly out of focus in Fig. 5(a) to clearly indicate the location of the interrogated microbubble. The same microbubble was seen in Fig. 5(b) after cantilever compression. No significant change in the microbubble position was observed between the two images, indicating successful immobilization of the microbubble on the PLL-coated glass surface.
Fig. 5.
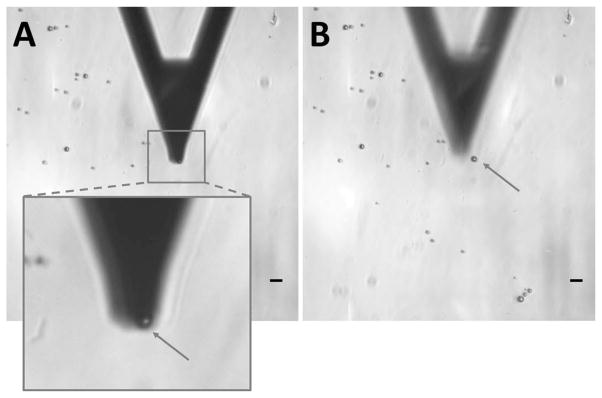
Optical microscopy images of the cantilever and microbubbles during measurement. (a) The cantilever was positioned parallel to the glass surface and directly above the microbubble poles. It is noted that the cantilever was slightly out of focus to better show the location the microbubble. (b) The same microbubble was still visible after compression. The arrows point to the same microbubble before and after measurement. Scale bars correspond to 10 μm.
C. Force Spectroscopy Measurements
Fig. 6(a) shows the typical force–deformation curves displaying no hysteresis changes upon nanoscale compression using a cantilever with a spring constant kc = 0.6 N/m. 62% of the total microbubble population investigated showed no or minimum changes of the hysteresis curves; the remaining 38% displayed notable hysteresis, as shown in Fig. 6(b). The occurrence of the hysteresis change did not depend on the microbubble diameter or the cantilever spring constant.
Fig. 6.

Representative hysteresis curves for microbubbles using cantilevers with the same spring constant (kc = 0.6 N/m). (a) Typical hysteresis curves for a microbubble (D = 5.9 μm) showing no changes between loading and unloading. (b) Typical hysteresis curves for a microbubble (D = 6.6 μm) showing changes between loading and unloading. The recorded hysteresis change may be attributed to the viscoelastic nature of the microbubble shell.
Two different types of force curve behaviors were observed in the force spectroscopy measurements, as shown in Fig. 7. Fig. 7(a) shows three examples of the first type of behavior (group 1), in which the force–deformation curves were obtained using a cantilever with a spring constant kc = 0.03 N/m. All three curves show an initial nonlinear region (typically up to 20 nm) once the cantilever established contact with the microbubbles [19]–[21]. As the contact area increased and the microbubble started to deform, the force exerted on the cantilever gradually increased until it entered a linear region in which the gradient was associated with the effective cantilever/microbubble system spring constant. More than half (54%) of the microbubbles investigated exhibited this type of force curve behavior.
Fig. 7.

Representative force–deformation curves for microbubbles using cantilevers with the same spring constant (kc = 0.03 N/m). (a) Typical force curves for microbubbles with different diameters showing a nonlinear region when contact was initially made between the cantilever and microbubble surface followed by a linear increase where the gradient was determined as the system spring constant. (b) Typical force curves for microbubbles with different diameters showing instability regions characterized by discontinuities (i.e., jumps or steps) of the linear parts of the force curves.
Fig. 7(b) shows three examples of the second type of force curve behavior (group 2), in which the force curves were acquired using cantilevers with the same spring constant as in Fig. 7(a). The behavior at the beginning of the force curves was similar to the first type for which a nonlinear region followed by a linear region was observed, indicating that sufficient contact was established between the cantilever and the microbubbles. This initial linear part gradually developed into a nonlinear region, which could be characterized by the discontinued monotonic increase of the force curves. 46% of the total microbubble population investigated exhibited this second type of behavior, regardless of the cantilever spring constant used in the compression.
The reproducibility and variability of the AFM measurements was assessed by repeatedly deforming the microbubbles and obtaining the corresponding force–deformation curves (Fig. 8). For the microbubbles that exhibited the aforementioned group 1 force curve behavior, 100% of them showed force curve behaviors that were virtually identical across consecutive compression cycles [Fig. 8(a)]. This indicated that the microbubbles not only were successfully immobilized on the glass slide surface during measurement, that they also restored their original shapes between consecutive loadings even though the compression temporarily increased the contact area between the microbubbles and the glass substrate. For the microbubbles in group 2, only a small subset (22%) exhibited a similar behavior to group 1, in which the force curves showed slight or no variability across compression cycles [Fig. 8(b)], whereas the majority of them (78%) exhibited significant variations across consecutive loadings [Fig. 8(c)]. Interestingly, the presence of an instability region was not always associated with a permanent, i.e., irreversible, shell deformation as shown in Fig. 8(d).
Fig. 8.

Representative force–deformation curves after consecutive loadings and unloadings using cantilevers with the same spring constant (kc = 0.03 N/m). (a) No variations were detected between consecutive cycles for a microbubble without any instability region (D = 3.9 μm). (b) No variations were detected between consecutive cycles for a microbubble with instability regions (D = 4.7 μm). (c) Variations were detected between consecutive cycles for a microbubble with instability regions (D = 5.3 μm). (d) Permanent deformation was detected between consecutive cycles for a microbubble with instability regions (D = 6.5 μm).
Finally, a nonlinear relationship between the microbubble stiffness and the diameter was established (Fig. 9). An exponential stiffness decrease with the microbubble size was obtained. Assuming Hooke’s Law holds for microbubbles with a constant shell thickness, the Young’s modulus was calculated using (2), see Fig. 10. A similar exponential Young’s modulus decrease with the microbubble diameter was also obtained.
Fig. 9.

Microbubble stiffness versus diameter. Optical microscopy images taken before compression were used to determine the microbubble size. An exponential decay relationship was found between microbubble stiff-ness and size. The sharp increase of the stiffness for smaller microbubbles may be attributed to the “jammed” state of the lipid molecules within the monolayer.
Fig. 10.

Calculated Young’s modulus based on the relationship proposed by de Jong et al. [34] versus microbubble diameter. The microbubble shell thickness was assumed to be 5 nm [35], and the Poisson’s ratio was assumed to be 0.499. An exponential Young’s modulus decrease was observed with microbubble size.
IV. Discussion
In this paper, the mechanics of size-isolated, lipid-coated microbubbles was investigated to study the link between microbubble mechanical properties and their cavitation characteristics. Two size classes of microbubbles with diameter ranges of 4 to 6 μm and 6 to 8 μm were isolated using the differential centrifugation technique (Fig. 3). The microbubble stiffness and Young’s modulus was calculated using the force–deformation curves measured by AFM (Figs. 1 and 2). Hysteresis changes were recorded for 38% of the microbubbles investigated (Fig. 6). Two different types of force curve behaviors were observed when microbubbles were compressed using tipless cantilevers (Figs. 7 and 8). No significant difference in the measured stiffness was found when cantilevers with various spring constants (kc ranging between 0.03 and 0.6 N/m) were used. The microbubble stiffness and Young’s modulus were found to decrease exponentially with the microbubble size (Figs. 9 and 10), providing insights to the previously reported size-dependent microbubble acoustic properties.
For intravenously injected contrast agents such as the microbubbles studied here, it is highly possible that their oscillatory motion is constrained by the vessel size [36], [37]. To model small-amplitude oscillation of microbubbles within the microvessels during sonication, a linear elastic assumption of the microbubble deformation during AFM compression was made, and the effective microbubble stiffness associated with the initial linear region of the force–deformation curves was calculated [Fig. 2(a)]. However, large amplitude oscillation of the acoustically activated microbubbles during circulation is also possible (i.e., within large blood vessels or at high acoustic pressures). Using high-speed optical imaging, Marmottant et al. [38] showed that lipid-coated microbubbles exhibited a viscoelastic nature during large amplitude oscillations. The force curves obtained for microbubbles undergoing relatively large deformations (>100 nm) during compression indicated similar viscoelastic behavior [Fig. 2(b)].
It is important to note that the stiffness measured using AFM is a characterization of the quasistatic mechanical properties of the microbubbles. The measurements were obtained at a constant 1 Hz microbubble oscillation frequency. No significant stiffness change was measured when different cantilever scan rates (ranging between 0.25 and 1.5 Hz) were tested in our study even though a weak dependence of stiffness on the loading speed was previously reported by others [27]. Because stiffness is not a time-dependent parameter, we propose that the results reported here based on the purely elastic shell assumption could be applied to study microbubble oscillation in an acoustic field. It is possible that as the microbubble insonation frequency is increased to the megahertz range (i.e., when sonicated in vivo during circulation), the dominant effect of the microbubble oscillatory response is presumably transferred from mainly elastic to mainly viscous because of the viscoelastic nature of the phospholipid shell. Similar findings have previously been reported to characterize cellular responses to oscillatory stresses [39]. Although the stiffness values determined in our study may constitute a useful parameter for understanding the microbubble response to external forces, they may not be representative of the viscoelastic behavior, especially its time-dependence, of microbubbles in vivo.
There was no significant difference among the calculated microbubble stiffnesses when cantilevers with different spring constants (kc ranging between 0.03 and 0.6 N/m) were used. Similarly, no difference in terms of the presence of instability or variability was observed among cantilevers with different spring constants. Hysteresis was observed in 38% of the microbubble population studied [Fig. 6(b)]. This may be attributed to the viscoelastic nature of the phospholipid shell. The acquired force–deformation curves obtained here (Figs. 7 and 8) are similar to those reported by Glynos et al. [20], [40], in which thin-shell hollow polymer microspheres were compressed in a similar experimental setup using AFM. Instability regions were also observed in their studies, where cantilevers with high spring constants were used to deform both the hydrogel outer layer and the polymer inner shells. It was concluded that the instability was more likely to occur at higher forces and in more compliant shells [20]. In the current study, instability areas were observed for all cantilevers used, suggesting that sufficiently large forces were applied to deform the phospholipid shells during measurements so that the effect of the cantilever spring constants on the stiffness could be ignored. In addition, the onset of instability occurred at much lower force amplitudes (~0.5 nN and above), confirming that phospholipid-shelled microbubbles were more compliant than polymer-shelled microbubbles.
It might be possible that the electrostatic interactions changed the overall shape of the microbubbles before indentation. However, any potential microbubble shape variations did not affect the stiffness calculation because we assumed that the microbubbles behaved as an elastic material (i.e., precompression deformation would not affect the calculated stiffness). In addition, the highly reproducible force–deformation curves (Fig. 8) indicated that the microbubbles returned to their original shapes upon repeated compression even though the compression probably increased the contact area between the microbubbles and the substrate temporarily. These data, in turn, suggested that the attraction between the PLL coating and the microbubbles was not strong enough to trap them in a deformed nonspherical shape.
It was noted that the measured stiffness showed relatively large variability among microbubbles within the same size range (Fig. 9). The variations observed among different microbubbles were attributed to their distinct surface microstructures [41]. Using fluorescence microscopy, it has been shown that microstructures and lateral phase separations exist in the monolayer surface of microbubbles mixed with DSPC and DSPE-PEG2000, and such differences significantly affect the mechanical and transport properties of the microbubbles in quasistatic processes [41]–[44]. It is possible that the microbubbles were immobilized on the surface with different domains exposed to the cantilever contact region during compression, which would lead to additional variations in the measured stiff-ness. Despite the fact that precautions were taken during measurements to align the center of the cantilever edge with the microbubble central axis, such procedures were still a rough approximation and an absolutely symmetric configuration could not be guaranteed. In addition, temperature variation could also have affected the measurements [27].
The calculated shell stiffness decreased exponentially with the microbubble diameter (Fig. 9). This might be linked to the molecular packing and domain formation on the microbubble monolayer surface. For smaller microbubbles, as the available surface area for domain formation decreases, it is possible that the closer packing of phospholipids in the shells with high curvatures may have led to a “jammed” state of molecules. This higher molecular ordering may provide more attractive hydrophobic and van der Waals interactions between the hydrocarbon chains, which could hindered compression, resulting in more rigid shells with increased stiffness [45]. This may have led to an increased resistance to the microbubble collapse, and therefore a decrease in the shell permeability to the gas core and longer stability. As the microbubble diameter increases, this jammed domain effect becomes less dominant, which results in a lower effective stiffness for larger microbubbles. In addition, the surface tension might be important in dictating the cavitation behavior of the microbubbles [38].
Based on simulation results, in which the attenuation and backscatter of decanted SonoVue (Bracco Diagnostics Inc., Princeton, NJ) microbubble suspensions was measured and fitted, Gorce et al. [46] reported that the effective microbubble stiffness, termed the bulk modulus, decreased exponentially with microbubble diameter. In the present study, we were able to obtain direct measurements of microbubble stiffness to confirm their findings. Interestingly, a monotonically decreasing relationship was previously reported by McKendry et al. [21] for microbubbles coated with similar lipids. However, the average microbubble stiffness at a comparable size [21] showed some discrepancies from those reported here (~2 to 3 times higher). We attribute these variations to the differences in shell phospholipid species and microbubble surface binding techniques.
The microbubble stiffness measured using AFM force spectroscopy arises as a result of a combination of the bulk modulus of the gas core and the stiffness of the lipid shell [27]. It is important to note that the contribution to the overall microbubble apparent elasticity dependence on the gas core was ignored in the present study to calculate the Young’s modulus using the relationship proposed by de Jong et al. [34]. Although such a simplifying assumption may have led to errors in the estimation of the exact values of microbubble Young’s modulus, the trends and comparisons between microbubble mechanical properties and their sizes are expected to remain unchanged.
Our group has previously shown that the peak-rarefactional pressure threshold, at which the microbubble-assisted FUS-induced BBB opening could occur, varied according to the microbubble size when a constant insonation frequency was used [13], [32]. To date, although the exact mechanism of the FUS-induced BBB opening is not yet fully understood, it is hypothesized that the threshold is related to the microbubble mechanical properties because the BBB opening has been associated with the mechanical forces applied by the oscillating microbubbles on the vessel walls [47], [48]. The mechanical effects induced by ultrasound-activated microbubbles on the microvessels have previously been observed using high-speed optical microscopy [49], [50]. In the present study, we showed that the microbubble modulus was directly linked to the size (Figs. 9 and 10), therefore providing support of the hypothesis that the microbubble mechanical properties may be linked to the previously reported microbubble size-dependent BBB opening threshold [13], [32]. We propose that the higher BBB opening threshold reported for smaller microbubbles could be attributed to their higher stiffness, providing them with a higher resistance to deform in vivo and thus causing insufficient shear stresses on the vessel walls.
Size-dependent acoustic behavior of the microbubbles has previously been reported [7], [22], [30]. Here, we utilized AFM to obtain a direct measurement of the microbubble stiffness and to study the size-dependent microbubble mechanical properties (Figs. 9 and 10), thus establishing a relationship between the microbubble mechanics and their acoustic dynamics. The measured stiffness could assist in both the theoretical modeling and experimental studies of the mechanical stresses induced on the blood vessel walls, allowing more precise understanding of the microbubble interactions with the capillaries. The slight change of the physicochemical properties of the microbubble shell was believed to cause a direct effect on the mechanical characteristics [41], [51]. The general assumption of no structural variation of the microbubble shells typically made in theoretical modeling [17], [34] may not hold for lipid microbubbles because our results indicated that microstructures on the monolayer surface could influence the overall microbubble elasticity. More detailed models are needed to account for the size-dependent mechanical properties to accurately predict the microbubble acoustic behavior. In future clinical applications, an appropriate microbubble size range with desired stiffness values might need to be predetermined to control their cavitation properties for optimized safety and therapeutic efficacy of these agents.
V. Conclusion
The mechanical properties of microbubbles are important quantities in determining their usage in diagnostic imaging and therapeutic delivery. In the present study, the stiffness and Young’s modulus of a population of size-selected (4 to 6 μm or 6 to 8 μm in diameter), phospholipid-coated microbubbles was investigated using nanoscale compression by AFM under aqueous conditions. No effect of the cantilever spring constants was found on the microbubble stiffness. Two different types of force curve behaviors were observed. An exponential stiffness decrease was found with microbubble size within the diameter ranges investigated. Microstructures on the surface of the microbubbles were found to influence the overall microbubble elasticity. The size-dependent microbubble modulus provided physical insights that are essential for characterizing and controlling cavitation in vivo. These results increase our understanding of the mechanical stresses induced to the surrounding microvessel environment by the oscillating microbubbles. Our findings also suggested that more detailed theoretical models are needed to account for the size-dependent microbubble mechanical properties to accurately predict their acoustic behavior.
Acknowledgments
This research was supported in part by National Institutes of Health grants RO1 EB009041 and RO1 AG038961. This paper was submitted for inclusion in the Special Issue on Contrast Agents and Drug Delivery but could not be included.
The authors thank Dr. Y.-S. Tung at Columbia University, Dr. M. A. Borden, Dr. S. R. Sirsi, and Dr. J. J. Kwan at University of Colorado–Boulder for their insightful discussions on the force spectroscopy data analysis.
Biographies
Cherry C. Chen received her B.S. degree in chemical and biological engineering from the Polytechnic Institute of New York University, Brooklyn, NY, in May 2007. She obtained her M.Sc. and Ph.D. degrees from the Chemical Engineering Department at Columbia University, New York, NY in May 2011. Her Ph.D. research focused on engineering novel targeted contrast agents for diagnostic ultrasound molecular imaging. She is currently pursuing postdoctoral research in the Biomedical Engineering Department of Columbia University, where her main research interests lie in the field of contrast-enhanced focused ultrasound-induced blood–brain barrier opening with targeted drug delivery in the brain.
Shih-Ying Wu received her B.S. degree in electrical engineering from the National Tsing-Hua University in Hsinchu, Taiwan, and her M.Sc. degree in biomedical electronics and bioinformatics from the National Taiwan University in Taipei, Taiwan, in 2007 and 2009, respectively. She worked as a research assistant in the Institute of Information Science at Academia Sinica in Taipei, Taiwan, from 2009 to 2011. She is currently a Ph.D. candidate in the Department of Biomedical Engineering at Columbia University. Her research interests include therapeutic ultrasound in the applications of blood–brain barrier opening and drug delivery. She is a student member of the IEEE Ultrasonics, Ferroelectrics, and Frequency Control Society.
John D. Finan graduated from University College Dublin in 2001 with a degree in mechanical engineering. He studied head injury biomechanics and cell biomechanics at Duke University, where he received his Ph.D. degree in 2010. He then moved to his current postdoctoral position at Columbia University. At Columbia, he initially focused on measuring the mechanical properties of brain tissue at high spatial and temporal resolution to create new insight into the pathology of traumatic brain injury. In 2012, he received a fellowship from the Revson Foundation to fund development of a novel therapy for brain edema.
Barclay Morrison III (M’95) received his B.S. degree in biomedical engineering from Johns Hopkins University in 1992, and his M.S.E. and Ph.D. degrees in bioengineering from The University of Pennsylvania in 1994 and 1999, respectively. He continued his academic training as a postdoctoral fellow in the Clinical Neurosciences Department at Southampton University, UK. He is currently an Associate Professor in the Department of Biomedical Engineering at Columbia University. His research focus is on the biomechanics of traumatic brain injury at the tissue level, as well as the biochemical, genomic, and molecular pathways responsible for post-traumatic cell death. He applies a quantitative approach to understanding the relationship between mechanical injury parameters and the living biological response of the injured tissue. In addition, he is developing neural electrodes which incorporate nanotechnologies to better interrogate the neuronal network function of the brain. He has published more than 50 articles in both nationally and internationally recognized peer-reviewed scientific journals, and has presented his research at both national and international conferences, including more than 25 peer-reviewed conference procedings. He serves as a council member for the International Research Council on Biomechanics of Injury and is associate editor for the Journal of Biomechanical Engineering and BMC Neuroscience. In 2001, Dr. Morrison was the recipient of the Rickard Skalak Best Paper Award given by the American Society for Mechanical Engineers for his publication in the Journal of Biomechanical Engineering and, in 2003, he received the John Paul Stapp Award for the best paper for his contribution to that year’s Stapp Car Crash Journal. More recently, he gave a keynote address at the 2009 annual conference of the International Research Council on Biomechanics of Injury. Dr. Morrison’s work has been funded by private foundations, governmental agencies, and the pharmaceutical industry.
Elisa Konofagou is Associate Professor of Biomedical Engineering and Radiology and Director of the Ultrasound and Elasticity Imaging Laboratory at Columbia University in New York City. Her main interests are in the development of novel elasticity imaging techniques and therapeutic ultrasound methods and, more notably, myocardial elastography, electromechanical and pulse wave imaging, harmonic motion imaging, and focused ultrasound therapy and drug delivery in the brain, with several clinical collaborations in the Columbia Presbyterian Medical Center and elsewhere. Elisa is a member of the IEEE in the Engineering in Medicine and Biology Society and the Ultrasonics, Ferroelectrics and Frequency Control Society, the Acoustical Society of America, and the American Institute of Ultrasound in Medicine. Prof. Konofagou is also a technical committee member of the Acoustical Society of America, the International Society of Therapeutic Ultrasound, the IEEE Engineering in Medicine and Biology Conference (EMBC), the IEEE International Ultrasonics Symposium, and the American Association of Physicists in Medicine (AAPM), as well as a former technical standards committee member of the American Institute of Ultrasound in Medicine. Elisa serves as an Associate Editor for the Medical Physics Journal, is on the Editorial Board for the Ultrasound In Medicine and Biology journal, and is a recipient of awards from the American Heart Association, the Acoustical Society of America, the American Institute of Ultrasound in Medicine, the Wallace H. Coulter foundation, the National Institutes of Health, the National Science Foundation, and the Radiological Society of North America.
Contributor Information
Cherry C. Chen, Department of Biomedical Engineering, Columbia University, New York, NY
Shih-Ying Wu, Department of Biomedical Engineering, Columbia University, New York, NY.
John D. Finan, Department of Biomedical Engineering, Columbia University, New York, NY
Barclay Morrison, III, Department of Biomedical Engineering, Columbia University, New York, NY.
Elisa E. Konofagou, Email: ek2191@columbia.edu, Department of Biomedical Engineering, Columbia University, New York, NY. Department of Radiology, Columbia University, New York, NY
References
- 1.Sirsi S, Feshitan J, Kwan J, Homma S, Borden M. Effect of microbubble size on fundamental mode high frequency ultrasound imaging in mice. Ultrasound Med Biol. 2010;36(6):935–948. doi: 10.1016/j.ultrasmedbio.2010.03.015. [DOI] [PMC free article] [PubMed] [Google Scholar]
- 2.Willmann JK, Cheng Z, Davis C, Lutz AM, Schipper ML, Nielsen CH, Gambhir SS. Targeted microbubbles for imaging tumor angiogenesis: Assessment of whole-body biodistribution with dynamic micro-PET in mice. Radiology. 2008;249(1):212–219. doi: 10.1148/radiol.2491072050. [DOI] [PMC free article] [PubMed] [Google Scholar]
- 3.Xuan JW, Bygrave M, Valiyeva F, Moussa M, Izawa JI, Bauman GS, Klibanov A, Wang F, Greenberg NM, Fenster A. Molecular targeted enhanced ultrasound imaging of flk1 reveals diagnosis and prognosis potential in a genetically engineered mouse prostate cancer model. Mol Imaging. 2009;8(4):209–220. [PubMed] [Google Scholar]
- 4.Bisazza A, Giustetto P, Rolfo A, Caniggia I, Balbis S, Guiot C, Cavalli R. Microbubble-mediated oxygen delivery to hypoxic tissues as a new therapeutic device. Conf Proc Annu Int Conf IEEE Engineering in Medicine and Biology Society. 2008:2067–2070. doi: 10.1109/IEMBS.2008.4649599. [DOI] [PubMed] [Google Scholar]
- 5.Sirsi SR, Hernandez SL, Zielinski L, Blomback H, Koubaa A, Synder M, Homma S, Kandel JJ, Yamashiro DJ, Borden MA. Polyplex-microbubble hybrids for ultrasound-guided plasmid DNA delivery to solid tumors. J Control Release. 2012;157(2):224–234. doi: 10.1016/j.jconrel.2011.09.071. [DOI] [PMC free article] [PubMed] [Google Scholar]
- 6.Wang YX, Zhou J, Zhang YR, Wang XM, Chen JA. Delivery of TFPI-2 using SonoVue and adenovirus results in the suppression of thrombosis and arterial re-stenosis. Exp Biol Med. 2010;235(9):1072–1081. doi: 10.1258/ebm.2010.010046. [DOI] [PubMed] [Google Scholar]
- 7.Porter TR. The utilization of ultrasound and microbubbles for therapy in acute coronary syndromes. Cardiovasc Res. 2009;83(4):636–642. doi: 10.1093/cvr/cvp206. [DOI] [PubMed] [Google Scholar]
- 8.Hynynen K, McDannold N, Vykhodtseva N, Raymond S, Weissleder R, Jolesz FA, Sheikov N. Focal disruption of the blood-brain barrier due to 260-kHz ultrasound bursts: A method for molecular imaging and targeted drug delivery. J Neurosurg. 2006;105(3):445–454. doi: 10.3171/jns.2006.105.3.445. [DOI] [PubMed] [Google Scholar]
- 9.Ting CY, Fan CH, Liu HL, Huang CY, Hsieh HY, Yen TC, Wei KC, Yeh CK. Concurrent blood-brain barrier opening and local drug delivery using drug-carrying microbubbles and focused ultrasound for brain glioma treatment. Biomaterials. 2012;33(2):704–712. doi: 10.1016/j.biomaterials.2011.09.096. [DOI] [PubMed] [Google Scholar]
- 10.Burgess A, Ayala-Grosso CA, Ganguly M, Jordao JF, Aubert I, Hynynen K. Targeted delivery of neural stem cells to the brain using MRI-guided focused ultrasound to disrupt the blood-brain barrier. PLOS One. 2011;6(11):art. no. e27877. doi: 10.1371/journal.pone.0027877. [DOI] [PMC free article] [PubMed] [Google Scholar]
- 11.Park J, Fan ZZ, Deng CX. Effects of shear stress cultivation on cell membrane disruption and intracellular calcium concentration in sonoporation of endothelial cells. J Biomech. 2011;44(1):164–169. doi: 10.1016/j.jbiomech.2010.09.003. [DOI] [PMC free article] [PubMed] [Google Scholar]
- 12.Yang FY, Wang HE, Lin GL, Lin HH, Wong TT. Evaluation of the increase in permeability of the blood-brain barrier during tumor progression after pulsed focused ultrasound. Int J Nanomedicine. 2012;7:723–730. doi: 10.2147/IJN.S28503. [DOI] [PMC free article] [PubMed] [Google Scholar]
- 13.Tung YS, Vlachos F, Feshitan JA, Borden MA, Konofagou EE. The mechanism of interaction between focused ultrasound and microbubbles in blood-brain barrier opening in mice. J Acoust Soc Am. 2011;130(5):3059–3067. doi: 10.1121/1.3646905. [DOI] [PMC free article] [PubMed] [Google Scholar]
- 14.Goertz DE, Wright C, Hynynen K. Contrast agent kinetics in the rabbit brain during exposure to therapeutic ultrasound. Ultrasound Med Biol. 2010;36(6):916–924. doi: 10.1016/j.ultrasmedbio.2010.03.005. [DOI] [PMC free article] [PubMed] [Google Scholar]
- 15.Sboros V, Moran CM, Pye SD, McDicken WN. The behaviour of individual contrast agent microbubbles. Ultrasound Med Biol. 2003;29(5):687–694. doi: 10.1016/s0301-5629(03)00027-9. [DOI] [PubMed] [Google Scholar]
- 16.Chomas JE, Dayton PA, May D, Allen J, Klibanov A, Ferrara K. Optical observation of contrast agent destruction. Appl Phys Lett. 2000;77(7):1056–1058. [Google Scholar]
- 17.Morgan KE, Allen JS, Dayton PA, Chomas JE, Klibanov AL, Ferrara KW. Experimental and theoretical evaluation of microbubble behavior: Effect of transmitted phase and bubble size. IEEE Trans Ultrason Ferroelectr Freq Control. 2000;47(6):1494–1509. doi: 10.1109/58.883539. [DOI] [PubMed] [Google Scholar]
- 18.Tu J, Guan JF, Qiu YY, Matula TJ. Estimating the shell parameters of SonoVue (R) microbubbles using light scattering. J Acoust Soc Am. 2009;126(6):2954–2962. doi: 10.1121/1.3242346. [DOI] [PMC free article] [PubMed] [Google Scholar]
- 19.Sboros V, Glynos E, Pye SD, Moran CM, Butler M, Ross JA, McDicken WN, Koutsos V. Nanomechanical probing of microbubbles using the atomic force microscope. Ultrasonics. 2007;46(4):349–354. doi: 10.1016/j.ultras.2007.06.004. [DOI] [PubMed] [Google Scholar]
- 20.Glynos E, Koutsos V, McDicken WN, Moran CM, Pye SD, Ross JA, Sboros V. Nanomechanics of biocompatible hollow thin-shell polymer microspheres. Langmuir. 2009;25(13):7514–7522. doi: 10.1021/la900317d. [DOI] [PubMed] [Google Scholar]
- 21.McKendry JE, Grant CA, Johnson BRG, Coletta PL, Evans JA, Evans SD. Force spectroscopy of streptavidin conjugated lipid coated microbubbles. Bubble Sci Eng Technol. 2010;2(2):48–54. [Google Scholar]
- 22.Kuznetsova TG, Starodubtseva MN, Yegorenkov NI, Chizhik SA, Zhdanov RI. Atomic force microscopy probing of cell elasticity. Micron. 2007;38(8):824–833. doi: 10.1016/j.micron.2007.06.011. [DOI] [PubMed] [Google Scholar]
- 23.Liang XM, Mao GZ, Ng KYS. Probing small unilamellar EggPC vesicles on mica surface by atomic force microscopy. Colloids Surf B Biointerfaces. 2004;34(1):41–51. doi: 10.1016/j.colsurfb.2003.10.017. [DOI] [PubMed] [Google Scholar]
- 24.Mueller R, Kohler K, Weinkamer R, Sukhorukov G, Fery A. Melting of PDADMAC/PSS capsules investigated with AFM force spectroscopy. Macromolecules. 2005;38(23):9766–9771. [Google Scholar]
- 25.Dubreuil F, Elsner N, Fery A. Elastic properties of polyelectrolyte capsules studied by atomic-force microscopy and RICM. Eur Phys J E. 2003;12(2):215–221. doi: 10.1140/epje/i2003-10056-0. [DOI] [PubMed] [Google Scholar]
- 26.Zhang L, D’Acunzi M, Kappl M, Auernhammer GK, Vollmer D, van Kats CM, van Blaaderen A. Hollow silica spheres: Synthesis and mechanical properties. Langmuir. 2009;25(5):2711–2717. doi: 10.1021/la803546r. [DOI] [PubMed] [Google Scholar]
- 27.Grant CA, McKendry JE, Evans SD. Temperature dependent stiffness and visco-elastic behaviour of lipid coated micro-bubbles using atomic force microscopy. Soft Matter. 2012;8(5):1321–1326. [Google Scholar]
- 28.Sboros V, Glynos E, Pye SD, Moran CM, Butler M, Ross J, Short R, McDicken WN, Koutsos V. Nanointerrogation of ultrasonic contrast agent microbubbles using atomic force microscopy. Ultrasound Med Biol. 2006;32(4):579–585. doi: 10.1016/j.ultrasmedbio.2005.12.016. [DOI] [PubMed] [Google Scholar]
- 29.Takano H, Kenseth JR, Wong SS, O’Brien JC, Porter MD. Chemical and biochemical analysis using scanning force microscopy. Chem Rev. 1999;99(10):2845–2890. doi: 10.1021/cr9801317. [DOI] [PubMed] [Google Scholar]
- 30.Jandt KD. Atomic force microscopy of biomaterials surfaces and interfaces. Surf Sci. 2001;491(3):303–332. [Google Scholar]
- 31.Streeter JE, Gessner R, Miles I, Dayton PA. Improving sensitivity in ultrasound molecular imaging by tailoring contrast agent size distribution: In vivo studies. Mol Imaging. 2010;9(2):87–95. [PMC free article] [PubMed] [Google Scholar]
- 32.Choi JJ, Feshitan JA, Baseri B, Wang SG, Tung YS, Borden MA, Konofagou EE. Microbubble-size dependence of focused ultrasound-induced blood-brain barrier opening in mice in vivo. IEEE Trans Biomed Eng. 2010;57(1):145–154. doi: 10.1109/TBME.2009.2034533. [DOI] [PMC free article] [PubMed] [Google Scholar]
- 33.Feshitan JA, Chen CC, Kwan JJ, Borden MA. Microbubble size isolation by differential centrifugation. J Colloid Interface Sci. 2009;329(2):316–324. doi: 10.1016/j.jcis.2008.09.066. [DOI] [PubMed] [Google Scholar]
- 34.de Jong N, Hoff L, Skotland T, Bom N. Absorption and scatter of encapsulated gas filled microspheres—Theoretical considerations and some measurements. Ultrasonics. 1992;30(2):95–103. doi: 10.1016/0041-624x(92)90041-j. [DOI] [PubMed] [Google Scholar]
- 35.Klibanov A. In: Ultrasound Contrast Agents: Development of the Field and Current Status. Krause W, editor. Vol. 222. Berlin, Germany: Springer; 2002. pp. 73–106. [Google Scholar]
- 36.Wiedemair W, Tukovic Z, Jasak H, Poulikakos D, Kurtcuoglu V. On ultrasound-induced microbubble oscillation in a capillary blood vessel and its implications for the blood-brain barrier. Phys Med Biol. 2012;57(4):1019–1045. doi: 10.1088/0031-9155/57/4/1019. [DOI] [PubMed] [Google Scholar]
- 37.Qin SP, Ferrara KW. A model for the dynamics of ultrasound contrast agents in vivo. J Acoust Soc Am. 2010;128(3):1511–1521. doi: 10.1121/1.3409476. [DOI] [PMC free article] [PubMed] [Google Scholar]
- 38.Marmottant P, van der Meer S, Emmer M, Versluis M, de Jong N, Hilgenfeldt S, Lohse D. A model for large amplitude oscillations of coated bubbles accounting for buckling and rupture. J Acoust Soc Am. 2005;118(6):3499–3505. [Google Scholar]
- 39.Canadas P, Wendling-Mansuy S, Isabey D. Frequency response of a viscoelastic tensegrity model: Structural rearrangement contribution to cell dynamics. J Biomech Eng. 2006;128(4):487–495. doi: 10.1115/1.2205867. [DOI] [PubMed] [Google Scholar]
- 40.Glynos E, Sboros V, Koutsos V. Polymeric thin shells: Measurement of elastic properties at the nanometer scale using atomic force microscopy. Mater Sci Eng B. 2009;165(3):231–234. [Google Scholar]
- 41.Borden MA, Kruse DE, Caskey CF, Zhao SK, Dayton PA, Ferrara KW. Influence of lipid shell physicochemical properties on ultrasound-induced microbubble destruction. IEEE Trans Ultrason Ferroelectr Freq Control. 2005;52(11):1992–2002. doi: 10.1109/tuffc.2005.1561668. [DOI] [PMC free article] [PubMed] [Google Scholar]
- 42.Lozano MM, Longo ML. Microbubbles coated with disaturated lipids and DSPE-PEG2000: Phase behavior, collapse transitions, and permeability. Langmuir. 2009;25(6):3705–3712. doi: 10.1021/la803774q. [DOI] [PubMed] [Google Scholar]
- 43.Borden MA, Martinez GV, Ricker J, Tsvetkova N, Longo M, Gillies RJ, Dayton PA, Ferrara KW. Lateral phase separation in lipid-coated microbubbles. Langmuir. 2006;22(9):4291–4297. doi: 10.1021/la052841v. [DOI] [PubMed] [Google Scholar]
- 44.Tanwir K, Tsoukanova V. Lateral distribution of a poly(ethylene glycol)-grafted phospholipid in phosphocholine monolayers studied by epifluorescence microscopy. Langmuir. 2008;24(24):14078–14087. doi: 10.1021/la802205y. [DOI] [PubMed] [Google Scholar]
- 45.Kwan JJ, Borden MA. Microbubble dissolution in a multigas environment. Langmuir. 2010;26(9):6542–6548. doi: 10.1021/la904088p. [DOI] [PubMed] [Google Scholar]
- 46.Gorce JM, Arditi M, Schneider M. Influence of bubble size distribution on the echogenicity of ultrasound contrast agents—A study of SonoVue. Invest Radiol. 2000;35(11):661–671. doi: 10.1097/00004424-200011000-00003. [DOI] [PubMed] [Google Scholar]
- 47.Sheikov N, McDannold N, Vykhodtseva N, Jolesz F, Hynynen K. Cellular mechanisms of the blood-brain barrier opening induced by ultrasound in presence of microbubbles. Ultrasound Med Biol. 2004;30(7):979–989. doi: 10.1016/j.ultrasmedbio.2004.04.010. [DOI] [PubMed] [Google Scholar]
- 48.Cho EE, Drazic J, Ganguly M, Stefanovic B, Hynynen K. Two-photon fluorescence microscopy study of cerebrovascular dynamics in ultrasound-induced blood-brain barrier opening. J Cereb Blood Flow Metab. 2011;31(9):1852–1862. doi: 10.1038/jcbfm.2011.59. [DOI] [PMC free article] [PubMed] [Google Scholar]
- 49.Chen H, Brayman AA, Kreider W, Bailey MR, Matula TJ. Observations of translation and jetting of ultrasound-activated microbubbles in mesenteric microvessels. Ultrasound Med Biol. 2011;37(12):2139–2148. doi: 10.1016/j.ultrasmedbio.2011.09.013. [DOI] [PMC free article] [PubMed] [Google Scholar]
- 50.Chen H, Kreider W, Brayman AA, Bailey MR, Matula TJ. Blood vessel deformations on microsecond time scales by ultrasonic cavitation. Phys Rev Lett. 2011;106(3):art. no. 034301. doi: 10.1103/PhysRevLett.106.034301. [DOI] [PMC free article] [PubMed] [Google Scholar]
- 51.Wrenn SP, Mleczko M, Schmitz G. Phospholipid-stabilized microbubbles: Influence of shell chemistry on cavitation threshold and binding to giant uni-lamellar vesicles. Appl Acoust. 2009;70(10):1313–1322. [Google Scholar]