Abstract
Objectives/Hypothesis
To determine if tumor biomarkers were predictive of outcome in a prospective cohort of patients with advanced larynx cancer treated in a phase II clinical trial.
Study Design
Prospectively collected biopsy specimens from 58 patients entered into a Phase II trial of organ preservation in advanced laryngeal cancer were evaluated for expression of a large panel of biomarkers and correlations with outcome were determined.
Methods
Tissue microarrays were constructed from pretreatment biopsies and stained for cyclin D1, CD24, EGFR, MDM2, PCNA, p53, survivin, Bcl-xL, Bcl-2, BAK, rhoC, and NFκB. Pattern of invasion and p53 mutations were assessed. Correlations with overall survival (OS), disease-specific survival (DSS), time free from indication of surgery, induction chemotherapy response, and chemoradiation response were determined. Cox models were used to assess combinations of these biomarkers.
Results
Low expression of BAK was associated with response to induction chemotherapy. Low expression of BAK and cytoplasmic NFκB was associated with chemoradiation response. Aggressive histologic growth pattern was associated with response induction chemotherapy. Expression of cyclin D1 was predictive of overall and disease-specific survival. Overexpression of EGFR was also associated with an increased risk of death from disease. Bcl-xL expression increased significantly in persistent/recurrent tumors specimens when compared to pretreatment specimens derived from the same patient (p = 0.0003).
Conclusions
Evaluation of biomarker expression in pretreatment biopsy specimens can lend important predictive and prognostic information for patients with advanced larynx cancer.
Keywords: laryngeal neoplasms, biomarkers, p53, EGFR, cyclin D1
INTRODUCTION
Over 10,000 people are diagnosed with larynx cancer in the United States each year and nearly 4,000 larynx cancer patients die each year.1 Conventional treatments that combine radical resection and radiation therapy for larynx cancers are associated with profound functional morbidity that affect quality of life. Most patients have advanced (stage III & IV) disease at the time of diagnosis. The poor cure rates and morbidity of surgical treatment prompted the development of chemotherapy trials designed to offer larynx preservation. However, the resistance of some tumors to chemotherapy and radiation limits the effectiveness of organ sparing therapy, contributes to early recurrence and death, and underscores the need to identify and overcome resistance mechanisms. Chemoradiation approaches have been unsuccessful at improving overall survival compared to primary surgery,2, 3 however, tumor response to induction chemotherapy has been predictive of patients with a favorable response to chemoradiation therapy.4
The aim of this research is to identify biomarkers that predict treatment response as well as prognosis. This approach will inform the selection of best treatment options for patients and limit unnecessary patient morbidity due to ineffective therapeutic approaches. In addition, the identification of biomarkers will lead to pathways responsible for treatment resistance and will allow future development of novel personalized approaches tailored to tumor biology.
Herein, a panel of biomarkers was evaluated to determine their predictive and prognostic significance in advanced laryngeal carcinoma patients enrolled in a prospective, single-arm, single institution Phase II study. In this trial, response to a single cycle of induction chemotherapy was used to select patients for definitive treatment with surgery and radiation versus chemoradiation.4 This study demonstrated that induction chemotherapy followed by concurrent chemoradiation in responders (laryngectomy in nonresponders) was effective for both organ sparing (71%) and survival in advanced larynx cancer with 3 year survival rates of 83%. Tissue microarrays assembled from pretreatment biopsy specimens from patients enrolled in this prospective clinical trial were used to assess biomarker expression. The panel of biomarkers to evaluate was selected based upon pathways previously implicated in head and neck carcinogenesis and treatment response.
p53 plays a central role in pathways responsible for maintaining cellular integrity. The p53 network is activated when cells are damaged or stressed. Upon activation, the p53 protein can lead to cell cycle arrest and DNA repair, or it can cause programmed cell death. 5, 6 Approximately 50% of head and neck tumors have a p53 mutation. p53 is thought to be one of the molecular determinants regulating the response to chemotherapy.
Bcl-xL is a member of the anti-apoptotic Bcl-2 protein family.7–9 Bcl-xL binds proapoptotic proteins such as BAK via the BH3 domain and prevents these proteins from initiating apoptosis at the mitochondrial membrane.9, 10 Previous work demonstrated that Bcl-xL was overexpressed in 75% of HNSCC.11 Overexpression of anti-apoptotic proteins such as Bcl-2 and Bcl-xL was frequently associated with chemotherapy and radiation resistance.7, 12
Numerous other biomarkers of interest were also evaluated for their association with clinical outcomes of interest. CD24 is a cell surface marker previously shown to be associated with poor prognosis in many other tumor types including ovarian, non-small cell lung, breast, prostate, and colorectal cancer.13–17 EGFR intensity has been shown to be a marker of poor prognosis in oropharynx and larynx cancer.18–20 MDM2, an endogenous suppressor of p53, is up-regulated with expression of functional p53.21–23 BAK is a proapoptotic cytoplasmic protein that is regulated by p53.24 Nuclear factor kappaB (NFκB) is a transcription factor that upregulates expression of genes that suppress apoptosis and genes that promote cell cycle progression in cancer cells.25 Proliferating cell nuclear antigen (PCNA) is an antigen expressed in the nucleus of proliferating cells. RhoC protein, a known marker of metastases in aggressive breast cancers and melanoma, has also been found to be overexpressed in certain head and neck cancers.26–28 Survivin is a member of the inhibitor of apoptosis (IAP) family. The survivin protein inhibits caspase activation, thereby leading to negative regulation of apoptosis or programmed cell death.29
These biomarkers were tested and evaluated for correlation with survival, disease-free survival, organ preservation, and chemotherapy response.
METHODS
Study Population(s)
Subjects for these analyses signed informed consent to participate in trial that included analysis of tissue specimens for biomarker analyses. Specimens were taken from pre-treatment biopsies and, in cases where salvage surgery was performed, during salvage surgery.
Patient demographics and outcomes of entire clinical trial
The results of the clinical trial were previously published and are summarized.4 Of 97 eligible patients, 73 (75%) achieved more than 50% response and received chemoradiotherapy. A total of 29 patients (30%) had salvage surgery; 19 patients (20%) had early salvage surgery after the single cycle of induction chemotherapy, three patients (3%) had late salvage after chemoradiotherapy, six patients (6%) eventually had salvage surgery for recurrence, and one patient had laryngectomy for chondroradionecrosis. The median follow-up time was 41.9 months. The overall survival rate at 3 years is 85%. The disease-specific survival rate was 87%. Larynx preservation was achieved in 69 patients (70%).
Tissue Microarray Construction
Formalin-fixed, paraffin-embedded pretreatment tissue samples were used for the construction of a tissue microarray (TMA) from this study. A pathologist marked representative areas of tumor and normal on hematoxylin and eosin (H&E) stained sections from each tissue block. To account for tumor heterogeneity, three 0.6 mm tumor tissue cylinders were punched from marked tumor area of each tissue block and transferred to a recipient block. Cores were also taken from adjacent normal tissues to serve as internal controls. The first TMA was fashioned from pretreatment tumor biopsy specimens. A second TMA was constructed using salvage surgical specimens.
Immunohistochemistry
A large panel of biomarkers was tested using immunohistochemistry (Table 1). The TMA slides were stained for p53 (Ab-6, clone DO-1, MS-187, 1:100, Lab Vision, Fremont, CA), Bcl-xL (Ab-2, clone 7D9, MS-1334-PO, 1:100, Lab Vision, Fremont, CA), Bcl-2 ( clone 124, undiluted, Dako, Carpinteria, CA), BAK (Upstate 06-536, 1:400, Millipore, Temecular, CA), PCNA (18-8110, 1:500, Zymed, South San Francisco, CA), CD24 (clone ML5, 1:100, BD, Franklin Lakes, NJ), EGFR (31G7, undiluted, Zymed Laboratories, South San Francisco, CA), MDM2 (1:200, stained by MD Anderson, Dr. El-Naggar), NFκB (SC-372, 1:500, Santa Cruz Biotechnologies, Santa Cruz, CA), RhoC (as previously described)30, Survivin (clone EP 2880Y, 2463-1, 1:100, Epitomics, Burlingame, CA), and cyclin D1 (clone SP4, 1:100, Lab Vision, Fremont, CA). Slides were deparaffinized, rehydrated and heated at 92°C in antigen retrieval buffer (Dako, Carpinteria, CA) for 20 minutes. After cooling to room temperature for 20 minutes, they were rinsed in PBS and incubated with peroxidase block (Dako, Carpinteria, CA) for 5 minutes followed by 1.5% horse serum (Vector Laboratories, Burlingame, CA) in PBS for 30 minutes. Primary antibody, diluted in blocking buffer, was added for 1–2 hours, washed and incubated with biotinylated anti-mouse IgG (ABC Kit, Vector Laboratories, Burlingame, CA) for 30 minutes. The slides were washed and incubated with avidin/biotin-conjugated peroxidase for 30 minutes. Color was developed with diaminobenzidine tetrahydrochloride (Sigma, Saint Louis, Missouri) and counterstained with hematoxylin. They were dehydrated and mounted. Affinity purified mouse IgG2a (Sigma, Saint Louis, Missouri) was used as a negative control.
Table I.
Biomarkers tested with immunohistochemistry.
| Intensity Scoreda | Proportion Scoredb | Percent Positive |
|---|---|---|
| BAK | BAK | |
| Bcl2 | Bcl2 | |
| BclxL | BclxL | |
| CD24 | CD24 | |
| EGFR | ||
| MDM2 | MDM2 | |
| NFκB | NFκB | |
| p53 | p53 | |
| PCNA | PCNA | |
| RhoC | ||
| Survivin | Survivin |
Intensity was scored according to the following scale: 1= none, 2= weak, 3= moderate, 4= high
Proportion was scored according to the following scale: 1= <5%, 2= 5–20%, 3= 21–50%, 4= 51–100%
Immunohistochemical Interpretation
Slides were read by a qualified head and neck pathologist who was blinded to the clinical outcomes of the patients. Each core was evaluated for the percentage of tumor cells stained on a scale of 1 to 4 with 1: <5% staining, 2: 5–20% staining, 3: 21–50% staining and 4: 51–100% staining. In a similar fashion, cores were evaluated for intensity of immunohistochemical staining according to the following scale: 1: none, 2: weak, 3: moderate and 4: strong. Some biomarkers were evaluated separately for nuclear (n) and cytoplasmic (c) staining (MDM2, NFκB) and for nuclear (n) and surface (s) staining (CD24). EGFR demonstrated only surface staining. Table I also indicates whether the biomarker results were evaluated by proportion, intensity, and/or percent positive cells (counted). PCNA was the only biomarker evaluated by percent positive cells (counted).
Pattern of Invasion
Pattern of invasion (growth pattern) was scored on H&E–stained, formalin-fixed sections according to published criteria31 by a pathologist blinded to outcome. Grading of the invasive front was classified as follows: (1) pushing borders; (2) well-formed, infiltrating cords; (3) thin, irregular, infiltrating cords; and (4) small groups and dissociated cells.
p53 Mutation Status
p53 mutation analysis was performed by amplifying exons 4–9 with polymerase chain reaction and subsequent DNA sequencing. The two broad categories of p53 mutation are mutant and wild-type. p53 mutations can be further sub-categorized as to type of mutation. These types include missense, deletion, and nonsense.
Statistical Analysis
The mean of biomarker scores across multiple cores from each subject were calculated and used for statistical analysis. All biomarkers were tested for correlations with chemotherapy response, chemo-radiation response, overall survival (OS), disease-specific survival (DSS), time to indication for surgery (TIS), and clinical covariates of interest such as age, gender, T stage, N stage, and smoking status (never/former/current smoker). Time to event outcomes were defined from date of diagnosis to date of death for overall survival (OS) and date of death from cancer for disease-specific survival (DSS). Failure of induction chemotherapy leading to surgery per protocol, failure of chemotherapy radiation, and local recurrence were considered event endpoints for time to indication for surgery (TIS).
To evaluate bivariate associations between markers and ordinal variables of interest the Spearman correlation coefficient was used. For marker associations with nominal variables, the Wilcoxon rank-sum test was employed for two-level variables, and the Kruskal-Wallis test was employed for variables with three or more levels. The Kaplan-Meier method and log-rank test were used to test for differences in the survival functions between strata defined by clinical variables.
Cox proportional hazards models were used to relate time-to-event outcomes to marker levels and other predictors. For each time-to-event outcome, three models were constructed: 1) a model with a biomarker alone, 2) a model with clinical variables alone, and 3) a model with clinical variables and the biomarker. Models 2 and 3 were used to assess the marker effects beyond the effects of clinical variables. Likelihood ratio statistics were used to compare the models.
A mixed model approach was used to determine if there are significant changes in the mean levels of expression between pretreatment and salvage specimens. Empiric estimates of the standard errors were explored to avoid bias due to within-subject variability. For verification, models with a symmetric modeling structure were run to explicitly adjust for within-subject variability in our mixed models.
All statistical analyses were done using SAS v9.232 (Carey, North Carolina). A two-tailed p-value of 0.05 or less is considered to be statistically significant. For each outcome of interest we tested 12 different biomarkers. Though all of these biomarkers are not strictly independent, we recognize that Type I error due to multiple comparisons could be an issue in our analysis and as such, results should be interpreted with caution. We estimate that it is possible for one p-value to appear significant due to random chance.
RESULTS
Sample Characteristics of the Study Group
The TMA was constructed with 58 pre-treatment specimens. The subjects who were analyzed on the TMA did not differ significantly with respect to age, T stage, N stage, clinical stage, or smoking status from those not used in the TMA analysis. Significantly more of the non-TMA subjects responded to chemotherapy (p=0.03), indicating that without all tissue from the whole study cohort, our analysis regarding associations between biomarkers and induction chemotherapy response may be biased due to missing data. Table II summarizes the sample characteristics for those that are and are not represented in the TMA analysis.
Table II.
Sample Characteristics From Subjects With and Without tissue for TMA Analysis
| Overall (n=97) |
TMA analysis (n=58) |
No TMA (n=39) |
p-value | ||
|---|---|---|---|---|---|
| Age | 58.6 | 57.4 | 60.5 | 0.11a | |
| Disease site | Glottic | 22% | 22% | 21% | |
| Supraglottic | 78% | 78% | 79% | 0.19b | |
| Stage | 3 | 46% | 45% | 49% | |
| 4 | 54% | 55% | 51% | 0.15b | |
| T | T2 | 8% | 10% | 5% | |
| T3 | 57% | 52% | 64% | ||
| T4 | 35% | 38% | 31% | 0.44c | |
| N | N0 | 55% | 52% | 59% | |
| N1 | 18% | 22% | 10% | ||
| N2 | 25% | 22% | 28% | ||
| N3 | 3% | 4% | 3% | 0.48c | |
| Smoking History | Never | 3% | 3% | 3% | |
| Past | 21% | 20% | 23% | ||
| Current | 76% | 77% | 74% | 0.91c | |
| Response to Induction Chemotherapy |
Responder | 77% | 70% | 87% | |
| Nonresponder | 23% | 30% | 13% | 0.03b | |
| 3-year overall survival estimate |
84% | 82% | 87% | 0.71d | |
t-test assuming unequal variances
Fisher Exact Test
Chi-square with Monte-Carlo estimation for errors
Log-rank test for homogeneity of survival distributions
Biomarker Descriptives
Table IIIa shows the proportion of tumor specimens that demonstrate expression of each individual biomarker according to evaluation of intensity and proportion for pretreatment and salvage specimens. Table IIIb shows the results for PCNA expression, which was evaluated as a continuous variable (percent positive cells according to cell count).
Table III.
| a. Percentage of pretreatment tumor specimens that express biomarker according to evaluation of intensity and proportion (c= cytoplasmic, n= nuclear, s=surface) | ||||
|---|---|---|---|---|
| Pretreatment | Salvage | |||
| INTENSITY | PROPORTION | INTENSITY | PROPORTION | |
| Biomarker | % positive (mean score >1) |
% positive (mean prop > 5%) |
% positive (mean score >1) |
% positive (mean prop > 5%) |
| MDM2c | 57% | 47% | ||
| MDM2n | 48% | 24% | ||
| BclxL | 95% | 77% | 95% | 95% |
| EGFR | 98% | 95% | ||
| PCNA | 93% | 90% | ||
| BAK | 100% | 98% | ||
| CD24c | 80% | 72% | ||
| CD24s | 86% | 68% | ||
| Bcl2 | 27% | 27% | ||
| NFκB | 98% | 98% | ||
| NFκBc | 98% | 98% | ||
| NFκBn | 100% | 100% | ||
| p53 | 58% | 90% | 90% | |
| cyclinD1 | 79% | 79% | ||
| Survivin | 96% | 96% | ||
| rhoC | 82% | |||
| b. PCNA was evaluated by determining cell counts to determine percent positive (pctPos, continuous variable, sd= standard deviation) | |||
|---|---|---|---|
| Biomarker | N | Mean | (sd) |
| PCNA pctPos | 56 | 41.17 | 28.2 |
Evaluation for Change in Biomarker Expression Between Pretreatment Biopsy and Salvage Surgery
Pretreatment and salvage tissue evaluations for EGFR, PCNA, p53 and Bcl-xL expression were available for analysis. There was no evidence to support a change in EGFR, PCNA or p53 expression in pretreatment versus salvage surgery specimens. There were 29 pretreatment and 33 salvage tissue cores evaluable for Bcl-xL. Repeated measures analysis revealed a statistically significant increase in Bcl-xL expression between pretreatment and salvage specimens (p=0.0003).
P-values for Associations of Evaluated Biomarkers and Outcomes
Table IV shows the p-values for each biomarker in terms of correlations with the following outcomes: overall survival, disease-specific survival, time free from indication for surgery, chemotherapy response, and chemoradiation response.
Table IV.
P-values for each marker according to outcome measure. Inten= intensity, prop = proportion, c = cytoplasmic, n = nuclear, s = surface, pctPos = percent positive, p53 mut = p53 mutation
| Marker | OS | DSS | Time Free from Indication for Surgery |
INDUCTION CHEMO RESPONSE |
CHEMO- RADIATION RESPONSE |
|---|---|---|---|---|---|
| cyclinD1 inten | 0.0008(−) | 0.0147(−) | 0.7408 | 0.616 | 0.699 |
| CD24c prop | 0.0255(+) | 0.0826(+) | 0.1817(+) | 0.837 | 0.872 |
| cyclinD1 prop | 0.0310(−) | 0.1222(−) | 0.7657 | 0.762 | 0.779 |
| CD24c inten | 0.0538(+) | 0.1825(+) | 0.5078 | 0.415 | 0.719 |
| p53mut status | 0.1045(−) | 0.5295 | 0.2518 | 0.849 | 0.341 |
| MDM2n prop | 0.1087(+) | 0.2199(+) | 0.4404 | 0.22(+) | 0.295 |
| CD24s prop | 0.1838(+) | 0.4135 | 0.3498 | 0.621 | 0.976 |
| EGFR pctPos | 0.2229(−) | 0.4465 | 0.434 | 0.869 | 0.709 |
| NFκBn inten | 0.2262(−) | 0.4866 | 0.8513 | 1.00 | 0.939 |
| CD24s inten | 0.2363(+) | 0.2331(+) | 0.1942(+) | 0.748 | 0.642 |
| p53 prop | 0.2488(+) | 0.4930 | 0.5655 | 0.569 | 0.879 |
| EGFR inten | 0.3206 | 0.0424(−) | 0.5693 | 0.741 | 0.572 |
| Growth pattern | 0.3461 | 0.2522 | 0.0557(+) | 0.177(+) | 0.253 |
| MDM2c prop | 0.3578 | 0.2972 | 0.9537 | 0.831 | 0.708 |
| Survivin inten | 0.3974 | 0.7579 | 0.5311 | 0.192 | 0.27 |
| MDM2 prop | 0.4259 | 0.3824 | 0.8631 | 0.735 | 0.742 |
| MDM2n inten | 0.4457 | 0.3289 | 0.4667 | 0.822 | 0.831 |
| Survivin prop | 0.5032 | 0.7505 | 0.405 | 0.358 | 0.277 |
| BAK inten | 0.5143 | 0.9494 | 0.0914(−) | 0.0004(−) | 0.014(−) |
| Bcl2 inten | 0.5609 | 0.7586 | 0.4516 | 0.576 | 0.969 |
| BclxL inten | 0.6636 | 0.8542 | 0.439 | 0.716 | 0.525 |
| Bcl2 prop | 0.6686 | 0.5084 | 0.6197 | 0.567 | 0.99 |
| MDM2 inten | 0.6894 | 0.3737 | 0.3545 | 0.683 | 0.375 |
| MDM2c inten | 0.7088 | 0.2836 | 0.2518 | 0.483 | 0.193(−) |
| PCNA pctPos | 0.7353 | 0.6475 | 0.3544 | 0.873 | 0.827 |
| NFκB inten | 0.7400 | 0.8040 | 0.9245 | 0.108(−) | 0.055(−) |
| NFκBc inten | 0.7401 | 0.6944 | 0.8501 | 0.068(−) | 0.033(−) |
| BclxL prop | 0.7802 | 0.5589 | 0.5931 | 0.739 | 0.183(+) |
| PCNA inten | 0.7835 | 0.8772 | 0.1752(+) | 0.31 | 0.637 |
| rhoC inten | 0.7915 | 0.2868 | 0.4797 | 0.684 | 0.949 |
| BAK prop | 0.8488 | 0.7396 | 0.4844 | 0.264 | 0.286 |
| NFκB prop | 0.9399 | 0.3991 | 0.7361 | 0.851 | 0.72 |
| NFκBc prop | 0.9572 | 0.4249 | 0.6229 | 0.293 | 0.233(−) |
| NFκBn prop | 1.0000 | 0.8829 | 0.5442 | 0.073(−) | 0.763 |
Highlighted cells indicate p-values: Red: <0.01, Yellow: 0.01–0.05, Green: 0.05–0.10, Blue: 0.10–0.25
(+)=higher values of the biomarker, p53 mutation present, or thinner/single cell growth pattern associated with improved survival or better response to therapy. (−)=higher values of the biomarker, p53 mutation present, or thinner/single cell growth pattern associated with worse survival or worse response to therapy.
Associations with Chemotherapy Response
Higher levels of mean BAK intensity were significantly associated with poorer response to induction chemotherapy (p = 0.0004, data not shown). A greater proportion (13/16, 81%) of tumors with aggressive patterns of histologic invasion (growth patterns 3, 4) responded to induction chemotherapy as compared to tumors with less aggressive patterns of invasion (growth patterns 1, 2), of which 27/39 (69%) of tumors responded. This difference, however, did not reach statistical significance (p = 0.18, Fisher Exact Test). Higher levels of nuclear NFκB proportion was associated with poorer induction chemotherapy response (p=0.03, Spearman.)
Associations with Chemoradiation Response
Higher mean intensity of BAK expression was associated with poorer induction chemotherapy and chemoradiation response (p=0.0004 and 0.014 respectively, Wilcoxon test, Figure 1A and 1B). Higher mean intensity of cytoplasmic NFκB expression was associated with poorer chemoradiation response (p=0.03, Wilcoxon), while there was no evidence to suggest the same relationship with nuclear NFκB expression (p=0.94 , Wilcoxon).
Figure 1.
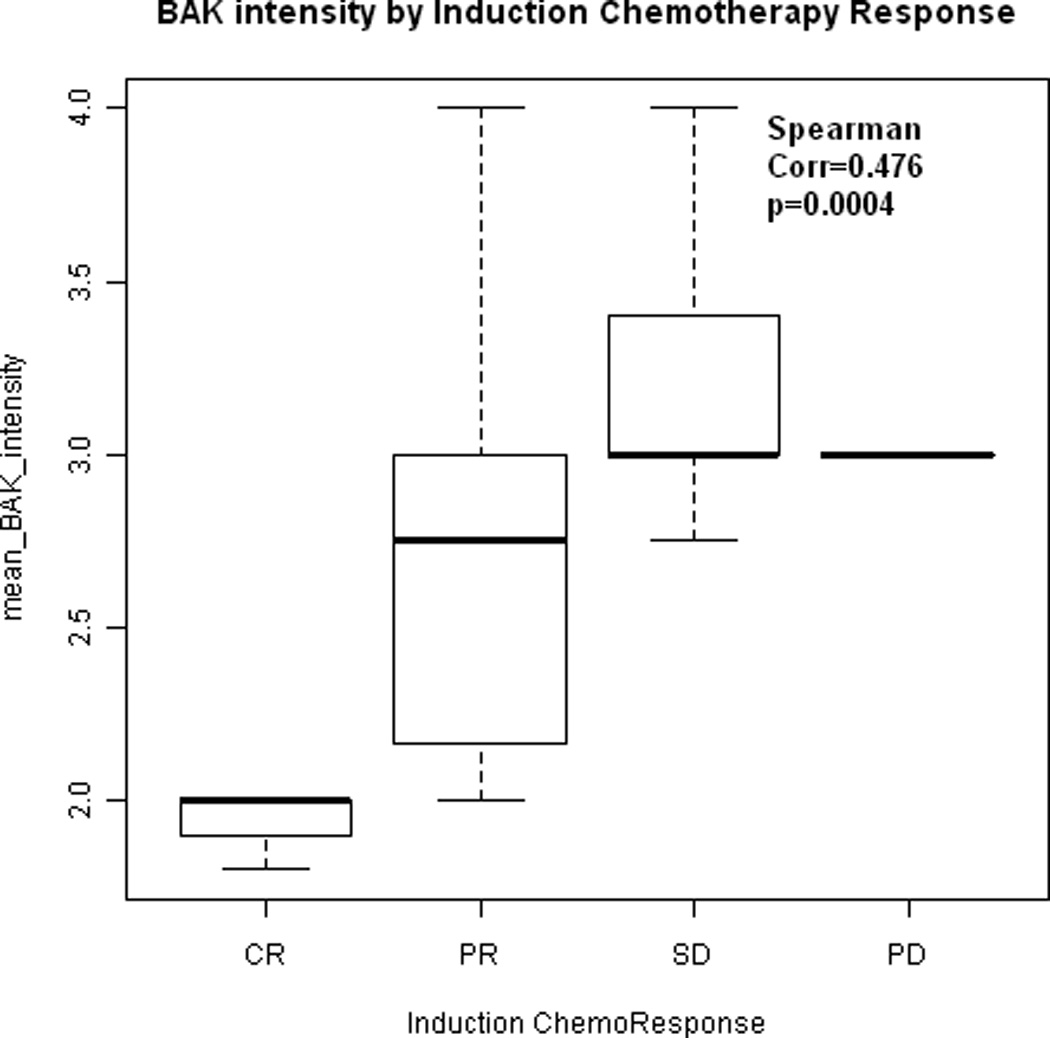
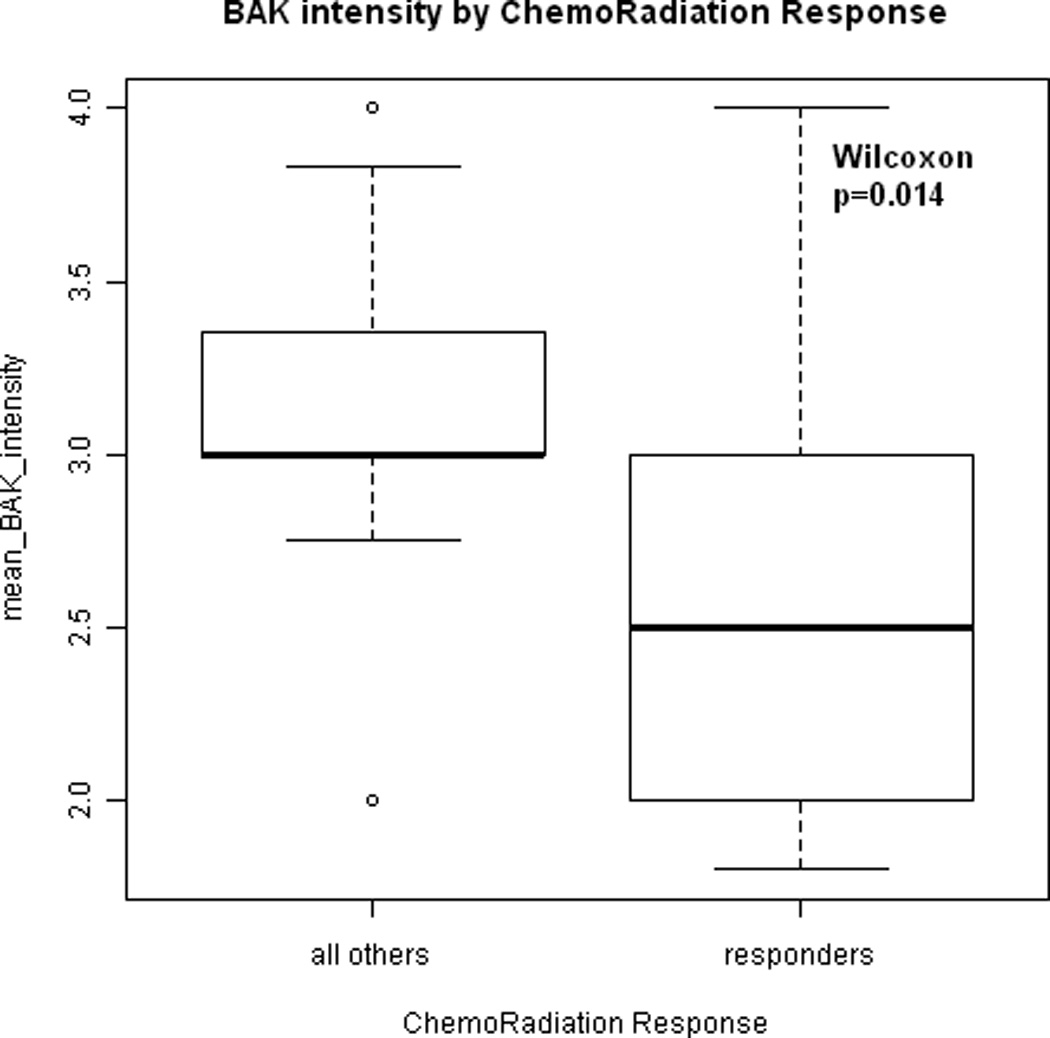
(A) Box-whisker plot indicating the association between mean BAK expression intensity and induction chemotherapy response. CR: complete response, PR: partial response, SD: stable disease, PD: progressive disease. Dots indicate the median expression. Boxes indicate the 25th and 75th quartile. Mean BAK intensity of expression increases with poorer response to induction chemotherapy (p = 0.0004). (B) Box-whisker plot indicating the association between mean BAK expression intensity and chemoradiation response. Mean BAK intensity of expression is lower in tumors that responded to chemoradiation as compared to tumors that persisted following chemotherapy and/or radiation (p = 0.014).
Associations with Overall Survival
Table V shows the biomarkers with significant associations to survival outcomes. P-values and hazard ratios were calculated from Cox proportional hazard models. Expression of cyclin D1 (intensity and proportion) and CD24 cytoplasmic expression (proportion) are the biomarkers that best predicted overall survival in this cohort and meet the criteria for significance p ≤ 0.05. Expression of cyclin D1 (intensity) was the best predictor of poorer overall survival (p= 0.0008, Figure 2A). Specifically, high cyclin D1 expression was associated with increased risk of death (HR 1.993 for cyclin D1 intensity, HR 1.562 for cyclin D1 proportion). In contrast, elevated expression cytoplasmic CD24 expression was associated with lowered risk of death (HR 0.577 for CD24 proportion, HR 0.616 for CD24 intensity).
Table V.
Biomarkers with significant association with overall survival
| Marker | total | event | P-value marker alone |
Hazard Ratio (for death) |
95% Lower Confidence Limit for Hazard Ratio |
95% Upper Confidence Limit for Hazard Ratio |
|---|---|---|---|---|---|---|
| cyclinD1_inten | 57 | 27 | 0.0008 | 1.993 | 1.33 | 2.988 |
| CD24c_prop | 50 | 24 | 0.0255 | 0.577 | 0.356 | 0.935 |
| cyclinD1_prop | 57 | 27 | 0.031 | 1.562 | 1.042 | 2.343 |
| CD24c_inten | 50 | 24 | 0.0538 | 0.616 | 0.377 | 1.008 |
Figure 2.
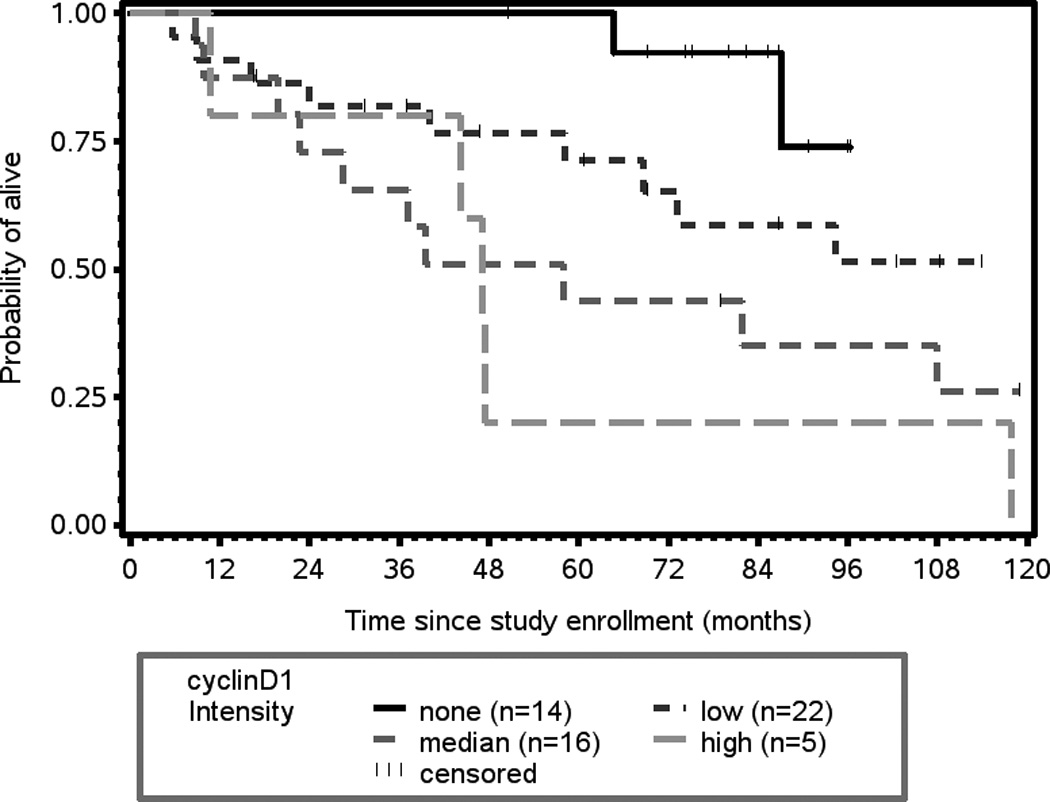
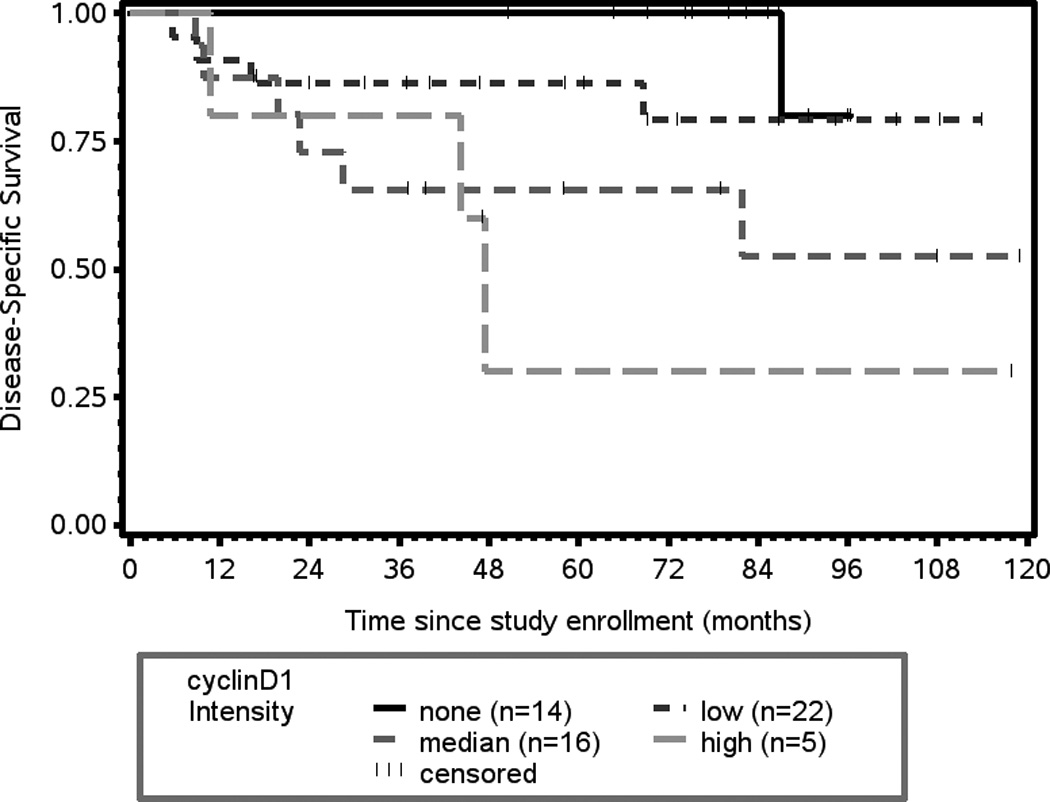
(A) Kaplan-Meier plot of cyclin D1 expression and overall survival. There is a statistically significant association between intensity of cyclin D1 expression and overall survival (p = 0.0008). (B) Kaplan-Meier plot of cyclin D1 expression and disease-specific survival. There is a statistically significant association between intensity of cyclin D1 expression and disease-free survival (p = 0.0147).
Associations with Disease-Specific Survival
Increased expression of cyclin D1 (intensity) shows the greatest association with an increased risk of death from disease (p= 0.0147, HR 1.971, 95% CI 1.143, 3.399, Figure 2B). Expression of the epidermal growth factor receptor (EGFR) was also associated with an increased risk of death from disease (p = 0.0424, HR 2.47, 95% CI 1.031, 5.917, Figure 3).
Figure 3.
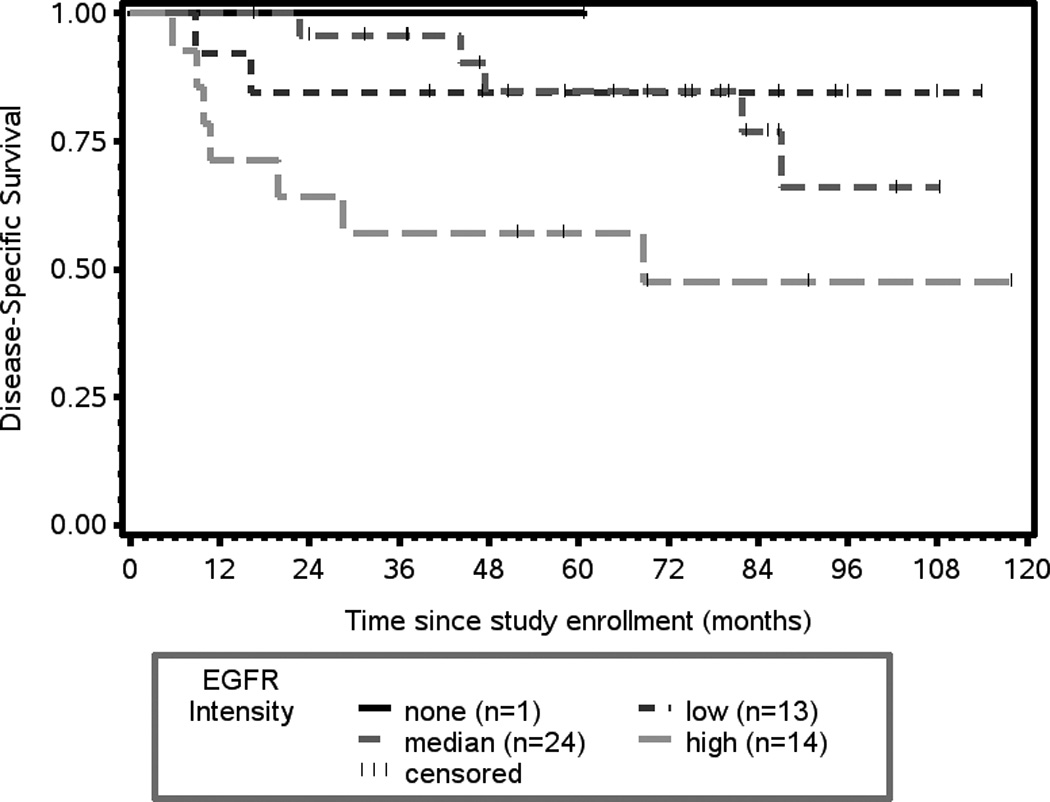
Kaplan-Meier plot of EGFR intensity of expression and disease-specific survival. There is a statistically significant association between EGFR expression and disease-specific survival (p = 0.0424).
Survival Models
Survival models controlling for stage and for induction chemotherapy response were tested to determine if adding biomarker information would be informative. The addition of cyclinD1 adds predictive information to a survival model with clinical stage alone (likelihood ratio test, p-value=0.0025), N-stage alone (likelihood ratio test, p-value=0.0028), or induction chemotherapy alone (likelihood ratio test, p-value= 0.0010). Knowing the clinical stage plus CD24 level is more predictive for overall survival than knowing clinical stage alone (likelihood ratio test, p-value=0.0340), N-stage alone (likelihood ratio test, p-value=0.0292), or induction chemotherapy alone (likelihood ratio test, p-value= 0.0052). The addition of cyclinD1 or EGFR adds predictive information to disease-specific survival models with induction chemotherapy alone (likelihood ratio tests, p-value= 0.012 for cyclinD1, p-value=0.044 for EGFR.)
Given the prognostic importance of cyclin D1 expression in determining overall and disease-specific survival, other biomarkers were tested for association with cyclin D1 expression. Cyclin D1 expression (intensity and proportion) was related to p53 mutation type. Specifically, tumors with mutant p53 status had higher proportion of cyclin D1 expression as a group (Wilcoxon test, p = 0.0177). Similarly, tumors harboring mutant p53 were more likely to have higher intensity of cyclin D1 expression (Wilcoxon test, p = 0.0553).
Association of p53 Expression and p53 Mutation Type
Tumors with missense p53 mutations were likely to have p53 overexpression whereas tumors with deletion p53 mutations were likely to not express p53 (Kruskal-Wallis, p = 0.0062, Figure 4). Tumors with nonsense mutations resulting in early termination had low levels of p53 expression on average as did tumors with wild-type p53.
Figure 4.
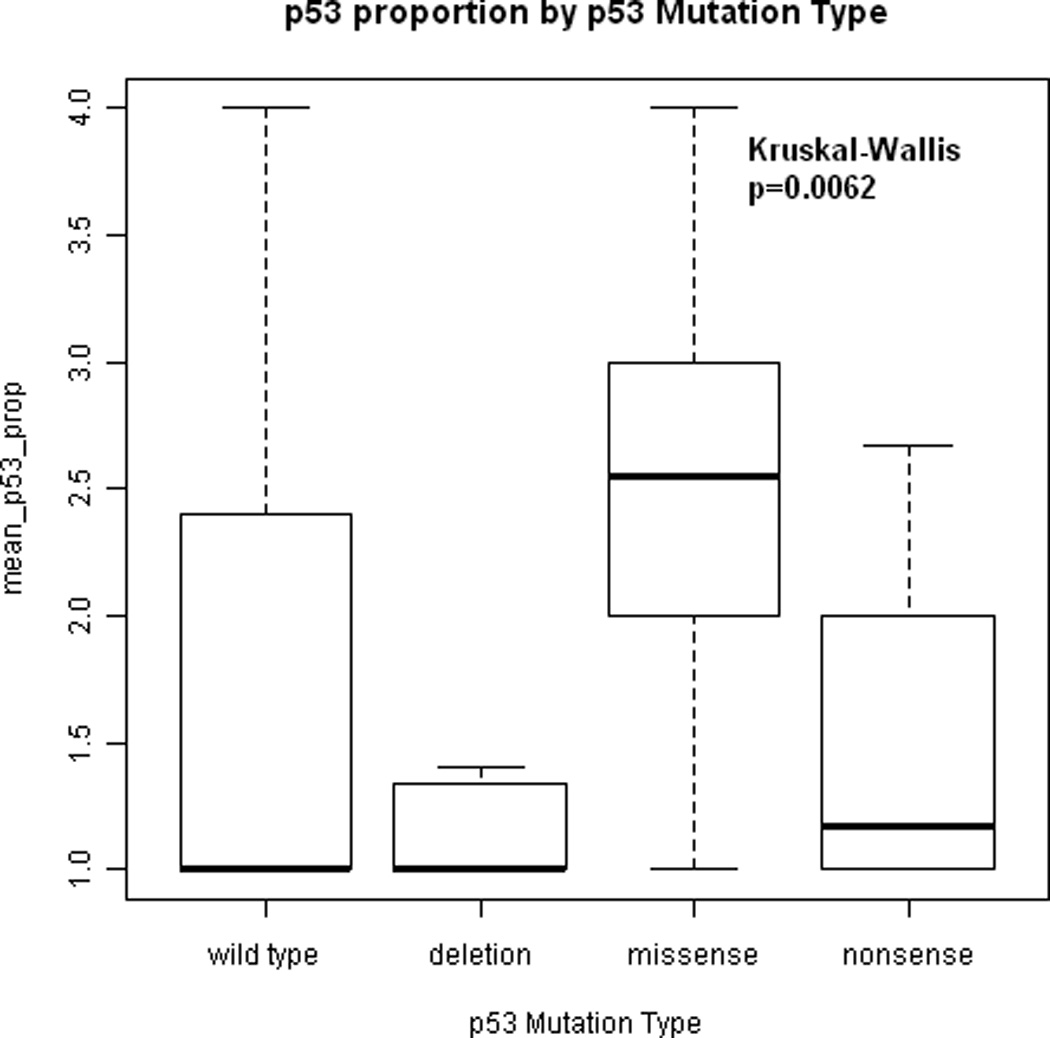
Association between proportion of tumor cells expressing p53 and p53 mutation type. Tumors with missense p53 mutations had higher levels of p53 expression than tumors with deletion p53 mutations (Kruskal-Wallis, p = 0.0062). Tumors with nonsense mutations had low levels of p53 expression on average as did tumors with wild-type p53.
Associations with Time to Indication for Surgery
Patients whose tumors showed the least aggressive invasive front (pattern 1: pushing borders) were more likely to have local relapse and require laryngectomy than patients with growth patterns 2–4 (Figure 5, p = 0.0557). Patients with thin cords (pattern 3) and single cell (pattern 4) invasive fronts were less likely to suffer relapse at the primary site (hazard ratio 0.6, 95% CI 0.321, 1.014).
Figure 5.
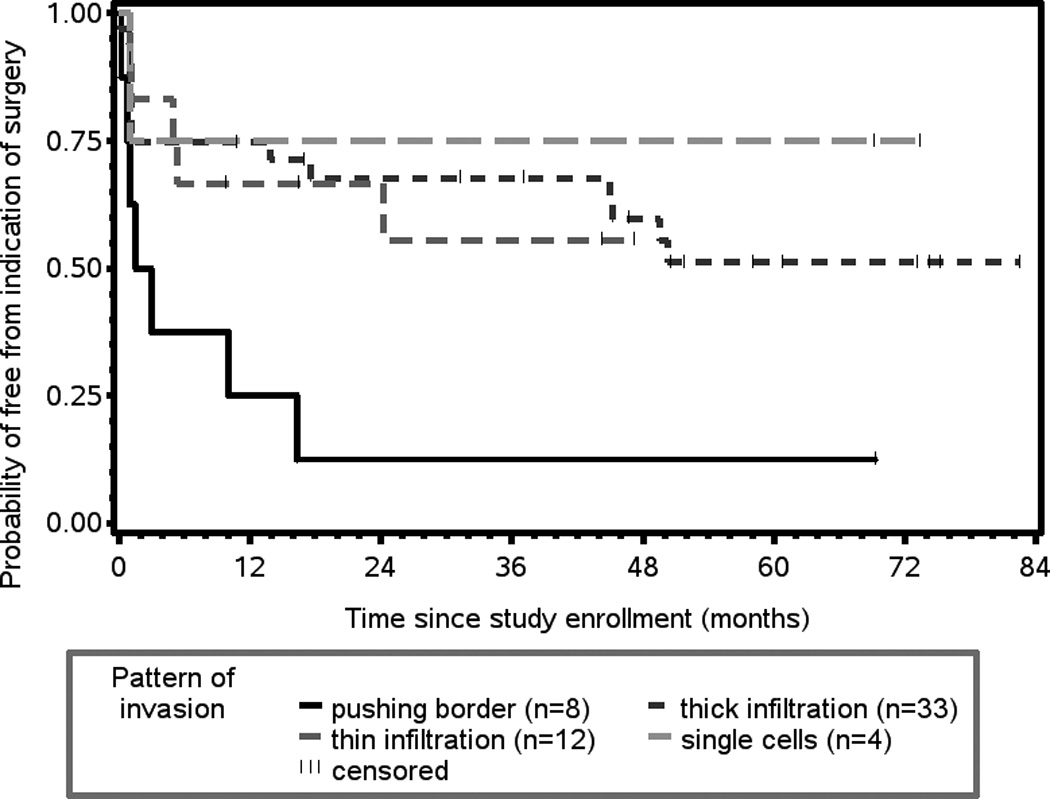
Patients whose tumors had pushing borders (pattern 1) had shorter time to indication for surgery (laryngectomy) and were more likely to have local failure than patients whose tumors had pattern 2 (thick cords), pattern 3 (thin cords) or pattern 4 (single cell) invasive fronts (p = 0.0557).
DISCUSSION
The search for biomarkers predictive of outcome that will inform treatment decision making is ongoing. Many groups have looked to biomarkers to predict which patients will be best treated surgically and which patients will be best treated with nonsurgical approaches. For these analyses to be valid, they must evaluate cohorts of patients with similar sites and stages of tumor treated in systematic ways. Biomarker evaluations that are done on patients enrolled in prospective clinical trials offer significant advantages in terms of the ability to control for site, stage, and therapeutic approach. While the ideal scenario would be to identify a single biomarker with tremendous power to predict certain outcomes, no such marker has yet been identified. This situation is likely due to the complex, multifactorial nature of tumorigenesis and progression with multiple pathways implicated.
In addition to adding valuable prognostic information beyond stage, analysis of biomarkers can enhance the identification of critical pathways that would be suitable for targeting. For example, novel agents that can target p53, NFκB, EGFR, cyclin D1, or Bcl-xL/2 might be particularly effective in specific tumors with alterations in these pathways. These considerations are the central thesis of personalized strategies for treatment of cancer and are likely to have greater impact in the very near future. The important observation that the cell survival protein, Bcl-xL, demonstrates significantly increased expression in salvage vs. pretreatment tumor specimens suggests that Bcl-xL plays an integral role in tumor resistance and might be an ideal candidate for targeting. Notably, a small molecule inhibitor of Bcl-xL is being tested in a novel clinical trial of advanced laryngeal cancer. There are many targeted therapeutics in the pipeline whose role can be better defined by biomarker-driven, prospective clinical trials.
The identification of cyclin D1 expression as a significant predictor of overall and disease-specific survival and that this biomarker has potential to add information to our traditional staging system is a discovery of significant importance.
CD24 is a novel cancer biomarker recently implicated as a poor prognostic marker in several other solid malignancies.14, 16 CD24 has been implicated as a metastasis-associated protein that has also been suggested as a stem-cell marker. The observation that cytoplasmic expression of CD24 in the present study lowered the risk of death could suggest that high risk phenotypes may respond better to chemoradiation regimens as compared to surgical regimens.
NFκB is aberrantly turned on in most head and neck squamous cell carcinomas 25 and is a key regulator of cancer cell survival.33, 34 The results presented herein provide supportive evidence that NFκB may mediate resistance to induction chemotherapy in larynx cancer.
CONCLUSIONS
Biomarkers hold promise in adding valuable prognostic information beyond stage in patient cohorts with advanced larynx cancer who are treated in a uniform fashion. Furthermore, analysis of biomarkers in larynx cancer can identify critical pathways involved in therapy resistance that can be targeted with novel agents. Only through a better understanding of the biology of treatment response and resistance can inroads be made towards determining the best treatment approach for the individual patient.
Acknowledgments
Financial Disclosure: Study supported by the University of Michigan Head and Neck Cancer SPORE (NCI P50 CA97248) and the University of Michigan Comprehensive Cancer Center Core Grant (NCI P30 CA46592). The authors have no other relevant financial disclosures.
Footnotes
Conflict of Interest: None
Manuscript presented at the Combined Triological Society Section Meetings, Miami, FL USA, February 26–28, 2012.
BIBLIOGRAPHY
- 1.Jemal A, Siegel R, Xu J, Ward E. Cancer Statistics, 2010. CA Cancer J Clin. 2010 doi: 10.3322/caac.20073. [DOI] [PubMed] [Google Scholar]
- 2.Induction chemotherapy plus radiation compared with surgery plus radiation in patients with advanced laryngeal cancer. The Department of Veterans Affairs Laryngeal Cancer Study Group. N Engl J Med. 1991;324:1685–1690. doi: 10.1056/NEJM199106133242402. [DOI] [PubMed] [Google Scholar]
- 3.Urba S, Wolf GT. Organ preservation in multimodality therapy of head and neck cancer. Hematol Oncol Clin North Am. 1991;5:713–724. [PubMed] [Google Scholar]
- 4.Urba S, Wolf G, Eisbruch A, et al. Single-cycle induction chemotherapy selects patients with advanced laryngeal cancer for combined chemoradiation: a new treatment paradigm. J Clin Oncol. 2006;24:593–598. doi: 10.1200/JCO.2005.01.2047. [DOI] [PubMed] [Google Scholar]
- 5.van Oijen MG, Slootweg PJ. Gain-of-function mutations in the tumor suppressor gene p53. Clin Cancer Res. 2000;6:2138–2145. [PubMed] [Google Scholar]
- 6.Villunger A, Michalak EM, Coultas L, et al. p53- and drug-induced apoptotic responses mediated by BH3-only proteins puma and noxa. Science. 2003;302:1036–1038. doi: 10.1126/science.1090072. [DOI] [PubMed] [Google Scholar]
- 7.Reed JC, Miyashita T, Takayama S, et al. BCL-2 family proteins: regulators of cell death involved in the pathogenesis of cancer and resistance to therapy. J Cell Biochem. 1996;60:23–32. doi: 10.1002/(SICI)1097-4644(19960101)60:1%3C23::AID-JCB5%3E3.0.CO;2-5. [DOI] [PubMed] [Google Scholar]
- 8.Chao DT, Korsmeyer SJ. BCL-2 family: regulators of cell death. Annu Rev Immunol. 1998;16:395–419. doi: 10.1146/annurev.immunol.16.1.395. [DOI] [PubMed] [Google Scholar]
- 9.Minn AJ, Rudin CM, Boise LH, Thompson CB. Expression of bcl-xL can confer a multidrug resistance phenotype. Blood. 1995;86:1903–1910. [PubMed] [Google Scholar]
- 10.Willis SN, Adams JM. Life in the balance: how BH3-only proteins induce apoptosis. Curr Opin Cell Biol. 2005;17:617–625. doi: 10.1016/j.ceb.2005.10.001. [DOI] [PMC free article] [PubMed] [Google Scholar]
- 11.Trask DK, Wolf GT, Bradford CR, et al. Expression of Bcl-2 family proteins in advanced laryngeal squamous cell carcinoma: correlation with response to chemotherapy and organ preservation. Laryngoscope. 2002;112:638–644. doi: 10.1097/00005537-200204000-00009. [DOI] [PubMed] [Google Scholar]
- 12.Adams JM, Cory S. The Bcl-2 protein family: arbiters of cell survival. Science. 1998;281:1322–1326. doi: 10.1126/science.281.5381.1322. [DOI] [PubMed] [Google Scholar]
- 13.Kristiansen G, Denkert C, Schluns K, Dahl E, Pilarsky C, Hauptmann S. CD24 is expressed in ovarian cancer and is a new independent prognostic marker of patient survival. Am J Pathol. 2002;161:1215–1221. doi: 10.1016/S0002-9440(10)64398-2. [DOI] [PMC free article] [PubMed] [Google Scholar]
- 14.Weichert W, Denkert C, Burkhardt M, et al. Cytoplasmic CD24 expression in colorectal cancer independently correlates with shortened patient survival. Clin Cancer Res. 2005;11:6574–6581. doi: 10.1158/1078-0432.CCR-05-0606. [DOI] [PubMed] [Google Scholar]
- 15.Kristiansen G, Pilarsky C, Pervan J, et al. CD24 expression is a significant predictor of PSA relapse and poor prognosis in low grade or organ confined prostate cancer. Prostate. 2004;58:183–192. doi: 10.1002/pros.10324. [DOI] [PubMed] [Google Scholar]
- 16.Kristiansen G, Schluns K, Yongwei Y, Denkert C, Dietel M, Petersen I. CD24 is an independent prognostic marker of survival in nonsmall cell lung cancer patients. Br J Cancer. 2003;88:231–236. doi: 10.1038/sj.bjc.6600702. [DOI] [PMC free article] [PubMed] [Google Scholar]
- 17.Kristiansen G, Winzer KJ, Mayordomo E, et al. CD24 expression is a new prognostic marker in breast cancer. Clin Cancer Res. 2003;9:4906–4913. [PubMed] [Google Scholar]
- 18.Kumar B, Cordell KG, Lee JS, et al. EGFR, p16, HPV Titer, Bcl-xL and p53, sex, and smoking as indicators of response to therapy and survival in oropharyngeal cancer. J Clin Oncol. 2008;26:3128–3137. doi: 10.1200/JCO.2007.12.7662. [DOI] [PMC free article] [PubMed] [Google Scholar]
- 19.Maurizi M, Almadori G, Ferrandina G, et al. Prognostic significance of epidermal growth factor receptor in laryngeal squamous cell carcinoma. Br J Cancer. 1996;74:1253–1257. doi: 10.1038/bjc.1996.525. [DOI] [PMC free article] [PubMed] [Google Scholar]
- 20.Ang KK, Berkey BA, Tu X, et al. Impact of epidermal growth factor receptor expression on survival and pattern of relapse in patients with advanced head and neck carcinoma. Cancer Res. 2002;62:7350–7356. [PubMed] [Google Scholar]
- 21.Vogelstein B, Lane D, Levine AJ. Surfing the p53 network. Nature. 2000;408:307–310. doi: 10.1038/35042675. [DOI] [PubMed] [Google Scholar]
- 22.Piette J, Neel H, Marechal V. Mdm2: keeping p53 under control. Oncogene. 1997;15:1001–1010. doi: 10.1038/sj.onc.1201432. [DOI] [PubMed] [Google Scholar]
- 23.Prives C. Signaling to p53: breaking the MDM2-p53 circuit. Cell. 1998;95:5–8. doi: 10.1016/s0092-8674(00)81774-2. [DOI] [PubMed] [Google Scholar]
- 24.Leu JI, Dumont P, Hafey M, Murphy ME, George DL. Mitochondrial p53 activates Bak and causes disruption of a Bak-Mcl1 complex. Nat Cell Biol. 2004;6:443–450. doi: 10.1038/ncb1123. [DOI] [PubMed] [Google Scholar]
- 25.Ondrey FG, Dong G, Sunwoo J, et al. Constitutive activation of transcription factors NF-(kappa)B, AP-1, and NF-IL6 in human head and neck squamous cell carcinoma cell lines that express pro-inflammatory and pro-angiogenic cytokines. Mol Carcinog. 1999;26:119–129. doi: 10.1002/(sici)1098-2744(199910)26:2<119::aid-mc6>3.0.co;2-n. [DOI] [PubMed] [Google Scholar]
- 26.Kleer CG, Griffith KA, Sabel MS, et al. RhoC-GTPase is a novel tissue biomarker associated with biologically aggressive carcinomas of the breast. Breast Cancer Res Treat. 2005;93:101–110. doi: 10.1007/s10549-005-4170-6. [DOI] [PubMed] [Google Scholar]
- 27.Islam M, Lin G, Brenner JC, et al. RhoC expression and head and neck cancer metastasis. Mol Cancer Res. 2009;7:1771–1780. doi: 10.1158/1541-7786.MCR-08-0512. [DOI] [PMC free article] [PubMed] [Google Scholar]
- 28.Boone B, Van Gele M, Lambert J, Haspeslagh M, Brochez L. The role of RhoC in growth and metastatic capacity of melanoma. J Cutan Pathol. 2009;36:629–636. doi: 10.1111/j.1600-0560.2008.01117.x. [DOI] [PubMed] [Google Scholar]
- 29.Xu JH, Wang AX, Huang HZ, Wang JG, Pan CB, Zhang B. Survivin shRNA induces caspase-3-dependent apoptosis and enhances cisplatin sensitivity in squamous cell carcinoma of the tongue. Oncol Res. 2010;18:377–385. doi: 10.3727/096504010x12644422320663. [DOI] [PubMed] [Google Scholar]
- 30.Kleer CG, Teknos TN, Islam M, et al. RhoC GTPase expression as a potential marker of lymph node metastasis in squamous cell carcinomas of the head and neck. Clin Cancer Res. 2006;12:4485–4490. doi: 10.1158/1078-0432.CCR-06-0376. [DOI] [PubMed] [Google Scholar]
- 31.Spiro RH, Guillamondegui O, Jr, Paulino AF, Huvos AG. Pattern of invasion and margin assessment in patients with oral tongue cancer. Head Neck. 1999;21:408–413. doi: 10.1002/(sici)1097-0347(199908)21:5<408::aid-hed5>3.0.co;2-e. [DOI] [PubMed] [Google Scholar]
- 32.Carey VJ. Using hypertext and the Internet for structure and management of observational studies. Stat Med. 1997;16:1667–1682. doi: 10.1002/(sici)1097-0258(19970815)16:15<1667::aid-sim602>3.0.co;2-p. [DOI] [PubMed] [Google Scholar]
- 33.Duffey DC, Chen Z, Dong G, et al. Expression of a dominant-negative mutant inhibitor-kappaBalpha of nuclear factor-kappaB in human head and neck squamous cell carcinoma inhibits survival, proinflammatory cytokine expression, and tumor growth in vivo. Cancer Res. 1999;59:3468–3474. [PubMed] [Google Scholar]
- 34.Dong G, Chen Z, Kato T, Van Waes C. The host environment promotes the constitutive activation of nuclear factor-kappaB and proinflammatory cytokine expression during metastatic tumor progression of murine squamous cell carcinoma. Cancer Res. 1999;59:3495–3504. [PubMed] [Google Scholar]


