

Abstract
Purpose.
To characterize retinal changes and assess vision after an eye-directed air blast.
Methods.
Adult C57Bl/6 mice were exposed to a blast directed at one eye. Optical coherence tomography and histology were performed to assess retina and optic nerve integrity. Cell death, oxidative stress, and glial reactivity were examined by immunohistochemistry. Visual changes were measured by ERG recordings and the optokinetic reflex.
Results.
In the outer retina, eye blast caused retinal pigment epithelium vacuoles and rare retinal detachments followed by regional cell death. Labeling for nitrotyrosine and markers of pyroptosis (caspase-1) and necroptosis (receptor-interacting protein kinases-1, -3) increased, primarily in the inner retina, after blast. Caspase-1 labeling was restricted primarily to the starburst amacrine cells. A few degenerating axons were detected at 28 days post blast. Despite a lack of substantial cell death or decreased ERG, there was a deficit in visual acuity after blast.
Conclusions.
Oxidative stress, neuroinflammation, and cell death became increasingly prevalent, over time post blast suggestive of an ongoing neurodegenerative response. Outer retinal changes either resolved or remained focal. In contrast, inner retinal changes were more robust and spread from focal regions to the entire retina over time post blast. Our model of eye blast trauma causes molecular changes and a decrease in visual acuity within the first month post blast despite a lack of overt eye injury. This subtle response matches the delayed presentation of visual deficits in some blast-exposed Veterans.
Keywords: trauma, visual deficits, cell death pathways, oxidative stress
Markers of oxidative stress and nonapoptotic cell death pathways increased over time post blast. Visual acuity decreased and the electroretinogram was altered despite a lack of overt ocular damage after blast.
Introduction
Ocular trauma is a prevalent threat to vision in both civilian and military populations; it is the fourth leading cause of blindness globally, affecting an estimated 1.5 to 2 million people per year.1 Injuries sustained from explosives are a hallmark of recent wars and are classified as primary (impact of the blast wave), secondary (impact of debris), tertiary (impact of body onto a surface), or quaternary (burns and chemical exposure).2 Damage to the optic nerve and retina, and visual deficits have been reported in Veterans with blast-induced traumatic brain injury (TBI).3–5 In one study, closed-eye injuries were detected in 45% of Veterans with mild TBI 4 months after blast despite a lack of previous eye findings.4 Ocular blast injuries are often bilateral and include hyphema, retinal detachments, retinal edema, traumatic optic neuropathy, and loss of visual field (see Ref. 6 for review).3,4,7,8
While there is a dearth of information on the cellular and molecular mechanisms of blast injury to the eye, these pathways have been explored in the brain after blast. Recent studies of TBI report a rapid elevation in oxidative stress along with early necrosis post injury.9,10 This is followed by induction of apoptosis and microglial activation suggesting a role for oxidative stress and neuroinflammation.10,11 Markers of the alternative cell death pathways, necroptosis and pyroptosis, have also been detected in models of TBI.
Necroptosis (programmed necrosis) is an active cell death pathway initiated through the TNF receptor and receptor-interacting protein kinases (RIP)-1 and -3. Cell death is caused by increasing metabolic activity and generation of reactive oxygen species (see Ref. 12 for review). Treatment with a RIP1/3 complex blocker, necrostatin-1, significantly reduced the number of necrotic nuclei in a mouse model of TBI.13
Pyroptosis (inflammation-mediated cell death) has been reported in some neurodegenerative diseases (see Ref. 14 for review), and in TBI mouse models,15,16 and patients.17 A number of different cell stress signals including extracellular ATP and mitochondria-derived reactive oxygen species activate the inflammasome. The inflammasome cleaves procaspase-1 into caspase-1, which then cleaves the proform of the inflammatory cytokines, IL-1β, and IL-18 into their mature forms.18 Blocking caspase-1 activation in a mouse model of TBI significantly reduced lesion volume and improved function.15
Our model reproduces ocular pathologies detected in patients with closed globe injuries sustained from explosive blasts or blunt force trauma (e.g., corneal edema and decreased visual acuity with an intact globe).2,19 The goal of the current study was to use this model, where an over-pressure air blast is directed at the eye,19 to investigate cell death pathways activated in the retina after blast and to monitor vision over the course of 1 month.
Materials and Methods
Animals
Three-month old C57Bl/6 mice (n = 67; The Jackson Laboratory, Bar Harbor, ME, USA) were maintained on a 12 hour light/dark cycle and provided food and water ad libitum. All procedures were approved by the Institutional Animal Care and Use Committee of Vanderbilt University and were in accordance with the ARVO Statement for the Use of Animals in Vision and Ophthalmic research.
Ocular Blast Injury
Blast was performed as previously described.19 Briefly, mice were anesthetized with ketamine/xylazine and secured within a padded housing chamber. The left eye was positioned across from the barrel of a modified paintball gun and the rest of the mouse was protected from the blast wave. Output pressure was measured prior to and following each eye blast. Mice were exposed to a single 26 psi blast that had a time to peak of 3 ms and a duration of approximately 3.7 ms. Age-matched, nonblast, or sham-blast mice were used as controls. Mice were euthanized and perfused with 4% paraformaldehyde (PFA) in PBS at 3, 7, and 28 days post blast.
Lipopolysaccharide (LPS) Injections
Adult mice were injected intravitreally with either PBS or 250 ng LPS. After 6 hours, mice were euthanized and eyes were collected for analysis.20
Ultra-High Resolution Optical Coherence Tomography (OCT)
Mice (n = 16) were anesthetized with ketamine/xylazine, wrapped in gauze, and placed in a holder with their heads stabilized by a bite bar. Eyes were dilated with 1% tropicamide (Akorn, Lake Forest, IL, USA) and kept moist with Systane ultra drops (Novartis, Basel, Switzerland). Retinas were imaged with an ultra-high resolution spectral-domain OCT system and mouse retinal bore (Bioptigen, Durham, NC, USA). Measurements were made using digital calipers.
Visual Acuity
Photopic spatial frequency thresholds (i.e., visual acuity) were assessed by optokinetic nystagmus (OKN) using an OptoMotry system (Cerebral Mechanics, Lethbridge, AB, Canada) in awake mice (n = 15) at baseline, 3, 7, 14, and 28 days post blast or after sham blast (exposed to anesthesia, but not blast, n = 10). A step-wise, masked paradigm was used. Mice were acclimated to the testing chamber for 5 minutes prior to the initiation of each test. The speed of sinusoidal grating rotation and contrast were maintained at 0.042 c/d and 100%, respectively.
Flash ERG
Flash ERGs were performed at baseline and 28 days post blast in mice dark-adapted overnight, anesthetized with ketamine/xylazine, dilated with 1% tropicamide, and placed on a heated mouse platform within the Ganzfeld dome of a Diagnosys LLC Espion Electrophysiology system (Lowell, MA, USA). Mice were exposed to flashes of light ranging from −2 to 2.88 log cd*s/m2 with a flash frequency of 2000 Hz. For flashes below −1 log cd*s/m2, the inter sweep delay was 10 seconds, for the −1 log cd*s/m2 flash it was 15 seconds, and for all remaining flashes, the delay was 20 seconds. Oscillatory potentials were measured at 3 log cd*s/m2 sampled at 2000 Hz with an inter sweep delay of 15 seconds. Amplitudes were measured from baseline to peak.
Eye Histology
Eyes (n = 7) were immersed in 4% PFA and 0.5% glutaraldehyde, bisected, and embedded in resin. One-micron thick sections were collected using a Reichert-Jung Ultracut E Leica microtome (Vienna, Austria) and stained with 1% toluidine blue. Representative images were collected on an Olympus Provis AX70 microscope (Olympus, Center Valley, PA, USA) with a ×60 oil objective lens. Pyknotic nuclei were identified by darker staining with toluidine blue. The number of pyknotic nuclei in the outer nuclear layer (ONL) or inner nuclear layer (INL) was quantified within 1 to 4 sections of retina through the middle of each eye.
Optic Nerve Histology
Optic nerves (n = 15) were preserved in 4% PFA and 0.5% glutaraldehyde, postfixed in 1% osmium tetroxide in 0.1 M cacodylate buffer, dehydrated in a graded ethanol series, dehydrated in propylene oxide, and embedded in Spurr's resin (Electron Microscopy Sciences, Hatfield, PA, USA). One-micron thick sections were collected using the Leica microtome and stained with 1% p-phenylenediamine in 50% methanol (Sigma-Aldrich Corp., St. Louis, MO, USA). Sections were imaged on an Olympus Provis AX70 microscope using a ×100 oil immersion objective lens.
Immunohistochemistry
Eyes were preserved in 4% PFA (n = 56), cryoprotected in 30% sucrose overnight at 4°C and embedded in Tissue Freezing Medium (Triangle Biomedical, Durham, NC, USA). Ten-micron thick sections were collected in round on a cryostat (Fisher, Pittsburgh, PA, USA) such that each slide contained representative sections from the entire eye. Slides were rinsed with PBS and incubated at room temperature in normal donkey serum (NDS; 1:20) in 0.1 M phosphate buffer with 0.5% bovine serum albumin and 0.1% Triton X-100 (phosphate buffer plus Triton X-100 [PBT]) for 2 hours. The slides were incubated overnight at 4°C in primary antibody in PBT (Table), then rinsed with PBS and incubated in the appropriate fluorophore-conjugated secondary antibody (donkey anti-rabbit or mouse-Alexa Fluor 488, 568, or 594; Life Technologies, Carlsbad, CA, USA) for 2 hours at room temperature. Slides were rinsed with PBS, mounted in Vectashield Mounting medium with 4′,6-diamidino-2-phenylindole dihydrochloride (DAPI; Vector Laboratories, Burlingame, CA, USA), and imaged on a Nikon Eclipse epifluorescence microscope (Nikon, Melville, NY, USA) or an Olympus FV-1000 confocal microscope (Olympus). Additional slides were labeled for TUNEL with the Milipore Apoptag Detection Kit (Darmstadt, Germany), adhering to the manufacturer's protocol. Slides were mounted with Vectashield Mounting Medium with DAPI and imaged on the Nikon microscope. Images were collected from affected and unaffected regions and therefore were not necessarily from the same eccentricity, thus, retina thickness may vary but the magnification, gain, and exposure settings were held constant.
Table.
Antibodies Used in This Study
|
Antigen |
Dilution |
Manufacturer |
Catalog # |
| Caspase-1 | 1:100 | Millipore, Billerica, MA | AB1871 |
| Caspase-3 | 1:10 | Abcam, Cambridge, MA | ab4051 |
| Choline acetyltransferase | 1:25 | Abcam | ab34419 |
| GFAP | 1:400 | Dako, Carpinteria, CA | Z0334 |
| Iba1 | 1:500 | Wako, Richmond, VA | 019-19741 |
| Nitrotyrosine | 1:500 | Millipore | 06-284 |
| RIP1 | 1:100 | Santa Cruz, Santa Cruz, CA | sc-7881 |
| RIP3 | 1:100 | Santa Cruz | sc-47364 |
| Tyrosine hydroxylase | 1:500 | Abcam | ab76442 |
TUNEL Quantification
The number of TUNEL-positive cells within each retinal layer was quantified and the length of the region in the sections with TUNEL-positive cells (affected region) was measured using NIS Elements Advanced Research software (Nikon). The total length of each section with TUNEL-positive cells (affected section) was measured. In order to determine the percentage of the retina with cell death, the lengths of all sections on the slide were measured and summed. The sum of affected region lengths was divided by the total length of all sections and multiplied by 100 to yield the percentage of retina with TUNEL-positive cells.
Statistical Analysis
Visual acuity and ERG data were analyzed using Prism software (Graphpad, San Diego, CA, USA). The means ± SEM were presented for each data set. A one-way ANOVA with a Bonferroni post hoc test was used to analyze the visual acuity. A Student's t-test was used to compare baseline and 28-day ERG responses.
Results
Blast Can Cause Retinal Detachments
Since trauma-induced injuries occur in focal areas in the central and midperipheral retina,6,21–23 we repositioned the eye during OCT imaging in order to visualize the peripheral retina. The majority of the retina looked normal at all time-points (Fig. 1A). However, disruption of the outer segments (as determined by a bright area on the fundus and b-scan) was occasionally detected within the midperiphery at 7 days post blast (n = 8; Fig. 1B). Most disruptions resolved over time; one was detectable at both 14 (n = 13) and 28 days (n = 12) post blast. Retinal detachments were rarely detected at all time-points and, when present, were small, having an average height of 0.02 mm ± 0.003 (Fig. 1C).
Figure 1.

Ocular trauma induces retinal detachments and outer segment damage. Prior to blast, the retinas appear normal (A). The green lines in the retinal surface images (A2–C2) denote the location of the b-scan images (A1–C1). Outer segment disruption in the midperipheral retina 7 days post injury (B1) appears as a patchy white area in the fundus scan ([B2], red box). A small retinal detachment in the midperipheral retina 28 days post injury (C1) appears as a small shadow in the fundus image ([C2], red box).
Blast Causes Rare Corneal Edema
We previously reported that a small subset of mice develop corneal edema after blast.19 Here, we show histologic evidence of stromal edema, vacuoles in the corneal endothelium, and disruption of the epithelium (Figs. 2C, 2E). Turnover of epithelial cells as detected by TUNEL did not exceed that of healthy controls at 7 (n = 4) and 28 days (n = 9) (Figs. 2B, 2D, 2F), with the exception of 1 to 2 eyes (data not shown).
Figure 2.
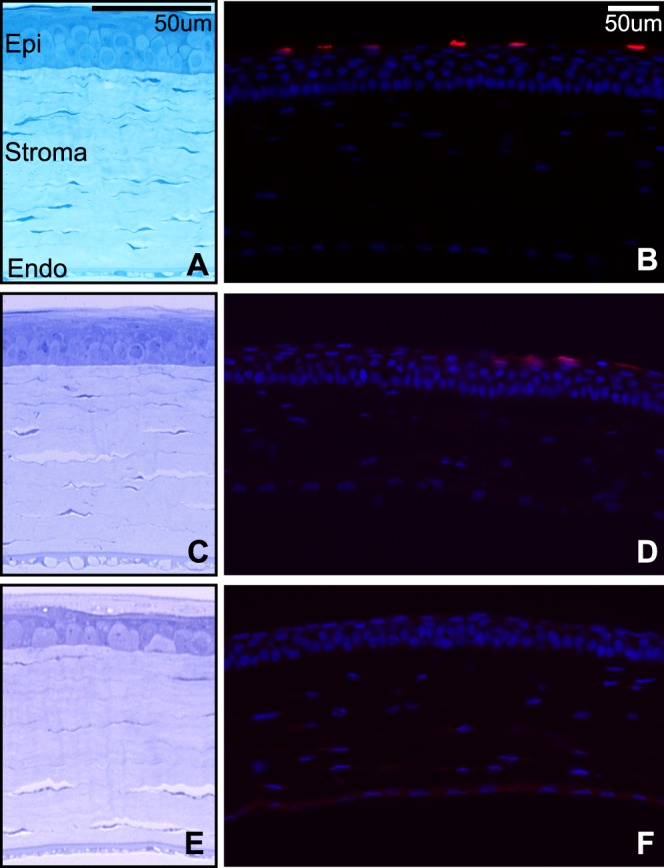
(A, C, E) Brightfield micrographs of control (A), 7- (C), and 28-day (E) postblast corneas. (B, D, F) Epifluorescence micrographs of TUNEL (red) and DAPI (blue) in control (B), 7- (D), and 28-day (F) postblast corneas. Epi, epithelium; Endo, endothelium.
Blast Damages the Neural Retina, RPE, and Optic Nerve
Focal damage was detected in all eyes at 7 (n = 3) and 28 days (n = 4) post blast (Fig. 3). Control retinas (n = 3) had 0.17 ± 0.39 pyknotic nuclei total as compared with 2 ± 1 in the ONL and 2 ± 2 in the INL at 7 days after blast (Figs. 3C, 3D). This increased to 15 ± 12 pyknotic nuclei in the ONL and 7 ± 4 in the INL at 28 days after blast (Figs. 3E, 3F). In control retinas, RPE vacuoles were nonexistent (Fig. 3B, inset). In contrast, small, frequent RPE vacuoles were observed in all eyes at 7-days post injury (Fig. 3D, inset). At 28 days after blast, RPE vacuoles were rare (Fig. 3F, inset). The axons of the optic nerve retained a clear axoplasm and tight myelin comparable with controls (Fig. 3G) until 28 days post blast when a few degenerating axons, as determined by dark staining due to collapsed myelin,24,25 were present in 3 of 5 optic nerves (Fig. 3H).
Figure 3.
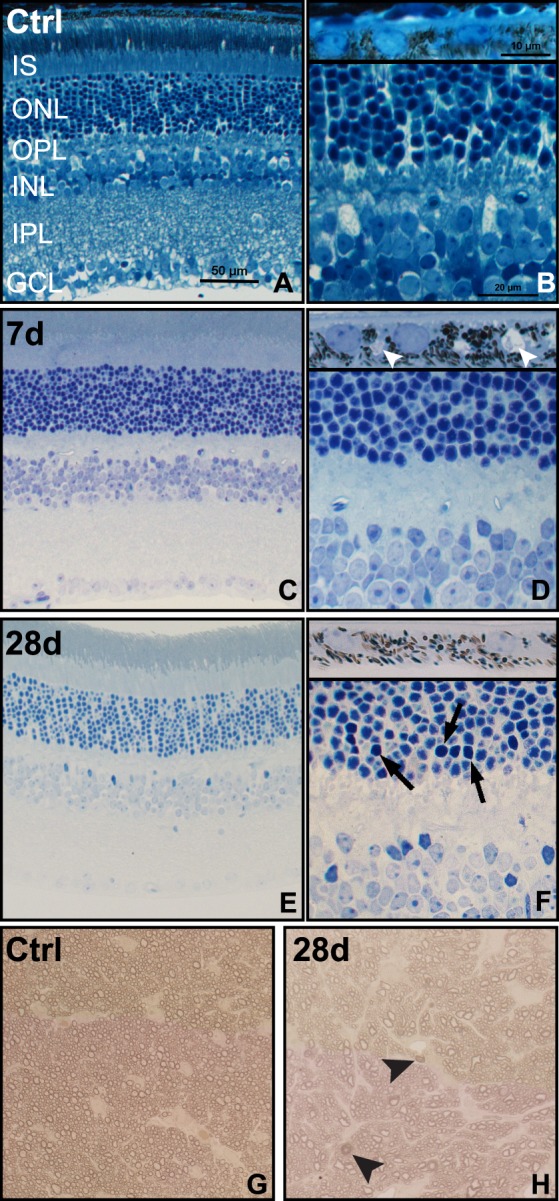
Brightfield micrographs reveal pyknotic nuclei, RPE vacuoles and axonal degeneration after blast. (A, B) Control (Ctrl) retina and RPE ([B], inset). (C, D) Seven-day postblast retina and RPE ([D], inset), small arrowheads indicate RPE vacuoles. (E–F) Twenty-eight-day postinjury retina and RPE ([F], inset), arrows indicate pyknotic nuclei. (G, H) Control (G) and 28-day postblast (H) optic nerves, arrowheads indicate degenerating axons.
Blast Causes Focal, Delayed Cell Death in a Subset of Mice
All retinal sections were TUNEL-negative in control and in 3- (n = 6) and 7-day (n = 4) postblast retinas. At 28 days post injury (n = 9), 44% of blast eyes contained TUNEL-positive nuclei in 3 ± 2% of the retina. Affected regions were primarily located in the midperipheral retina and occasionally in the central retina (Figs. 4A, 4B). The affected regions contained 143 ± 78 TUNEL-positive nuclei, while the average number per millimeter total retina was 4 ± 3. The majority of TUNEL-positive nuclei were located in the ONL (92%), 8% were present in the INL, and none were detected in the ganglion cell layer (GCL). TdT-dUTP terminal nick-end labeling staining filled complete cell bodies or appeared fragmented and diffuse in the cytoplasm of individual cells (Fig. 4D) as has been reported by other models.26 Adjacent regions were TUNEL-negative (Fig. 4E).
Figure 4.
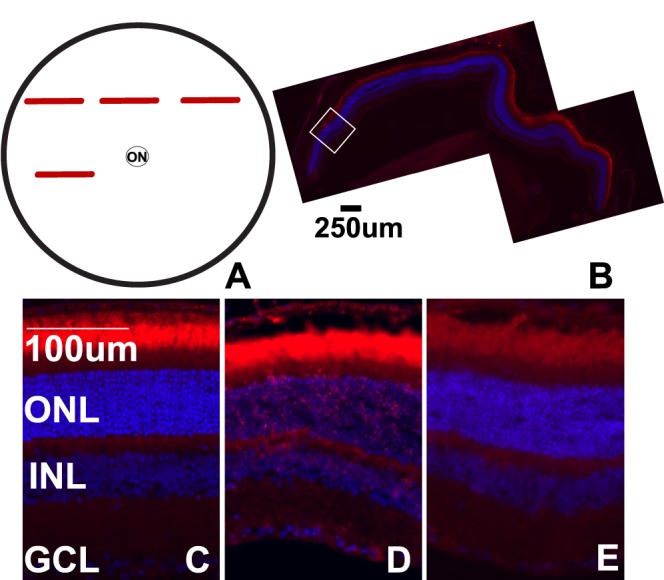
Cell death post blast is focal. (A) Schematic of a flat-mount view of the retina, red bars indicate regions within retinal cross-sections that are TUNEL-positive. (B) Epifluorescence micrograph of a TUNEL-positive midperipheral retinal cross-section from a 28-day postblast eye. The white box indicates an area of TUNEL-positive cells. (C–E) Representative epifluorescence micrographs of retinas from control (C), or 28-day postblast retinas labeled with TUNEL (red) and DAPI (blue). Affected (D) and unaffected (E) retinal regions from the same blast eye are shown. ON, optic nerve.
Blast Causes Nonapoptotic Cell Death
There were only a few cleaved caspase-3–positive nuclei, even in regions with numerous TUNEL-positive cells (data not shown). In contrast, notable changes in RIP1 and RIP3 and caspase-1 were detected after blast.
At all time points post blast, changes in RIP1 and RIP3 immunolabeling were restricted to two to three sections in the midperipheral and sometimes central retina, consistent with the localization and extent of TUNEL labeling. Antibody specificity was confirmed by Western blot analysis (data not shown) and immunolabeling of retinas from buffer or LPS-injected eyes (Fig. 5B). At 3 days post injury (n = 4), prior to detection of cell death, there was a strong increase in RIP1 staining within the Müller glia and IPL and a reduction in RIP3 labeling, as compared with controls (Figs. 5A, 5C). At 28 days after blast (n = 5) when cell death was present, RIP1 labeling was slightly elevated while RIP3 labeling appeared to increase above control levels in the IPL and INL (Fig. 5D). Receptor-interacting protein kinases 3 labeling was also present in the ONL at 28 days post blast (Fig. 5D).
Figure 5.

Increased labeling of cell death pathway markers after blast. (A–C) Confocal micrographs of RIP1 (green) and RIP3 (red) immunolabeling in control (A), LPS-injected (B), and affected regions of 3- (C) and 28-day (D) postblast retinas. (E–I) Epifluorescence micrographs show caspase-1 immunolabeling (green) in control (E), LPS-injected (F), and affected areas (midperiphery) of 3- (G) and 7- (H) day postblast retinas. The entire retina was positive at 28 days post blast (I). (J, K) Epifluorescence micrographs of caspase-1 (green) and ChAT (red, [J]) or TH (red, [K]) double-labeling, arrows indicate caspase-1 positive nuclei. DAPI-labeled nuclei (blue).
No caspase-1 labeling was detected in control retinas (Fig. 5E), but positive cells were detected in inner retinal neurons throughout the retinas of LPS-injected eyes (Fig. 5F). A few caspase-1 labeled cells were present in the inner portion of the INL in one of four retinas at 3 days after blast. Positive cells were restricted to small regions, primarily in the midperipheral retina (Fig. 5G). Caspase-1–positive cells were present throughout the GCL in two of three retinas at 7 days post injury (Fig. 5H). At 28 days post injury, caspase-1–positive cells were present throughout the retina in the inner portion of the INL and occasionally in the GCL in four of five eyes (Fig. 5I). The density of caspase-1–positive cells was much higher at 28 days than at 3 or 7 days post blast. Double-labeling with choline acetyltransferase (ChAT) revealed colocalization in the majority of cells (Fig. 5J). There was no colocalization of caspase-1 with tyrosine hydroxylase (TH), a marker of dopaminergic amacrine cells (Fig. 5K).
Blast Causes Glial Reactivity
Glial fibrillary acidic protein (GFAP) labeling was similar to controls at all time points post blast (Figs. 6A–D). In the healthy retina and in unaffected regions of the blast retinas, microglia had a typical ramified appearance and small cell body, and their localization was restricted to the inner retina (Fig. 6E). Within small regions in the midperipheral and, occasionally, central retina of 3 (n = 6) and 7 (n = 4) day postblast retinas, the microglia exhibited shorter processes and larger cell bodies, indicative of a more reactive state (Figs. 6F, 6G). At 28 days (n = 5) after blast, the microglia were amoeboid in appearance and were detected in the ONL (Fig. 6H).
Figure 6.

Microglia, but not Müller glia, become reactive in response to blast in focal regions of the retina. (A–D) Epifluorescence micrographs of GFAP immunolabeling (green) in control (A) and in 3- (B), 7- (C), and 28- (D) day postblast retinas. (E–H) Iba-1 immunolabeling (green) of microglia in control (E), 3- (F), 7- (G), and 28- (H) day postblast retinas. Insets show higher magnification of representative microglia. DAPI-labeled nuclei (blue).
Protein Nitration Increases After Blast
Light nitrotyrosine immunolabeling was present in the healthy retina (Fig. 7A) and labeling was brighter in retinas from LPS injected eyes, as expected (Fig. 7B). At 3 (n = 5) and 7 (n = 4) days post injury, nitrotyrosine was elevated in the inner retina of the midperipheral (Figs. 7C, 7E), not central (Figs. 7D, 7F), retina. The labeling appeared strongest in the inner portion of the INL (Fig. 7E). At 28 days post blast (n = 5), increased and diffuse immunolabeling was detected in the inner and outer retina and extended throughout the retina (Figs. 7G, 7H).
Figure 7.
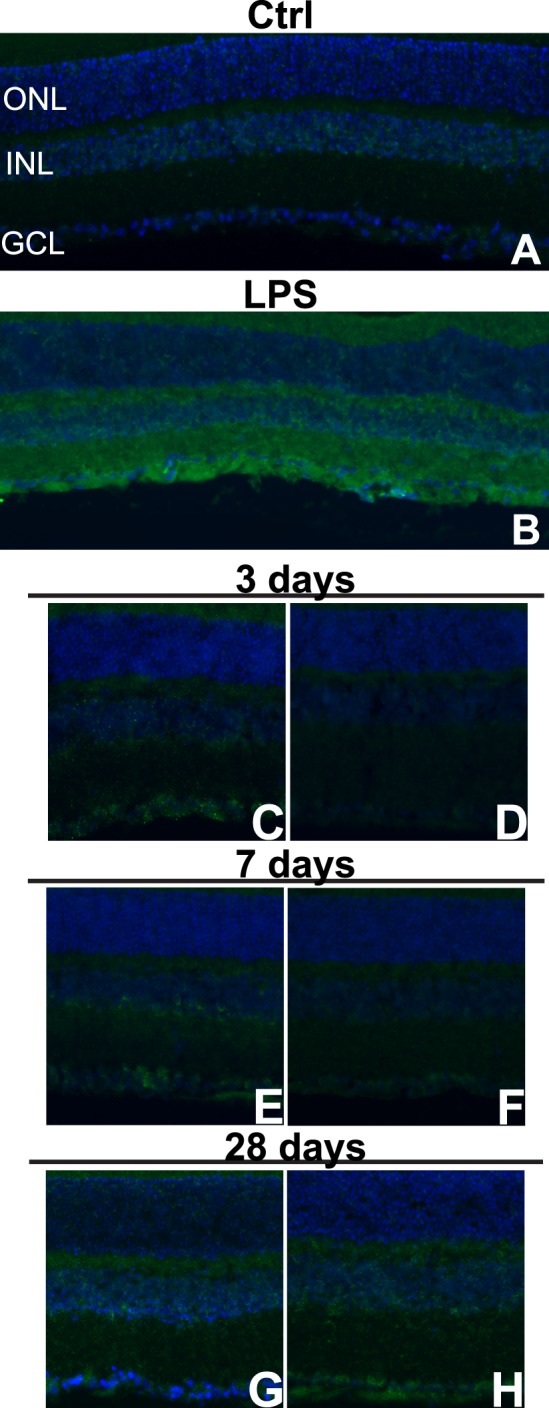
Nitrotyrosine immunolabeling increases regionally following blast. (A–H) Epifluorescence micrographs of control (A), LPS-injected (B), and midperipheral (C, E, G) and central (D, F, H) regions of 3- (C, D), 7- (E, F), and 28- (G, H) day postblast retinas labeled with antinitrotyrosine (green) and DAPI (blue).
Blast Causes Alterations in Visual Function
The ERG a and b wave latencies were unchanged post blast (data not shown). The amax of 28-day postblast mice was increased significantly at 0, 1, and 3 log cd*s/m2 when compared with baseline (Fig. 8A, **P < 0.01, *P < 0.05). In contrast, the bmax was only significantly increased at 0 log cd*s/m2 when compared with baseline (Fig. 8B, P < 0.05). The increase in the bmax (30%) was only one-half of the increase in the amax (60%) at this intensity. Oscillatory potentials 1 and 2 (OP1-2) increased significantly at 28 days post blast while OP3 decreased significantly at the same time point (Fig. 8C, P < 0.05) as compared with baseline.
Figure 8.

Blast causes visual deficits. (A) Graph of the ERG amax over a range of light intensities. The amax is significantly increased at 28 days post blast (squares) as compared with baseline (circles; *P < 0.05, **P < 0.01). (B) Graph of the ERG bmax over a range of light intensities. The bmax was increased at 0 log cd*s/m2 (P < 0.05). (C) Graph of oscillatory potential (OP) amplitudes at baseline and 28 days post blast. Oscillatory potential 1 and OP2 are increased (*P < 0.05), and OP3 is decreased at 28 days post blast (*P < 0.05). (D) Graph of the spatial frequency threshold over time in sham (squares) and blast-exposed (circles) mice. The visual acuity is significantly decreased in blast-exposed animals as compared with sham animals at 7, 14, and 28 days post injury. *P < 0.05, **P < 0.01.
Spatial frequency thresholds (i.e., visual acuity) were measured using the OKN behavioral test. Sham-blast mice showed an improvement in their tracking with repeated testing, consistent with previous reports (Fig. 8D).27 The visual acuities after sham or blast, respectively, were 0.394 ± 0.016 c/d (n = 10) and 0.317 ± 0.024 c/d (n = 16) at 7 days, 0.376 ± 0.015 c/d (n = 10) and 0.309 ± 0.027 (c/d n = 15) at 14 days, and 0.430 ± 0.007 c/d (n = 10) and 0.340 ± 0.016 (n = 15) at 28 days (Fig. 8D). The difference between the sham controls and the blast-exposed mice was statistically significantly when comparing the same time points (P < 0.05 at 14 days, P < 0.01 at 7 and 28 days).
Discussion
This model of eye-blast induces a delayed injury response similar to what has also been described in models of TBI (see Refs. 28, 29 for review), and in Veterans with blast-induced mild TBI.3–5 The lack of robust histologic damage after blast is consistent with models of blast-induced mild TBI that exhibit behavioral deficits despite only subtle histologic changes.30 We show that an over-pressure air blast to the eye causes molecular and cellular changes to all layers of the retina, leading to regional, nonapoptotic cell death, and decreased vision.
In the outer retina, the RPE vacuoles recovered at 28 days post blast as did the photoreceptor inner and outer segment disruption and rare retinal detachments. Rhegmatogenous retinal detachments are known to cause photoreceptor cell death with a peak at 3 days.31 However, no cell death was detected until 28 days after blast and, although the majority was photoreceptor, the cell death was overall variable and minimal. This, in conjunction with the lack of a decrease in the ERG a wave suggests that the amount/extent of photoreceptor cell death was insufficient to adversely affect vision. This is consistent with other blast studies.32–34 The surprising increase in the ERG a wave after blast may be due to decreased rod photoreceptor sensitivity or light adaptation. A similar effect was reported in cannabinoid receptor knock-out mice.35
The only cell death marker that was substantially increased in the outer retina after blast was RIP3, suggesting that the photoreceptors may die of necroptosis. Receptor-interacting protein kinases 3 directly interacts with several mitochondrial enzymes and, only when overexpressed, pushes metabolism into overdrive, resulting in excess production of reactive oxygen species and necrosis.18 Both TNF-α and RIP3 have also been reported to increase activation of microglia.36 Detection of RIP3 in the ONL at 28 days after blast correlated with detection of reactive microglia and increased nitrotyrosine immunolabeling in the ONL. This suggests that RIP3 may also contribute to both microglial activation and oxidative stress in the outer retina, which may result in additional cell loss at later time points. Future studies will investigate the role of RIP3 in the retina after blast.
Although rare, TUNEL-positive cells were detected in the INL in a subset of retinas. The localization did not appear to be specific to any particular cell type within the INL. As has been reported in other blast models, the most consistent and robust molecular changes were detected in the inner retina and involved nitrosative stress.32,34 In particular, one model using the same blast pressure used in this study, detected increased iNOS labeling in the inner retina.34 The increased peroxynitrite activity in the inner retina and increased RIP 1, RIP 3, and caspase-1 labeling in the INL could be linked since oxidative stress is both a trigger for,15 and a product of, pyroptosis and necroptosis.15,37,18
The presence of caspase-1 in the starburst amacrine cells has interesting implications for both functional and pathological outcomes following blast injury. These cells are critical for signaling directional selectivity onto downstream RGCs and are, therefore, necessary for the OKN response that is used to measure visual acuity (see Ref. 38 for review) and damage to them could underlie the decrease in visual acuity and the alterations in the OPs detected after blast in our model. The spread of caspase-1 labeling from small retinal regions at 3 days post blast to amacrine cells throughout the entire retina at 28 days post blast suggests spread of a molecular signal to neighboring cells. The amacrine cells are connected to each other by connexin-mediated gap junctions through which small signaling molecules can travel to enact neuroprotection or neurodegeneration.39–43
Despite the lack of RGC death in our model at 28 days post blast, our results suggest that they may die at later time points, as reported in other blast models.32,33 First, we begin to detect axon degeneration at 28 days post blast, which may precede RGC death as it does in traumatic optic neuropathy.44 Second, labeling for nitrotyrosine and markers of pyroptosis and necroptosis in the GCL are increased at 1 month post blast. This is consistent with other studies showing the first evidence of RGC death at 4 months post blast.32
In summary, markers of oxidative stress and inflammation increase over time after blast and are primarily localized to the inner retina, suggesting that inner retinal changes may drive visual deficits and that further cell death may be expected at later time points after blast (Fig. 9). This study provides molecular insight into the effects of ocular trauma on the neural retina that may underlie the delayed vision loss that occurs in blast-exposed patients despite a healthy ophthalmological exam.
Figure 9.
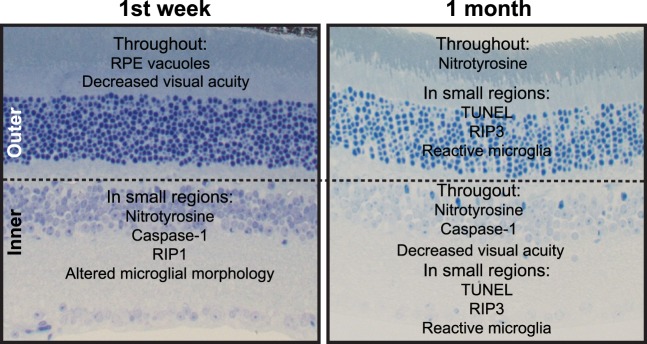
Summary of inner and outer retinal changes after blast injury.
Acknowledgments
Supported by Department of Defense (DoD; Washington, DC, USA) Grant W81XW-10-1-0528, Research to Prevent Blindness (NY, NY, USA), a Career Development Award, National Eye Institute (Bethesda, MD, USA) Grants EY022349 and P30-EY008126 (JS), and Research to Prevent Blindness Unrestricted Funds (PS).
DoD Non Endorsement Disclaimer: The views, opinions and/or findings contained in this research paper are those of the authors and do not necessarily reflect the views of the Department of Defense and should not be construed as an official DoD/Army position, policy or decision unless so designated by other documentation. No official endorsement should be made.
Disclosure: C. Bricker-Anthony, None; J. Hines-Beard, None; T.S. Rex, None
References
- 1. Organization WH. Priority eye disease: corneal opacities. Available at: http://www.who.int/blindness/causes/priority/en/index9.html. Accessed September 15, 2013 [Google Scholar]
- 2. Scott R. The injured eye. Philos Trans R Soc Lond Biol Sci. 2011; 366: 251–260 [DOI] [PMC free article] [PubMed] [Google Scholar]
- 3. Cockerham G, Goodrich G, Weichel E, et al. Eye and visual function in traumatic brain injury. J Rehab Res Develop. 2009; 46: 811–818 [DOI] [PubMed] [Google Scholar]
- 4. Cockerham G, Rice T, Hewes E, et al. Closed-eye ocular injuries in the Iraq and Afghanistan wars. New Engl J Med. 2011; 364: 2172–2173 [DOI] [PubMed] [Google Scholar]
- 5. Weichel E, Colyer M, Bautista C, Bower K, French L. Traumatic brain injury associated with combat ocular trauma. J Head Trauma Rehab. 2009; 24: 41–50 [DOI] [PubMed] [Google Scholar]
- 6. Giovinazzo V. The ocular sequelae of blunt trauma. Adv Ophthal Plastic Reconstr Surg. 1987; 6: 107–114 [PubMed] [Google Scholar]
- 7. Chalioulias K, Sim K, Scott R. Retinal sequelae of primary ocular blast injuries. JR Army Med Corps. 2007; 153: 124–125 [DOI] [PubMed] [Google Scholar]
- 8. Weichel E, Colyer M. Combat ocular trauma and systemic injury. Curr Opin Ophthal. 2008; 19: 519–525 [DOI] [PubMed] [Google Scholar]
- 9. Tyurin VA, Tyurina YY, Borisenko GG, et al. Oxidative stress following traumatic brain injury in rats. J Neurochem. 2000; 75: 2178–2189 [DOI] [PubMed] [Google Scholar]
- 10. Cho H, Sajja VS, VandeVord PJ, Lee YW. Blast induces oxidative stress, inflammation, neuronal loss and subsequent short-term memory impairment in rats. Neurosci. 2013; 253: 9–20 [DOI] [PubMed] [Google Scholar]
- 11. Pun P, Kan EM, Salim A, et al. Low level primary blast injury in rodent brain. Front Neurol. 2011; 2: 1–10 [DOI] [PMC free article] [PubMed] [Google Scholar]
- 12. Zhang D, Shao J, Lin J, et al. RIP3, an energy metabolism regulator that switches TNF-induced cell-death from apoptosis to necrosis. Science. 2009; 325: 332–336 [DOI] [PubMed] [Google Scholar]
- 13. You Z, Savitz SI, Yang J, et al. Necrostatin-1 reduces histopathology and improves functional outcome after controlled cortical impact in mice. J Cereb Blood Flow Metab. 2008; 28: 1564–1573 [DOI] [PMC free article] [PubMed] [Google Scholar]
- 14. Rathinam V, Vanaja S, Fitzgerald K. Regulation of inflammasome signaling. Nat Immunol. 2012; 13: 333–332 [DOI] [PMC free article] [PubMed] [Google Scholar]
- 15. Fink KB, Andrews LJ, Butler WE, et al. Reduction of post-traumatic brain injury and free radical production by inhibition of the caspase-1 cascade. Neurosci. 1999; 94: 1213–1218 [DOI] [PubMed] [Google Scholar]
- 16. Mejia ROS, Ona VO, Li M, Friedlander RM. Minocycline reduces traumatic brain injury-mediated caspase-1 activation, tissue damage, and neurological dysfunction. Neurosurg. 2001; 48: 1393–1401 [DOI] [PubMed] [Google Scholar]
- 17. Clark RSB, Kochanek PM, Chen M, et al. Increases in Bcl-2 and cleavage of caspase-1 and caspase-3 in human brain after head injury. FASEB J. 1999; 13: 821 [DOI] [PubMed] [Google Scholar]
- 18. Bergsbaken T, Fink SL, Cookson BT. Pyroptosis: host cell death and inflammation. Nat Rev Microbiol. 2009; 7: 99–109 [DOI] [PMC free article] [PubMed] [Google Scholar]
- 19. Hines-Beard J, Marchetta J, Gordon S, Chaum E, Geisert E, Rex T. A mouse model of ocular blast injury that induces closed globe anterior and posterior pole damage. Exp Eye Res. 2012; 99: 63–70 [DOI] [PMC free article] [PubMed] [Google Scholar]
- 20. Becker MD, Garman K, Whitcup SM, Planck SR, Rosenbaum JT. Inhibition of leukocyte sticking and infiltration, but not rolling, by antibodies to ICAM-1 and LFA-1 in murine endotoxin–induced uveitis. Invest Ophthalmol Vis Sci. 2001; 42: 2563–2566 [PubMed] [Google Scholar]
- 21. Rossi T, Boccassini B, Esposito L, et al. Primary blast injury to the eye and orbit: finite element modeling. Invest Ophthalmol Vis Sci. 2012; 53: 8057–8066 [DOI] [PubMed] [Google Scholar]
- 22. Phillips B, Chun D, Colyer M. Closed globe macular injuries after blasts in combat. Retina. 2013; 33: 371–379 [DOI] [PubMed] [Google Scholar]
- 23. Bhardwaj R, Ziegler K, Seo J, Ramesh K, Nguyen T. A computational model of blast loading on the human eye. Biomech Model Mechanobiol. 2014; 13: 123–140 [DOI] [PubMed] [Google Scholar]
- 24. Sullivan T, Geisert E, Hines-Beard J, Rex T. Systemic AAV-mediated gene therapy preserves retinal ganglion cells and visual function in DBA/2J glaucomatous mice. Hum Gene Ther. 2011; 22: 1191–1200 [DOI] [PMC free article] [PubMed] [Google Scholar]
- 25. Sullivan T, Geisert E, Templeton J, Rex T. Dose-dependent treatment of optic nerve crush by exogenous systemic mutant erythropoietin. Exp Eye Res. 2012; 96: 36–41 [DOI] [PMC free article] [PubMed] [Google Scholar]
- 26. Wu GS, Jiang M, Liu YH, Nagaoka Y, Rao NA. Phenotype of transgenic mice overexpressed with inducible nitric oxide synthase in the retina. PLoS One. 2012; 7: 1–8 [DOI] [PMC free article] [PubMed] [Google Scholar]
- 27. Prusky GT, Silver BD, Tschetter WW, Alam NM, Douglas RM. Experience-dependent plasticity from eye opening enables lasting, visual cortex-dependent enhancement of motion vision. J Neurosci. 2008; 28: 9817–9827 [DOI] [PMC free article] [PubMed] [Google Scholar]
- 28. Johnson VE, Stewart W, Smith DH. Axonal pathology in traumatic brain injury. Exp Neurol. 2013; 246: 35–43 [DOI] [PMC free article] [PubMed] [Google Scholar]
- 29. O'Dell CM, Das A, Wallace G, Ray SK, Banik NL. Understanding the basic mechanisms underyling seizures in mesial temporal lobe epilepsy and possible therapeutic targets: a review. J Neurosci Res. 2012; 90: 913–924 [DOI] [PubMed] [Google Scholar]
- 30. Heldt S, Elberger A, Deng Y, et al. A novel closed-head model of mild traumatic brain injury caused by primary overpressure blast to the cranium produces sustained emotional deficits in mice. Front Neurol. 2014; 5: 2 [DOI] [PMC free article] [PubMed] [Google Scholar]
- 31. Cook B, Lewis GP, Fisher SK, Adler R. Apoptotic photoreceptor degeneration in experimental retinal detachment. Invest Ophthalmol Vis Sci. 1995; 36: 990–996 [PubMed] [Google Scholar]
- 32. Mohan K, Kecova H, Hernandez-Merino E, Kardon R, Harper M. Retinal ganglion cell damage in an experimental rodent model of blast-mediated traumatic brain injury. Invest Ophthalmol Vis Sci. 2013; 54: 3440–3450 [DOI] [PMC free article] [PubMed] [Google Scholar]
- 33. Koliatsos VE, Cernak I, Xu L, et al. A mouse model of blast injury to the brain: initial pathological, neuropathological, and behavioral characterization. J Neuropathol Exper Neurol. 2011; 70: 399–416 [DOI] [PubMed] [Google Scholar]
- 34. Zou Y-Y, Kan EM, Lu J, et al. Primary blast injury-induced lesions in the retina of adult rats. J Neuroinflam. 2013; 10: 1186 [DOI] [PMC free article] [PubMed] [Google Scholar]
- 35. Cécyre B, Zabouri N, Huppé-Gourgues F, Bouchard J-F, Casanova C. Roles of cannabinoid receptors type 1 and 2 on the retinal function of adult mice. Invest Ophthalmol Vis Sci. 2013; 54: 8079–8090 [DOI] [PubMed] [Google Scholar]
- 36. Trichonas G, Murakami Y, Thanos A, et al. Receptor interacting protein kinases mediate retinal detachment-induced photoreceptor necrosis and compensate for inhibition of apoptosis. Proc Natl Acad Sci U S A. 2010; 107: 21695–21700 [DOI] [PMC free article] [PubMed] [Google Scholar]
- 37. Jin C, Flavell RA. Molecular mechanism of NLRP3 inflammasome activation. J Clin Immunol. 2010; 30: 628–631 [DOI] [PubMed] [Google Scholar]
- 38. Taylor W, Smith R. The role of starburst amacrine cells in visual signal processing. Vis Neurosci. 2012; 29: 73–81 [DOI] [PMC free article] [PubMed] [Google Scholar]
- 39. Massey SC, O'Brien JJ, Trexler EB, et al. Multiple neuronal connexins in the mammalian retina. Cell Commun Adhes. 2003; 10: 425–430 [DOI] [PubMed] [Google Scholar]
- 40. Striedinger K, Petrasch-Parwez E, Zoidl G, et al. Loss of connexin36 increases retinal cell vulnerability to secondary cell loss. Eur J Neurosci. 2005; 22: 605–616 [DOI] [PubMed] [Google Scholar]
- 41. Paschon V, Higa G, Resende R, Britto L, Kihara A. Blocking of connexin-mediated communication promotes neuroprotection during acute degeneration induced by mechanical trauma. PLoS One. 2012; 7: e45449 [DOI] [PMC free article] [PubMed] [Google Scholar]
- 42. Yoon J, Green C, O'Carroll S, Nicholson L. Dose-dependent protective effect of connexin43 mimetic peptide against neurodegeneration in an ex vivo model of epileptiform lesion. Epil Res. 2010; 92: 153–162 [DOI] [PubMed] [Google Scholar]
- 43. Danesh-Meyer HV, Kerr NM, Zhang J, et al. Connexin43 mimetic peptide reduces vascular leak and retinal ganglion cell death following retinal ischaemia. Brain. 2012; 135: 506–520 [DOI] [PubMed] [Google Scholar]
- 44. Warner N, Eggenberger E. Traumatic optic neuropathy: a review of the current literature. Curr Opin Ophthalmol. 2010; 21: 459–462 [DOI] [PubMed] [Google Scholar]