

Abstract
The effects of feedstock type and biomass conversion conditions on the speciation of sulfur in biochars are not well-known. In this study, the sulfur content and speciation in biochars generated from pyrolysis and gasification of oak and corn stover were determined. We found the primary determinant of the total sulfur content of biomass to be the feedstock from which the biochar is generated, with oak and corn stover biochars containing 160 and 600–800 ppm sulfur, respectively. In contrast, for sulfur speciation, we found the primary determinant to be the temperature combined with the thermochemical conversion method. The speciation of sulfur in biochars was determined using X-ray absorption near-edge structure (XANES), ASTM method D2492, and scanning electron microscopy–energy-dispersive spectroscopy (SEM–EDS). Biochars produced under pyrolysis conditions at 500–600 °C contain sulfate, organosulfur, and sulfide. In some cases, the sulfate contents are up to 77–100%. Biochars produced in gasification conditions at 850 °C contain 73–100% organosulfur. The increase of the organosulfur content as the temperature of biochar production increases suggests a similar sulfur transformation mechanism as that in coal, where inorganic sulfur reacts with hydrocarbon and/or H2 to form organosulfur when the coal is heated. EDS mapping of a biochar produced from corn stover pyrolysis shows individual sulfur-containing mineral particles in addition to the sulfur that is distributed throughout the organic matrix.
Introduction
Lignocellulosic biomass is a renewable carbon source.1 Pyrolysis2−4 and gasification5−7 are thermochemical processes that treat biomass feedstock with heat to produce intermediates that can be converted to liquid fuels with the aid of catalysts.1,8,9 In addition to these intermediates, thermochemical processes also convert a fraction of the biomass to biochar. The trace elements in biomass, such as potassium, sulfur, phosphorus, and chlorine, are also partitioned between gas and solid (biochar and ash) phases. Biochar has been reported to act as a carbon sink,3,10,11 as a sorbent to remove contaminants,12 and as a way to improve crop production.13 In fact, a primary reason for studying the forms of sulfur in biochars is that there is significant interest in using biochar for soil augmentation, and because plants need sulfur, an understanding of the quantity and speciation of sulfur in biochar is of interest to the agricultural and environmental community.
Sulfur is an essential, growth-limiting plant nutrient; it is required for protein synthesis, occurs in the form of sulfolipids in photosynthetic membranes,14 and affects the use efficiency of other plant nutrients.14,15 Sulfur deficiency is a problem that has been reported recently.16 Numerous studies have shown indirectly that the addition of biochars to soils could increase soil sulfur bioavailability.17 However, direct information or direct studies on the impact of biochar on sulfur availability and transformations in soils is scarce.17 A recent study on sulfur mineralization of plant litter and corn stover biochar by Blum et al. found that speciation rather than total sulfur is likely the major factor that influences sulfur mineralization in soil.18 This research finding indicates the need for quantitative determination of sulfur speciation in biochars produced from different feedstocks under different conditions.
There is empirical evidence that the temperature at which the biochar material is formed affects its potential nutrient contribution or its function as a soil conditioner and driver of nutrient transformation.19 This may be related to changes in the composition and speciation of the biochar as the temperature of biochar production changes. For example, Knudsen et al. found that, as the temperature of thermal conversions of agricultural residues increased from 500 to 800 °C, the biochar that is produced contains less sulfate but more sulfur that is in a form that cannot be extracted with acid.20 They hypothesized that the fraction that is not extractable is organically associated, i.e., bound to carbon in the biochar matrix.20 However, the sulfur form in the biochar was not measured directly.
Another main reason for our interest in direct measurement of sulfur speciation in biochar is because gas-phase sulfur that is released during biomass conversion is often in the form of hydrogen sulfide21 and organosulfur that can deactivate catalysts used for downstream biofuel production. The factors that control the relative partitioning of sulfur in gas versus biochar are not well-understood. Consequently, an understanding of biochar speciation may suggest a potential sulfur transformation pathway, which may in turn support the purposeful development of strategies to sequester as much of the sulfur in the solid biochar form as possible.
X-ray absorption near-edge structure (XANES) is an element-specific method that can provide direct speciation information, including the oxidation state and the chemical environment around a specific element of interest. It has been used for determining the speciation of sulfur in petroleum,22 soil, and natural environments.23,24 In our previous study to determine the speciation of sulfur in deactivated catalyst,25 sulfur-XANES was able to differentiate sulfur species in samples where sulfur may not have existed in crystalline form to have X-ray diffraction patterns or where there was insufficient surface sulfur for X-ray photoelectron spectroscopy characterization.
In this research, biochars produced from different feedstocks at different thermochemical conversion conditions were quantitatively analyzed and then studied with XANES. Where applicable, wet chemical measurements of sulfate content and scanning electron microscopy–energy-dispersive spectroscopy (SEM–EDS) imaging were also used to provide a second method to determine sulfur speciation and spatial distribution of sulfur in the biochar.
Materials and Methods
Biochar Generation
Pyrolysis and gasification experiments were conducted in a pilot-scale facility at the National Renewable Energy Laboratory (NREL). The details of the fluid bed gasification experiments were described in a previous publication.26 Briefly, pelletized biomass (0.25 in. in diameter and 0.25–3 in. in length) was fed through a crusher to reduce the particle size to less than 2.3 mm in diameter. The resulting feed particles were transported directly into an entrained flow reactor, where they were either pyrolyzed in nitrogen at 500–600 °C or gasified in steam at 850 °C. The oak 850 °C gasification experiments were conducted in a slightly different manner: the oak particles were fed to a 20.3 cm (8 in.) diameter fluidized-bed reactor. Olivine sand in the reactor was fluidized by steam and kept at 700 °C. The vapors and biochar produced from the fluidized-bed reactor flowed through an entrained flow reactor for secondary cracking and gasification at 850 °C.
The ash and biochar produced were separated from the pyrolysis vapor or syngas stream by cyclonic separators and then cooled, collected, and weighed. To obtain representative samples, the biochar samples were riffled27 or divided using a RETSCH rotating tube divider. Resulting samples were then ground and analyzed for sulfur content and speciation.
Naming Convention
For simplicity, in the rest of this paper, the biochars will be named with the feedstock followed by the temperature in which it was produced.
Quantitative Sulfur Analysis
Total sulfur contents of the feedstocks and biochars were measured with a LECO TruSpec sulfur add-on module. The measurement procedure involves combustion of the material at 1350 °C in 99.5% oxygen (to break down all sulfur-bearing material and to oxidize the sulfur to SO2) followed by infrared measurement of SO2.
Sulfatic Sulfur Wet Chemical Measurements
We used a wet chemical method similar to that described in ASTM D2492 for sulfate analysis. ASTM method D2492 is a method used for determining sulfate and sulfide forms of sulfur in coal.28 The sulfate portion of the sample is extracted with hot dilute hydrochloric acid because sulfates are soluble in hydrochloric acid, while sulfidic and organic sulfur are not. Afterward, the sulfur in the extract is determined gravimetrically as a BaSO4 precipitate. Because the method does not assume any sequestration agent for sulfate in the sample, we concluded that the sulfate portion of the method is applicable for biochar.
We did not use ASTM method D2492 for sulfide determination because the determination of the sulfide form of sulfur in the method is achieved by extraction with dilute nitric acid, followed by determination of the iron content of the extract.28,29 The sulfidic sulfur content is then calculated from the 1:2 stoichiometry of FeS2. In other words, the inherent assumption in the method is that sulfide in coal exists as pyrite; therefore, the concentration of sulfide is dependent upon the iron content. Because the concentrations of major elements are significantly different between biochar and coal (e.g., coal generally has higher Fe but much lower potassium30 than the biochars of this study), the assumption of “all sulfide exists as pyrite” most likely does not hold for biochar.
XANES
Sulfur K-edge XANES of biochar was performed at beamline 4-3 of the Stanford Synchrotron Radiation Lightsource. The spectra were collected in the energy range of 2440–2600 eV using a four-element Si drift detector. Step size was 0.1 eV for the energy range of 2460–2483 and 2 eV outside of that range. Energy calibration was conducted using the first inflection of sodium thiosulfate, with the first white line of thiosulfate accurately determined as 2472.02 eV in a previous study.31 Merging of individual scans and spectra normalization were performed with Sam’s Interface for XAS Package (SIXPACK).32
SEM–EDS
We used MiniSEM Evex to conduct SEM and Evex NanoAnalysis Module to conduct EDS.
For data collection, a biochar sample was mounted on carbon tape and observed under magnifications varying from 500× to 15000×. Surface structure images of the biochar were captured using SEM. Afterward, the sample was analyzed for elemental mapping via EDS imaging. The nine elements chosen for mapping are sulfur, carbon, oxygen, magnesium, aluminum, silicon, calcium, potassium, and chlorine.
The EDS in our equipment has a detection limit of approximately 1000 ppm. Because of the low amount of sulfur in the samples, EDS is useful only for the biochar containing the highest amount of sulfur, which is the corn stover 500 °C sample.
Results and Discussion
Composition of Feedstocks and Biochars
Table 1 shows total sulfur contents as well as proximate, ultimate, and elemental analyses of feedstocks and biochars. The proximate and elemental analysis data are not available for oak 850 °C biochar because that biochar is mixed with olivine. During gasification, fine olivine dust (derived from the olivine fluidized-bed material) is occasionally elutriated or blown out into the cyclones and mixes with biochars. Because olivine is a magnesium iron silicate, the resultant ash analysis has unusually high magnesium and iron and the elemental analyses of the ash are not accurate. However, we have conducted XANES analysis of the olivine and confirmed that it has practically zero sulfur content and does not affect the sulfur speciation results. We have also used X-ray diffraction (see Figure S2 of the Supporting Information) to measure the biochars and detected olivine peaks only in the oak 850 °C biochar.
Table 1. Analyses of the Composition of Feedstocks and Biocharsa.
| proximate |
ultimate |
ash
analysis (whole biomass/biochar basis) |
|||||||||||
|---|---|---|---|---|---|---|---|---|---|---|---|---|---|
| sample | moisture (wt %) | volatiles (wt %) | fixed C (wt %, dry) | ash (wt %, dry) | C (%) | H (%) | N (%) | S (ppm) | Fe (ppm) | Ca (wt %) | Mg (ppm) | K (wt %) | Si (%) |
| oak feedstock | 5.4 | 80.9 | 13.2 | 0.5 | 48.1 | 5.3 | 0.2 | 33 ± 12 | 22 | 0.14 | 56 | 0.080 | 0.0077 |
| oak biochar 500 °C | <0.02 | 23.6 | 71.9 | 4.5 | 82.1 | 2.8 | 0.3 | 160 ± 40 | 290 | 1.2 | 820 | 0.66 | 0.11 |
| oak biochar 600 °C | <0.01 | 19.1 | 76.3 | 4.6 | 84.4 | 2.6 | 0.4 | 170 ± 10 | 200 | 1.3 | 590 | 0.75 | 0.066 |
| oak biochar 850 °C | 0.3 | NA | NA | NA | 76.9 | 1.1 | 0.2 | 150 ± 6 | NA | NA | NA | NA | NA |
| corn stover feedstock | 6.5 | 67.2 | 15.7 | 10.5 | 43.4 | 4.8 | 0.8 | 730 ± 96 | 830 | 0.34 | 1100 | 1.4 | 3.2 |
| corn stover biochar 500 °C | 3.3 | 14.9 | 43.0 | 38.8 | 45.0 | 2.2 | 0.7 | 800 ± 30 | 9000 | 0.99 | 4900 | 4.5 | 13 |
| corn stover biochar 850 °C | 3.2 | 8.4 | 41.4 | 47.1 | 42.0 | 1.0 | 0.4 | 610 ± 10 | 10000 | 1.4 | 9200 | 5.4 | 14 |
The parts per million (ppm) values reported are equivalent to mg/kg. The weight percentage of ash in the proximate analysis (fifth column from the left side of the table) is in the oxide form, which is standard practice. However, the S, Fe, Ca, Mg, K, and Si analysis results are expressed in ppm or percentage of the elemental form.
In comparison of the two feedstocks, corn stover contains approximately 400 times more silicon and 20 times more ash, sulfur, magnesium, and potassium than oak. In comparison of biochars derived from the two feedstocks, the biochars from corn stover contain much higher ash, sulfur, and other inorganic elements than the biochars from oak. For example, the oak and corn stover biochars contain 150–170 and 600–800 ppm total sulfur, respectively. Our results demonstrate feedstock as the primary determinant of the total sulfur content of the resultant biochars.
In comparison of mineral contents in the biochars to those in the originating feedstocks, the average sulfur content of oak biochars (≈160 ppm) is much higher than the oak feedstock, indicating an enrichment of sulfur in the solid phase during the biomass conversion process. The sulfur contents of corn stover biochars, however, are not statistically different from that in corn stover feedstock. We will provide our hypotheses for this lack of sulfur enrichment in the Discussion.
From examination of the effect of the temperature for corn stover biochars, the sulfur content in the 850 °C gasification sample (610 ppm) is lower than the 500 °C pyrolysis sample (800 ppm) by 24%, which is more than our measurement uncertainties. The result for corn stover suggests the temperature and biomass conversion conditions as a secondary determinant of the total sulfur content in the biochar. The difference in the sulfur contents of the oak biochar samples is not as reliable because of the presence of fine olivine in the oak 850 °C biochar.
XANES Results
Reference spectra of sulfur model compounds with different oxidation states and bonding environments were collected for qualitative comparison and quantitative fitting of the sample/unknown spectra. A list of the model compounds used in this study and their XANES spectra figures are in Table S1 and Figure S1 of the Supporting Information.
The XANES results of the model compounds show that there are distinct spectra for sulfur atoms in different oxidation states and coordination environments, in agreement with other works examining XANES of sulfur.22−24 As the oxidation state of sulfur in the molecule or crystal increases, the white line or absorption edge of sulfur increases, providing a unique signature to determine oxidation states of sulfur in the biochars.
The XANES spectra for the oak and corn stover biochar samples are shown in panels a and b of Figure 1, respectively. On the basis of visual inspection, there are two dominant peaks at 2474 and 2482.5 eV (middle and right dashed lines) that vary in intensity depending upon the samples. The spectrum of the 600 °C oak biochar has a distinct shoulder at 2472.5 eV (left dashed line in Figure 1a). A less distinct shoulder can also be seen in the corn stover 500 °C biochar spectrum (left dashed line in Figure 1b).
Figure 1.

XANES spectra of biochar generated from (a) oak and (b) corn stover at different pyrolysis (500 and 600 °C in nitrogen) and gasification (850 °C in steam) conditions.
Table 2 shows linear combination fitting results using SIXPACK.33 For several of the samples, linear combination fitting using Athena’s “fit all combinations” feature was also conducted to check for all possibilities. The results from the Athena fitting agree with those from SIXPACK.
Table 2. Sulfur Speciation Results Obtained from XANES and ASTM Method D2492a.
| XANES
analysis results (% of sulfur species) |
D2492 results (% of sulfur species) | ||||
|---|---|---|---|---|---|
| feedstock from which biochar originated | temperature at which biochar was produced (°C) | sulfate | organosulfur | sulfide | sulfate |
| oak | 500 | 56 | 44 | ||
| oak | 600 | 26 | 62 | 12 | |
| oak | 850 | 100 | |||
| corn stover | 500 | 77–100 | 0–23 | 63 | |
| corn stover | 850 | 27 | 73 | 17 | |
The percentage values are a fraction percentage of the total sulfur. In the case of XANES, the fraction percentage was obtained directly from linear combination fitting of the spectra. In the case of D2492, the direct result of the method is the sulfate concentration in mg/kg. The sulfate fraction percentage in the table was derived from dividing the sulfate concentration by the total sulfur concentration.
Most of the samples have two different sulfur species, except the oak 600 °C sample, which is best fitted with three, and the oak 850 °C sample, which is only fitted with one species. Fitting results show the peak at 2482.5 eV to be attributed to sulfate.
The spectra of four sulfur-containing organic compounds, namely those of dibenzyldisulfide, l-cysteine, dibenzothiophene, and thianthrene, were used individually and in combinations of two to determine the structure and identity of the peak that centers around 2474 eV. In every sample, dibenzothiophene provides the best fit. In the corn stover 850 °C biochar, fitting the 2474 eV peak with both dibenzothiophene (59% of total sulfur) and dibenzyldisulfide (14% of total sulfur) improves the goodness of fit by 6.5%. This is consistent with an interpretation that the organosulfur in biochar is a mixture of sulfur bound to carbon in different structures. However, for simplicity, Table 2 shows best fits obtained without including the second organosulfur component; i.e., all of the organically bound sulfur is grouped as one.
The oak 600 °C and corn stover 500 °C biochar samples both show a small peak or shoulder in the 2472.5 eV energy area that indicates the presence of sulfide. Three different sulfide spectra were tried in the linear combination fitting; they are the sulfide in NiS that we collected for this research and the pyrite and marcasite spectra in a database named ID21 maintained by the European Synchrotron Radiation Facility.34 The pyrite spectrum yields the best fit. The linear combination fitting of oak 600 °C biochar indicates 12% sulfidic species. However, the linear combination fitting of corn stover 500 °C biochar shows negligible improvements when sulfide is included in the fit.
Biochar is inherently heterogeneous; therefore, we also checked for range of values in the speciation distribution. To this end, four different XANES data sets of different portions of the ground, riffled corn stover 500 °C biochar were collected. When the spectra were fitted, we found 77, 85, 98, and 100% sulfate and 23, 15, 3, and 0% organosulfur in the four samples, respectively. Consequently, the percentages of sulfate and organosulfur for that sample are reported in Table 2 as 77–100 and 0–23%, respectively. The result indicates that there is more sulfate in the corn stover 500 °C sample than the corn stover 850 °C sample even when accounting for sample heterogeneity.
The XANES fitting method shows that both the sulfate and sulfide fractions decrease with the temperature, while the organosulfur fraction increases with the temperature. This trend is true for both oak- and corn-stover-derived biochars, even though the total sulfur contents of these two biochars differ by 3–4 times. These results show that the temperature and conversion conditions are the most important factors in determining sulfur speciation. The results also suggest that there may be some similarities in the sulfur transformation pathway, at least in the 500–850 °C temperature region.
Determination of Sulfate in Biochar Using a Wet Chemical Standard Method
The detection limit of sulfate for the ASTM method D2492 is 200 ppm or 0.02%. This method is potentially suitable for corn stover biochars but not suitable for oak biochars, which only have total sulfur content of 160 ppm and, consequently, will not have sufficient sulfate for the measurement even if all of the sulfur in oak biochars was in the sulfate form.
We detected 63 and 17% sulfate species for the corn stover biochar produced at 500 and 850 °C, respectively (Table 2). The SO4 contents measured by ASTM D2492 agree well with those determined with XANES analysis, differing by 10–14%, which is within experimental uncertainty.
SEM–EDS Results
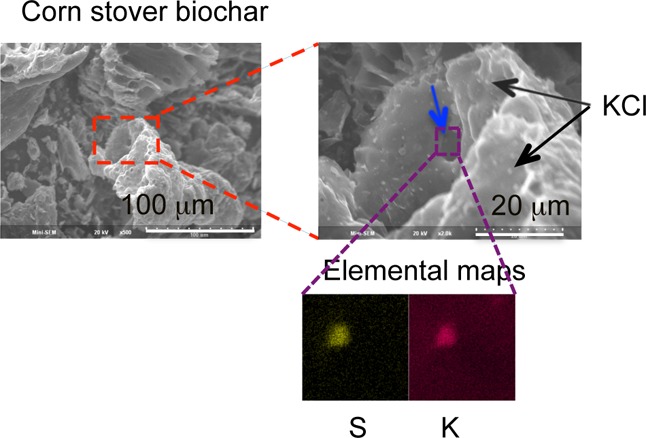
Figure 2 shows SEM pictures of the oak 500 °C (panels a and b of Figure 2) and corn stover 500 °C (panels c and d of Figure 2) biochars. In comparison of SEM pictures of similar scale (panels b and c of Figure 2, where both show structure on the order of 100 μm or slightly larger), it is clear that the corn stover biochar is less fibrous/woody than oak biochar. Instead, corn stover biochar has a more foam-like structure. There are many fine particles on both the outer surfaces of the “foam” and trapped within “channels” in the foam (highlighted by black and blue arrows in Figure 2d).
Figure 2.
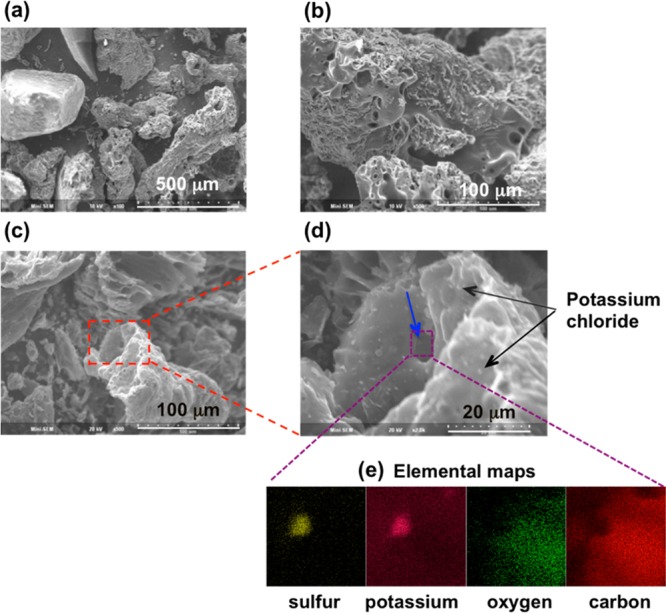
SEM and EDS images of (a and b) oak and (c–e) corn stover 500 °C biochars. The SEM image in panel d represents the square area enclosed by red dashed lines in panel c. The elemental maps in panel e show element concentrations in an area enclosed by dashed purple lines in panel d. There is a particle in the area that is enriched with sulfur and potassium but depleted with carbon and oxygen. The other fine particles (two of which are shown with black arrows) in panel d are enriched with potassium and chlorine.
EDS shows that sulfur is distributed throughout the entire biochar. Because we detected multiple fine particles on the biochar, we also conducted detailed elemental analyses specifically of the particles to determine their elemental composition. Almost all of the fine particles turn out to be rich in potassium and chlorine, which we interpreted to be KCl particles (two of them are indicated by black arrows in Figure 2d).
Of the mineral particles shown in Figure 2d, only one was found to have high sulfur levels (indicated by a blue arrow in Figure 2d). EDS of the particle collected over the energy range of nine different elements shows that it is also enriched in potassium but comparatively low in oxygen and carbon (four of the elemental maps are shown in Figure 2e). This suggests the particle may have the composition K2S. This result is in agreement with the observation of a small shoulder at approximately 2472 eV, which is an absorption peak corresponding with sulfide, for the corn stover 500 °C biochar. Because the imaging method only selectively images some but not all particles in the sample, it is not surprising that an individual particle has a composition that turns out to be a minority species detected by XANES, which is a method that measures the bulk composition.
Discussion
Distribution of Sulfur to Solid and Gas Phases during Biomass Conversion
Table 1 shows that, while oak biochar is enriched in sulfur, corn stover biochar is not. One possible explanation for this observation lies with the very high concentration of silicon in corn stover (Table 1). The elements in biomass that are likely bound to sulfur in sulfate form are Ca, K, Mg, and Na. According to thermodynamic calculations published in the literature, silicate may compete with sulfate for these cations;35 therefore, even though there are high concentrations of metals, such as potassium and calcium in corn stover, they may not be able to capture much of the sulfur. This would result in more sulfur being released to the syngas, a phenomenon often reported for herbaceous feedstocks.21,36
Because the stability of silicate is higher than sulfate at higher temperatures, silicate is able to sequester even more of the inorganic cations, resulting in a lower sulfur concentration in the corn stover 850 °C biochar than in the corn stover 500 °C biochar. The above reasoning suggests that the H2S concentrations in the syngas derived from corn stover gasification may be higher at higher temperatures, which is consistent with literature findings.36
It should be noted that another factor that determines sulfur concentrations in the gas phase is the extent of conversion from feedstock to gas. Thermochemical conversion at a higher temperature (e.g., 850 °C) generally produces a higher gas yield and less biochar than conversion at a lower temperature.36,37 Consequently, for oak, even though the concentration of sulfur in the biochar is approximately independent of the temperature, the quantity of biochar and total sulfur sequestered in biochar decrease with the temperature, while the concentration and quantity of H2S in the syngas increase with the temperature.36
Although the mass closure for carbon is 80–90% in many biomass conversion studies,36 we do not have good mass balance for trace elements, such as sulfur. Traditionally, carbon (and hydrogen) mass balance during biomass conversion is obtained by accounting for all of the carbon (and hydrogen) in biochar, tar (another byproduct of gasification), and gases (or bio-oil) produced. However, although the biofuel community generally monitors sulfur concentrations in syngas and in biochar, the amount of sulfur in tar and pyrolysis vapor is usually not measured.
The finding of organosulfur in biochar suggests that there may also be organosulfur trapped in tars and pyrolysis vapors. This has recently been confirmed at gasification conditions.38 Elliott had also measured sulfur in oak, pine, and switchgrass pyrolysis oils, although no speciation information was reported.39 He also concluded that the sulfur and other inorganics are distributed in both the oil phase and biochar particulates suspended in the oil.39 Recent publications further suggest that there may be mineral deposits on the surfaces of the fluidized-bed material used during thermochemical biomass conversion.40 In future studies, measurements of sulfur in tars, pyrolysis vapors, and bed materials, in addition to conventional measurements of sulfur in syngas and biochar, will be necessary to obtain mass closure of sulfur during thermochemical biomass conversion.
Comparison to the Formation of Organosulfur during Coal Pyrolysis
The detection of the high sulfate content in biochars formed under lower temperature regions (500–600 °C) and high organosulfur content in biochars that were formed under high temperatures (Table 2) confirms the hypothesis by Knudsen et al.20 while showing a similar trend as previous studies of sulfur speciation in coal. For example, Telfer and Zhang found that, as sulfatic sulfur decomposes in coal, the fraction of organosulfur increases.41
In a review of sulfur in coal, Attar suggested that transformation of solid-state inorganic sulfide to organosulfur can occur via the reactions of hydrocarbon, such as C2H2, with FeS2 or could be a two-step process, where the metallic sulfide reacts with H2 and forms H2S in the process and H2S then reacts with organic groups to form organosulfur.42 Once formed, some of the organosulfur (e.g., thiophenic compounds) are kinetically slow to decompose.42
In other research, Cleyle et al. used SEM–EDS and showed that, after pyrolysis, additional sulfur was observed in the organic matrix surrounding pyrite particles in coal.43 Other proof supporting the hypothesis that, in coal, sulfur is transformed from sulfidic sulfur to organic sulfur came from radioactive 35S tracer experiments.44
On the basis of literature reports of changes in biomass morphology and the above-cited reports on sulfur transformation in coals, a tentative pathway for sulfur transformation is proposed. In the early phase of heating, the biomass feedstock is devolatilized,35 while the lignocellulosic material undergoes a glass transition phase.45 The tissue and macropore expand and then collapse,46 and eventually, the biomass forms a foam-like biochar.47
It has been further hypothesized that, during the early devolatilization process, dehydrated ions precipitate out as inorganic salts or become ion-exchanged to functional groups in the biochar matrix.35 It is highly likely that the foam-like biochar can trap some of the inorganic salt. Our EDS images show that at least some of the sulfur exists in the form of small particles trapped within the biochar matrix.
As the temperature of the biomass particles approaches the reactor temperature, some of the sulfur is converted from sulfate and sulfide to organosulfur when hydrocarbon molecules (present in pyrolysis vapors and syngas) and/or H2 (present in syngas) react with the inorganic salt. This hypothesized reaction pathway that occurs at a higher temperature with biomass feed material is parallel to the reaction pathways proposed for coal described above.
Impacts of Sulfur Speciation in Biochar to the Environment
Even though there are a number of studies indicating the large impact of the temperature of biochar production on their properties, such as cation-exchange capacity, aromaticity, and sorption capability,48−50 there have been few studies on the effect of the temperature and feedstocks on the speciation of sulfur and other trace components of the biochar. It has been reported that most soil sulfur exists in an organic state, such as ester sulfate or other carbon-bonded sulfur, and must be oxidized to SO42– prior to plant uptake, indicating the importance of sulfur speciation for mineralization.17,51 A previous study by Blum et al. also found that sulfur mineralization correlates with the sulfate content.18
Our results provide important biochar sulfur speciation information as a function of biomass conversion conditions. This research shows that there is a much higher fraction of sulfur in organosulfur form for biochar produced from biomass gasification (850 °C) than biochar produced from pyrolysis (500–600 °C). This result suggests the sulfate-rich biochar produced from pyrolysis may be more easily mineralized, although actual sulfur mineralization field studies with biochar amendment to soils will be necessary to test the hypothesis. Further studies are also required to determine whether the sulfur speciation trend observed in this study holds for other feedstocks.
Acknowledgments
The authors thank Daniel Carpenter and Katherine Gaston at NREL for their comments and discussion as well as three anonymous reviewers for their constructive feedback and insights. The authors also gratefully acknowledge the help of Dr. Ritimukta Sarangi and Dr. Erik Nelson of the Stanford Synchrotron Radiation Laboratory (SSRL) during XANES data collection. Funding for this research was provided by the BioEnergy Technologies Office, U.S. Department of Energy (DOE), under contract number DE-AC36-08GO28308, with the National Renewable Energy Laboratory. Shealyn C. Malone’s work at NREL was funded by the Science, Technology, Engineering, and Mathematics Teacher and Researcher (STAR) program, which is supported by the National Science Foundation, The California State University, and the S. D. Bechtel, Jr. Foundation. Portions of this research were carried out at SSRL a Directorate of SLAC National Accelerator Laboratory and an Office of Science User Facility operated for the U.S. Department of Energy Office of Science by Stanford University. The SSRL Structural Molecular Biology Program is supported by the DOE Office of Biological and Environmental Research and by the National Institutes of Health (NIH), National Institute of General Medical Sciences (NIGMS) (including P41GM103393), and National Center for Research Resources (NCRR) (including P41RR001209). The contents of this publication are solely the responsibility of the authors and do not necessarily represent the official views of NIGMS, NCRR, or NIH.
Supporting Information Available
Structures and X-ray absorption spectra of model compounds as well as X-ray diffraction patterns of the biochars. This material is available free of charge via the Internet at http://pubs.acs.org.
The authors declare no competing financial interest.
Funding Statement
National Institutes of Health, United States
Supplementary Material
References
- Anex R. P.; Aden A.; Kazi F. K.; Fortman J.; Swanson R. M.; Wright M. M.; Satrio J. A.; Brown R. C.; Daugaard D. E.; Platon A.; Kothandaraman G.; Hsu D. D.; Dutta A. Techno-economic comparison of biomass-to-transportation fuels via pyrolysis, gasification, and biochemical pathways. Fuel 2010, 89, S29–S35. [Google Scholar]
- Bridgwater A. V.; Peacocke G. V. C. Fast pyrolysis processes for biomass. Renewable Sustainable Energy Rev. 2000, 411–73. [Google Scholar]
- Laird D. A.; Brown R. C.; Amonette J. E.; Lehmann J. Review of the pyrolysis platform for coproducing bio-oil and biochar. Biofuels, Bioprod. Biorefin. 2009, 35547–562. [Google Scholar]
- Elliott D. C. Historical developments in hydroprocessing bio-oils. Energy Fuels 2007, 2131792–1815. [Google Scholar]
- Higman C.; van der Burgt M.. Gasification. 2nd ed.; Gulf Professional Publishing, an imprint of Elsevier: Burlington, MA, 2008; p 435. [Google Scholar]
- Corella J.; Toledo J. M.; Molina G. Biomass gasification with pure steam in fluidised bed: 12 variables that affect the effectiveness of the biomass gasifier. Int. J. Oil Gas Coal Technol. 2008, 11–2194–207. [Google Scholar]
- van Rossum G.; Kersten S. R. A.; van Swaaij W. P. M. Catalytic and noncatalytic gasification of pyrolysis oil. Ind. Eng. Chem. Res. 2007, 46123959–3967. [Google Scholar]
- Bain R. L.; Magrini-Bair K. A.; Hensley J. E.; Jablonski W. S.; Smith K. M.; Gaston K. R.; Yung M. M. Pilot scale production of mixed alcohols from wood. Ind. Eng. Chem. Res. 2014, 5362204–2218. [Google Scholar]
- Huber G. W.; Iborra S.; Corma A. Synthesis of transportation fuels from biomass: Chemistry, catalysts, and engineering. Chem. Rev. 2006, 10694044–4098. [DOI] [PubMed] [Google Scholar]
- Lehmann J. Bio-energy in the black. Front. Ecol. Environ. 2007, 57381–387. [Google Scholar]
- Lehmann J. A handful of carbon. Nature 2007, 4477141143–144. [DOI] [PubMed] [Google Scholar]
- Cao X. D.; Ma L. N.; Gao B.; Harris W. Dairy-manure ferived biochar effectively sorbs lead and atrazine. Environ. Sci. Technol. 2009, 4393285–3291. [DOI] [PubMed] [Google Scholar]
- Chia C. H.; Gong B.; Joseph S. D.; Marjo C. E.; Munroe P.; Rich A. M. Imaging of mineral-enriched biochar by FTIR, Raman and SEM–EDX. Vib. Spectrosc. 2012, 62, 248–257. [Google Scholar]
- Maathuis F. J. M. Physiological functions of mineral macronutrients. Curr. Opin. Plant Biol. 2009, 123250–258. [DOI] [PubMed] [Google Scholar]
- De Bona F. D.; Monteiro F. A. Nitrogen and sulfur fertilization and dynamics in a Brazilian Entisol under pasture. Soil Sci. Soc. Am. J. 2010, 7441248–1258. [Google Scholar]
- Eriksen J.Soil sulfur cycling in temperate agricultural systems. In Advances in Agronomy; Sparks D. L., Ed.; Elsevier Academic Press, Inc.: San Diego, CA, 2009; Vol. 102, pp 55–89. [Google Scholar]
- DeLuca T. H.; MacKenzie M. D.; Gundale M. F.. Biochar effects on soil nutrient transformations. In Biochar for Environmental Management: Science and Technology; Lehmann J., Joseph S., Eds.; Earthscan: London, U.K., 2009; pp 251–270. [Google Scholar]
- Churka Blum S.; Lehmann J.; Solomon D.; Caires E. F.; Alleoni L. R. F. Sulfur forms in organic substrates affecting S mineralization in soil. Geoderma 2013, 200–201, 156–164. [Google Scholar]
- Gundale M. J.; DeLuca T. H. Temperature and source material influence ecological attributes of ponderosa pine and Douglas-fir charcoal. For. Ecol. Manage. 2006, 2311–386–93. [Google Scholar]
- Knudsen J. N.; Jensen P. A.; Lin W. G.; Frandsen F. J.; Dam-Johansen K. Sulfur transformations during thermal conversion of herbaceous biomass. Energy Fuels 2004, 183810–819. [Google Scholar]
- Cheah S.; Carpenter D. L.; Magrini-Bair K. A. Review of mid- to high-temperature sulfur sorbents for desulfurization of biomass- and coal-derived syngas. Energy Fuels 2009, 23115291–5307. [Google Scholar]
- George G. N.; Gorbaty M. L. Sulfur K-edge X-ray absorption spectroscopy of petroleum asphaltenes and model compounds. J. Am. Chem. Soc. 1989, 11193182–3186. [Google Scholar]
- Jalilehvand F. Sulfur: Not a “silent” element any more. Chem. Soc. Rev. 2006, 35121256–1268. [DOI] [PubMed] [Google Scholar]
- Prietzel J.; Botzaki A.; Tyufekchieva N.; Brettholle M.; Thieme J.; Klysubun W. Sulfur speciation in soil by S K-edge XANES spectroscopy: Comparison of spectral deconvolution and linear combination fitting. Environ. Sci. Technol. 2011, 4572878–2886. [DOI] [PubMed] [Google Scholar]
- Yung M. M.; Cheah S.; Magrini-Bair K.; Kuhn J. N. Transformation of sulfur species during steam/air regeneration on a Ni biomass conditioning catalyst. ACS Catal. 2012, 271363–1367. [Google Scholar]
- Bain R. L.; Dayton D. C.; Carpenter D. L.; Czernik S. R.; Feik C. J.; French R. J.; Magrini-Bair K. A.; Phillips S. D. Evaluation of catalyst deactivation during catalytic steam reforming of biomass-derived syngas. Ind. Eng. Chem. Res. 2005, 44217945–7956. [Google Scholar]
- Sommer K.Sampling of Powders and Bulk Materials; Springer-Verlag: New York, 1986. [Google Scholar]
- ASTM International. ASTM D2492-02 (2012): Standard Test Method for Forms of Sulfur in Coal; ASTM International: West Conshohocken, PA, 2012; p 5, http://www.astm.org/Standards/D2492.htm.
- Shimp N. F.; Kuhn J. K.; Helfinstine R. J. Determination of forms of sulfur in coal. Energy Sources 1977, 3293–109. [Google Scholar]
- Doughten M. W.; Gillison J. R. Determination of selected elements in whole coal and in coal ash from the eight Argonne Premium coal samples by atomic absorption spectrometry, atomic emission spectrometry, and ion-selective electrode. Energy Fuels 1990, 45426–430. [Google Scholar]
- Shadle S. E.; Hedman B.; Hodgson K. O.; Solomon E. I. Ligand K-edge X-ray-absorption spectrocopic studies: Metal-ligand covalency in a series of transition-metal tetrachlorides. J. Am. Chem. Soc. 1995, 11782259–2272. [Google Scholar]
- Webb S. M. SIXpack: A graphical user interface for XAS analysis using IFEFFIT. Phys. Scr. 2005, T115, 1011–1014. [Google Scholar]
- Ravel B.; Newville M. ATHENA, ARTEMIS, HEPHAESTUS: Data analysis for X-ray absorption spectroscopy using IFEFFIT. J. Synchrotron Radiat. 2005, 12, 537–541. [DOI] [PubMed] [Google Scholar]
- European Synchrotron Radiation Facility (ESRF). ID21 Sulfur XANES Spectra Database; ESRF: Grenoble, France, 2013; http://www.esrf.eu/UsersAndScience/Experiments/Imaging/ID21/php.
- Knudsen J. N.; Jensen P. A.; Dam-Johansen K. Transformation and release to the gas phase of Cl, K, and S during combustion of annual biomass. Energy Fuels 2004, 1851385–1399. [Google Scholar]
- Carpenter D. L.; Bain R. L.; Davis R. E.; Dutta A.; Feik C. J.; Gaston K. R.; Jablonski W.; Phillips S. D.; Nimlos M. R. Pilot-scale gasification of corn stover, switchgrass, wheat straw, and wood: 1. Parametric study and comparison with literature. Ind. Eng. Chem. Res. 2010, 4941859–1871. [Google Scholar]
- Cheah S.; Gaston K. R.; Parent Y. O.; Jarvis M. W.; Vinzant T. B.; Smith K. M.; Thornburg N. E.; Nimlos M. R.; Magrini-Bair K. A. Nickel cerium olivine catalyst for catalytic gasification of biomass. Appl. Catal., B 2013, 134–135, 34–45. [Google Scholar]
- Cui H.; Turn S. Q.; Keffer V.; Evans D.; Tran T.; Foley M. Study on the fate of metal elements from biomass in a bench-scale fluidized bed gasifier. Fuel 2013, 108, 1–12. [Google Scholar]
- Elliott D. C. Water, alkali and char in flash pyrolysis oils. Biomass Bioenergy 1994, 71–6179–185. [Google Scholar]
- Turn S. Q. Chemical equilibrium prediction of potassium, sodium, and chlorine concentrations in the product gas from biomass gasification. Ind. Eng. Chem. Res. 2007, 46268928–8937. [Google Scholar]
- Telfer M. A.; Zhang D. K. Investigation of sulfur retention and the effect of inorganic matter during pyrolysis of South Australian low-rank coals. Energy Fuels 1998, 1261135–1141. [Google Scholar]
- Attar A. Chemistry, thermodynamics and kinetics of reactions of sulphur in coal–gas reactions: A review. Fuel 1978, 574201–212. [Google Scholar]
- Cleyle P. J.; Caley W. F.; Stewart L.; whiteway S. G. Decomposition of pyrite and trapping of sulphur in a coal matrix during pyrolysis of coal. Fuel 1984, 63111579–1582. [Google Scholar]
- Medredev K. P.; Petropolskaya V. M. Total separation of sulfur and its varieties in coking of coal charges as studied by a radioisotope method. Sb. Nauchn. Tr., Ukr. Nauchno-Issled. Uglekhim. Inst. 1968, 19, 137–153. [Google Scholar]
- Diebold J. P. A unified, global-model for the pyrolysis of cellulose. Biomass Bioenergy 1994, 71–675–85. [Google Scholar]
- Haas T. J.; Nimlos M. R.; Donohoe B. S. Real-time and post-reaction microscopic structural analysis of biomass undergoing pyrolysis. Energy Fuels 2009, 2373810–3817. [Google Scholar]
- Jarvis M. W.; Haas T. J.; Donohoe B. S.; Daily J. W.; Gaston K. R.; Frederick W. J.; Nimlos M. R. Elucidation of biomass pyrolysis products using a laminar entrained flow reactor and char particle imaging. Energy Fuels 2011, 25, 324–336. [Google Scholar]
- Brewer C. E.; Schmidt-Rohr K.; Satrio J. A.; Brown R. C. Characterization of biochar from fast pyrolysis and gasification systems. Environ. Prog. Sustainable Energy 2009, 283386–396. [Google Scholar]
- Lee J. W.; Kidder M.; Evans B. R.; Paik S.; Buchanan A. C.; Garten C. T.; Brown R. C. Characterization of biochars produced from cornstovers for soil amendment. Environ. Sci. Technol. 2010, 44207970–7974. [DOI] [PubMed] [Google Scholar]
- Keiluweit M.; Nico P. S.; Johnson M. G.; Kleber M. Dynamic molecular structure of plant biomass-derived black carbon (biochar). Environ. Sci. Technol. 2010, 4441247–1253. [DOI] [PubMed] [Google Scholar]
- Stevenson F. J.; Cole M. A.. Cycles of Soil, 2nd ed.; John Wiley and Sons, Inc.: New York, 1999; p 427. [Google Scholar]
Associated Data
This section collects any data citations, data availability statements, or supplementary materials included in this article.
Data Citations
- European Synchrotron Radiation Facility (ESRF). ID21 Sulfur XANES Spectra Database; ESRF: Grenoble, France, 2013; http://www.esrf.eu/UsersAndScience/Experiments/Imaging/ID21/php.