

Abstract
Triclosan (TCS) and triclocarban (TCC) are antimicrobial agents formulated in a wide variety of consumer products (including soaps, toothpaste, medical devices, plastics, and fabrics) that are regulated by the U.S. Food and Drug Administration (FDA) and U.S. Environmental Protection Agency. In late 2014, the FDA will consider regulating the use of both chemicals, which are under scrutiny regarding lack of effectiveness, potential for endocrine disruption, and potential contribution to bacterial resistance to antibiotics. Here, we report on body burdens of TCS and TCC resulting from real-world exposures during pregnancy. Using liquid chromatography tandem mass spectrometry, we determined the concentrations of TCS, TCC, and its human metabolites (2′-hydroxy-TCC and 3′-hydroxy-TCC) as well as the manufacturing byproduct (3′-chloro-TCC) as total concentrations (Σ−) after conjugate hydrolysis in maternal urine and cord blood plasma from a cohort of 181 expecting mother/infant pairs in an urban multiethnic population from Brooklyn, NY recruited in 2007–09. TCS was detected in 100% of urine and 51% of cord blood samples after conjugate hydrolysis. The interquartile range (IQR) of detected TCS concentrations in urine was highly similar to the IQR reported previously for the age-matched population of the National Health and Nutrition Examination Survey (NHANES) from 2003 to 2004, but typically higher than the IQR reported previously for the general population (detection frequency = 74.6%). Urinary levels of TCC are reported here for the first time from real-world exposures during pregnancy, showing a median concentration of 0.21 μg/L. Urinary concentrations of TCC correlated well with its phase-I metabolite ∑-2′-hydroxy-TCC (r = 0.49) and the manufacturing byproduct ∑-3′-chloro-TCC C (r = 0.79), and ∑-2′-hydroxy-TCC correlated strongly with ∑-3′-hydroxy-TCC (r = 0.99). This human biomonitoring study presents the first body burden data for TCC from exposures occurring during pregnancy and provides additional data on composite exposure to TCS (i.e., from both consumer-product use and environmental sources) in the maternal–fetal unit for an urban population in the United States.
Introduction
Triclosan (TCS) and triclocarban (TCC) are chlorinated antimicrobial agents formulated in a wide variety of consumer products, including soaps, toothpaste, medical devices, plastics, and textiles. After having been on the market for over half a century, both chemicals are now under scrutiny in the United States (and abroad) as a result of accumulating evidence regarding their effectiveness, endocrine-disrupting activity, and potential contribution to bacterial resistance to antibiotics.1
TCS and TCC are manufactured in high production volumes, and from previous studies it has become evident that exposure to TCS is prevalent in the general population of the United States [National Health And Nutrition Examination Survey (NHANES) 2003/4, 2003/6, and 2003/8].2−4 TCS has been detected previously in many human matrices, including urine, blood, serum, plasma, human milk, and amniotic fluid.5−9 Exposure to TCS results from topical application of personal care products and devices,10 dermal contact with consumer products,11,12 ingestion of toothpaste, contaminated food and drinking water,13−18 or other environmental exposures such as inhalation of contaminated indoor dust.19 Elective use of TCS-containing products is in all likelihood the most substantial exposure route for human populations. In addition to the endocrine-disrupting effects of TCS20−28 and its associated health outcomes,23,29,30 exposure to the chemical has been associated with health effects that are not necessarily connected with perturbation of the endocrine system. For example, a positive association was found between the total (∑-) urinary levels of TCS and allergy or hay fever diagnosis in children, and with aeroallergens and food sensitization.3,31 TCS was also found to weaken contractibility of cardiac and skeletal muscles in vitro and in vivo in a way that may negatively impact muscle health and function.32
TCC is excreted via urine and stool after direct glucuronidation or after hydroxylation with subsequent glucuronide and sulfate conjugation.33 Total TCC and its phase-I metabolites [2′-hydroxy-TCC (2′-OH-TCC) and 3′-hydroxy-TCC (3′-OH-TCC)] were found previously after phase-II-conjugate hydrolysis in 5.4–28% of 50 urine samples from anonymous volunteers collected in 2010 in Atlanta, GA, and total TCC in about 50% of the 16 serum samples collected between 1998 and 2003 in Tennessee.34 Additionally, three human biomonitoring studies recently reported TCC in 3.77%, 3.6%, and 4% of the human urine samples from Canadian, German, and Greek populations sampled in 2009–2011, 2011, and 2012, respectively.33,35,36 TCC was listed by the California Environmental Contaminant Biomonitoring Program (http://www.biomonitoring.ca.gov/) as a potential candidate for biomonitoring. Yet, publicly available reports on human exposure to TCC in the United States are still scarce and not available for expecting women. This is an important knowledge gap given that (i) TCC-containing products are sold across the country,37 (ii) TCC is commonly found in wastewater across the United States,38 (iii) the compound is known to bioconcentrate,38−41 and (iv) a suite of potentially deleterious effects have been described recently. Since the 1960s it has been known that severe exposure to TCC is associated with neonatal methemoglobinemia and reduced birth weights and reduced fetal survival rates in rats.42,43 More recently, this compound was reported to exhibit endocrine-disrupting functions by enhancing androgen action without exhibiting agonistic activity by itself.26,44−46 In addition, TCC was shown to elicit anti-inflammatory effects, which may be exploited therapeutically by inhibiting soluble epoxide hydrolase in an in vivo murine model.47,48
Here, we aimed to determine the occurrence and total (∑-) concentrations of TCS, TCC, and metabolites and a byproduct of TCC in maternal urine and cord plasma after conjugate hydrolysis in a convenience sample of the United States population. Monitoring of prenatal exposure is an emerging tool for establishing fetal body burdens and revealing potential associations between exposures and adverse health outcomes, including birth defects, neurocognitive delays, and adult onset of disease. The present work concentrated on determining body burdens that were the result of real-world environmental exposures to the antimicrobial agents TCS and TCC in pregnant women from an urban population in Brooklyn, NY.
Materials and Methods
Standards and Reagents
All standards and reagents were purchased in the highest purity available. Native solid standards for TCC (99%) and TCS (>97%) were purchased from Aldrich (Sigma-Aldrich, St. Louis, MO). 13C13-TCC (>99%) and 13C12-TCS (>99%) were obtained from Wellington Laboratories Inc. (Guelph, Ontario, Canada). Phase-I metabolites of TCC, 2′-OH-TCC and 3′-OH-TCC, were provided in kind by Dr. Bruce Hammock (University of California, Davis) and manufactured as previously described.48 Their purity was verified by LC-MS/MS upon arrival in the laboratory. LC-MS-grade (99%) methanol, water, and acetic acid were obtained from Fluka (Buchs, Switzerland), and LC-MS-grade acetone was obtained from Sigma-Aldrich (Sigma-Aldrich, St. Louis, MO). Individual stock solutions of the native and isotopically labeled compounds were prepared in methanol. All stock solutions were stored in glass vials with polyfluorotetraethylene septa at −20 °C.
Cohort and Sampling Procedure
The present study uses a subset of samples collected in the frame of a previous study,49 which details the sampling procedures and cohort descriptors (Table S1, Supporting Information). Briefly, pregnant women (aged 18–45) were invited to participate in the previous study while attending the University Hospital of Brooklyn’s Prenatal Clinic and recruited between October 2007 and December 2009. Random “spot” urine specimens were provided once during the sixth to ninth month of pregnancy. Every woman was followed to delivery, at which time a cord blood specimen was collected from the neonate and stored at −80 °C for subsequent lab analysis. A questionnaire was developed to ascertain demographic data, medical history, mother’s age, nativity, race/ethnic origin, and education level. Health outcome data were collected from the patient’s chart and reported elsewhere.49 The study protocol was approved by the State University of New York Downstate’s Institutional Review Board and by the New York State Department of Health’s Institutional Review Board. Each participant signed an informed consent prior to participation.
Extraction Procedure
Samples were shipped to Arizona State University on dry ice and archived at −80 °C. To perform isotope dilution and hydrolysis of phase-II metabolites of TCS and TCC50 for total concentration determination of TCS, TCC, 2′-OH-TCC, 3′-OH-TCC, and 3′-Cl-TCC, the biological samples (1 mL of material urine or 100 μL of cord blood plasma) were thawed, spiked with a mixed solution of isotope-labeled standards (10 μL) as well as a hydrolysis standard solution (50 μL), and diluted with enzyme solution (1 mL). An additional 900 μL of MS-grade water was added to the cord blood samples. The labeled standards solution contained 13C12-TCS, 13C13-TCC, and 13C4-methylumbelliferone in methanol. The hydrolysis standard solution contained methylumbelliferone-sulfate and methylumbelliferone-glucuronide (Sigma-Aldrich) in water. The enzyme solution contained 0.5 mg/mL of glucuronidase/sulfatase H1 from Helix pomatia (Sigma-Aldrich) in 1 M ammonium acetate (pH 5.0). The mixture was mixed gently and incubated overnight at 37 °C. The target analytes were extracted using a 24-port Visiprep vacuum manifold (Supelco) and 60 mg of Oasis HLB (Waters) solid-phase extraction cartridges that were conditioned with 3 mL of 50:50 methanol/acetone 10 mM acetic acid, equilibrated and washed with 10 mM acetic acid in MS-grade water, dried for 30 min with a gentle air flow, and eluted with 3.5 mL of 50:50 methanol/acetone 10 mM acetic acid. The extracts were blown down to dryness under gentle nitrogen stream at 40 °C using the ReactiVap concentrator (Thermo), reconstituted with 1 mL of methanol, and homogenized in a B3510 Branson ultrasonic cleaner.
Due to our use of enzymes for hydrolysis of conjugated metabolites, the concentrations of the parent compounds, TCS and TCC, presented here represent the sum of the native compounds and their phase-II metabolites that were present in the sample. The concentrations of TCC phase-I metabolites (2′-OH-TCC and 3′-OH-TCC) presented here represent the sum of phase-I metabolites and their phase-II metabolites that were present in the samples. The methylumbelliferone standards were used solely as controls for enzyme activity; they were not used to normalize for intersample variations in the extent of enzymatic hydrolysis of the target analytes.
Chemical Analysis
A Prominence liquid chromatography instrument (Shimadzu) was run at 0.4 mL/min starting at 60% acetonitrile (ACN) with a ramp to 90% ACN over 7 min, held at 90% ACN for 2 min, decreased back to 60% ACN over 1 min, and held at 60% ACN for 3 min. Samples were diluted to a 1:1 ratio with water, and 100 μL was injected. Analytes of interest were separated on an X-Bridge 4.6 × 150 mm C8 column with 3.5 μm particle size (Waters) preceded by an equivalent guard column using a gradient LC protocol and determined using an API 4000 triple-quadrupole mass spectrometer (MS/MS, ABSciex) with electrospray ionization. A switching valve allowed sample to flow to the MS/MS between 4 and 12 min of each 13 min run. Source parameters were set as follows: curtain gas = 25 psi, gas 1 = 70 psi, gas 2 = 50 psi, IS = −4500 eV, temperature = 500 °C, entrance potential (EP) = −10 eV, and collision-activated dissociation (CAD) gas = 12 psi.
Creatinine Determination
Urine aliquots of 2 mL were measured for creatinine onsite at the State University of New York Downstate Medical Center using the Alkaline Picrate Method and a Beckman Olympus Analyzer, model AU-2700 (Beckman Coulter, Inc., Brea, CA). Urinary creatinine adjustment accounts for dilution differences due to diurnal variation of random spot urine specimens collected at various times throughout the day.
Quality Assurance/Quality Control
All analytes and their respective labeled standards were identified using their specific retention time and two multiple reaction monitoring transitions (Table S2, Supporting Information). All extractions were performed along with solvent blanks, reagent blanks, and instrument performance standards. All reported concentrations were determined based on a standard curve containing between 5 and 8 data points homogeneously distributed over about 2–3 orders of magnitude and a coefficient of determination (R2) ≥ 0.99. Average recoveries calculated from experiments performed with nine replicates are provided in the Supporting Information (Table S3, Supporting Information). Method detection limits (MDLs) were determined according to United States Geological Survey and United States Environmental Protection Agency guidelines.51 Instrumental limits of detection (LOD) and quantification (LOQ) were determined according to the EPA guidelines described in 40 CFR 136, Appendix B.52 Data are reported when peak areas were above the lowest concentration calibration standard, when the peak had a signal-to-noise ratio > 3, and when the calculated concentration was higher than both the MDL and LOD. Hence, either the MDL or LOD was used as the reporting limit, depending on which one was higher (Table S3, Supporting Information). All statistical analyses were performed using SPSS v 22 (IBM, Armonk, United States).
Results and Discussion
Urinary Carbanilides
The body burden of TCC during pregnancy is reported for the first time in a United States subpopulation using samples from 181 mother/child pairs that were previously investigated for mercury exposure.49 TCC, its human phase-I metabolites (2′-OH and 3′-OH-TCC), and its manufacturing byproduct, 3′Cl-TCC, were determined after conjugate hydrolysis in maternal spot urine that was collected during routine prenatal visits in the third trimester of pregnancy. Human phase-II metabolites (glucuronide and sulfate adducts of TCC and its phase-I metabolites) (identified previously)34,50 were monitored as TCC and ∑-phase-I metabolites as a result of enzymatic hydrolysis of the chemical bonds with glucuronidases and sulfatases. Table S4, Supporting Information, presents the individual concentrations of all target analytes, per sample type, and per subject.
Excreted TCC was detected in 86.7% (n = 157) of the 181 urine samples, and the concentrations were mostly low (Table 1) compared to those reported previously in urine of volunteers purposefully exposed to the chemical during exposure experiments that involved extended lathering with TCC-containing soap.50 The concentrations of TCC conjugates reported here are conservative in nature, as they may underestimate the total amount of TCC present by approximately 25%; this limitation results from documented inefficiencies of Helix pomatia enzymes in cleaving both TCC-N-glucuronide and TCC-N′-glucuronide when compared to acid hydrolysis.50 Previous human biomonitoring studies reported urinary TCC concentrations in individuals from the United States (n = 50), Canada (n = 2549), Germany (n = 55), and Greece (n = 100).33−36 Compared to these other biomonitoring studies, where urinary TCC was detected only in about 28%, 3.77%, 3.6%, and 4% of the subjects, respectively, our cohort had a substantially greater exposure rate (86.7%). Yet, this finding may be due in part to the higher sensitivity of the method used in this study (Table 1). Our measured urinary concentrations were up to 56 times higher compared to those reported for the Greek cohort, where concentrations ranged between the LOQ of <0.5 and 1.9 μg/L, with a geometric mean of 0.6 μg/L.35 The Canadian study did not report numerical concentration data.
Table 1. Urinary Concentrations of Total (∑-) Triclosan and Carbanilides Observed in a Multiethnic Urban Population from Brooklyn, NY (n = 181)a.
| concentration
(μg/L) |
|||||||||||
|---|---|---|---|---|---|---|---|---|---|---|---|
| percentiles |
|||||||||||
| >MDL (%) | mean ± std. err. | IQR | 5th | 10th | 25th | 50th | 75th | 90th | 95th | 95% CI | |
| TCS | 100 | 163.37 ± 68.82 | 37.64 | 0.88 | 1.21 | 2.73 | 9.16 | 40.37 | 273.33 | 624.80 | 27.57–299.17 |
| 94.46 ± 28.91 | 31.00 | 0.62 | 1.02 | 1.93 | 7.22 | 32.93 | 285.52 | 475.86 | 37.38–151.54 | ||
| TCC | 86.7 | 4.04 ± 1.05 | 0.88 | <0.02 | <0.02 | 0.06 | 0.21 | 0.94 | 7.44 | 27.11 | 1.98–6.11 |
| 2.85 ± 0.73 | 0.59 | <0.02 | <0.02 | 0.05 | 0.17 | 0.64 | 6.29 | 16.97 | 1.41–4.29 | ||
| 2′-OH-TCC | 27.1 | 0.24 ± 0.11 | 0.01 | <0.01 | <0.01 | <0.01 | <0.01 | <0.01 | 0.17 | 0.81 | 0.02–0.46 |
| 0.14 ± 0.06 | 0.01 | <0.01 | <0.01 | <0.01 | <0.01 | 0.01 | 0.13 | 0.53 | 0.03–0.26 | ||
| 3′-OH-TCC | 16.6 | 0.04 ± 0.02 | <0.01 | <0.01 | <0.01 | <0.01 | <0.01 | <0.01 | 0.02 | 0.12 | 0.01–0.08 |
| 0.03 ± 0.01 | <0.01 | <0.01 | <0.01 | <0.01 | <0.01 | <0.01 | 0.02 | 0.09 | 0.01–0.05 | ||
| 3′-Cl-TCC | 12.7 | 0.01 ± 0.01 | <0.01 | <0.01 | <0.01 | <0.01 | <0.01 | <0.01 | 0.01 | 0.04 | <0.01–0.02 |
| 0.01 ± <0.01 | <0.01 | <0.01 | <0.01 | <0.01 | <0.01 | <0.01 | 0.02 | 0.04 | <0.01–0.02 | ||
The first and second line present the concentrations for each analyte in μg/L urine and μg/g creatinine, respectively. CI: Confidence interval. IQR: Interquartile range. MDL: Method detection limit. std. err.: Standard error.
The phase-I metabolites of TCC, specifically ∑-2′-OH-TCC and ∑-3′-OH-TCC, were detected after conjugate hydrolysis in the urine of 27.1% (n = 49) and 16.6% (n = 30) of the 181 study participants, respectively. In the majority of subjects where ∑-2′-OH-TCC was detected, 2′-OH-TCC was found together with TCC (46 out of 49), whereas in 1 of those 3 remaining subjects, ∑-2′-OH-TCC was detected alongside ∑-3′-OH-TCC but no parent compound was detected. In almost all participants where ∑-3′-OH-TCC was detected, it was found together with both TCC and ∑-2′-OH-TCC (28 out of 30). In the two remaining participants (2 out of 30), ∑-3′-OH-TCC was detected at elevated concentrations (4.00 μg/L) alongside TCC at 0.03 μg/L in one case, and ∑-3′-OH-TCC was detected together with ∑-2′-OH-TCC (0.11 μg/L) in the second case (Table S4, Supporting Information). The manufacturing byproduct of TCC, 3′-Cl-TCC, was detected in 12.7% (n = 23) of the participants, and for the large majority of those participants (n = 19) in co-occurrence with TCC, ∑-2′-OH-TCC, and ∑-3′-OH-TCC.
The expected parent-metabolite/byproduct relationships were investigated by means of correlation analysis (Figure 1), where data was only plotted when both investigated contaminants were detected for a study subject. Urinary TCC concentrations correlated positively with levels of its principal phase-I metabolite, ∑-2′-OH-TCC (Pearson’s r = 0.49). The mass-based ∑-2′-OH-TCC to TCC ratios ranged from 0.004 to 1.01, with a median value of 0.06, and are generally lower compared to those observed previously in human urine following showering experiments with TCC containing soap.50 In the referenced study, the ∑-2′-OH-TCC to TCC ratio reached up to approximately 1.00 within a couple of hours after exposure.50 On the basis of the previously determined elimination rates of ∑-2′-OH-TCC and TCC,50 the lower ∑-2′-OH-TCC to TCC ratios observed here suggest that exposure was less recent for the lower bracket (0.004–0.06) and more recent for the higher bracket (0.06–1.01) due to slower excretion of TCC compared to ∑-2′-OH-TCC. In addition to ∑-2′-OH-TCC, ∑-3′-OH-TCC was also observed in our cohort, even though urinary ∑-3′-OH-TCC could not be quantified previously.50 This difference between both studies is likely the result of our larger cohort size and the greater inherent genetic and environmental variability. In fact, the total concentrations of the two phase-I metabolites, 2′-OH-TCC and 3′-OH-TCC, correlated very well over more than 3 orders of magnitude with high correlation coefficients (Pearson’s r = 0.99). Finally, urinary TCC correlated positively with urinary ∑-3′-Cl-TCC (Pearson’s r = 0.79). Taken together, these correlation experiments illustrate the strength of monitoring for phase-I metabolites and byproducts following conjugate hydrolysis. They also show that increasing excretion of TCC (and thus increasing exposure to the parent compound) will result in concomitant formation and excretion of its metabolites, as well as excretion of its manufacturing byproduct, 3′-Cl-TCC, in a fraction of the participants (Figure 1). Yet, urinary concentration of the parent compound may be a more reliable measure of exposure since intrasubject variability of the metabolite was high in this study, as indicated by the fact that phase-I metabolites were not detected in all subjects as well as by the variability in the ratios of the metabolites to the parent compound.
Figure 1.
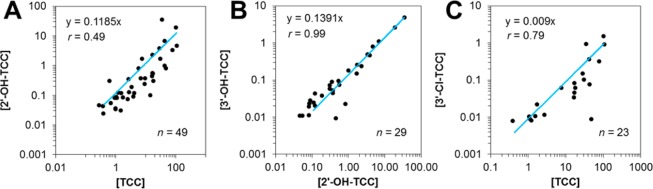
Correlation analysis of the urinary total (∑-) concentrations of (A) TCC with its human phase-I metabolite, 2′-OH-TCC, and (B) the two phase-I metabolites, 2′-OH-TCC and 3′-OH-TCC, as well as (C) TCC with its manufacturing byproduct (3′-Cl-TCC). All concentrations are expressed in units of μg/L.
Urinary Triclosan
TCS was detected in the urine of all participants (100%) after conjugate hydrolysis and at substantially higher concentrations compared to TCC (Figure 2). Of the 157 subjects where both TCS and TCC were found in urine, 138 participants (87.9%) excreted higher concentrations of TCS compared to TCC. Urinary TCS concentrations were previously shown to vary only slightly during pregnancy;9 therefore, the detection frequencies and concentration ranges presented here are deemed representative of the values expected throughout the pregnancy. In addition, the fact that there is no apparent trend in the co-occurrence of urinary TCS and TCC (Pearson’s r = 0.03; Figure 2) suggests that the strong correlation observed previously between both chemicals in U.S. environmental surface water systems (R2 = 0.99)53 was probably not due to equivalent use of both products by individual consumers, rather equivalent use (and discharge) of both chemicals in the human population (served by the wastewater treatment plants that discharged effluent to the surveyed rivers).
Figure 2.
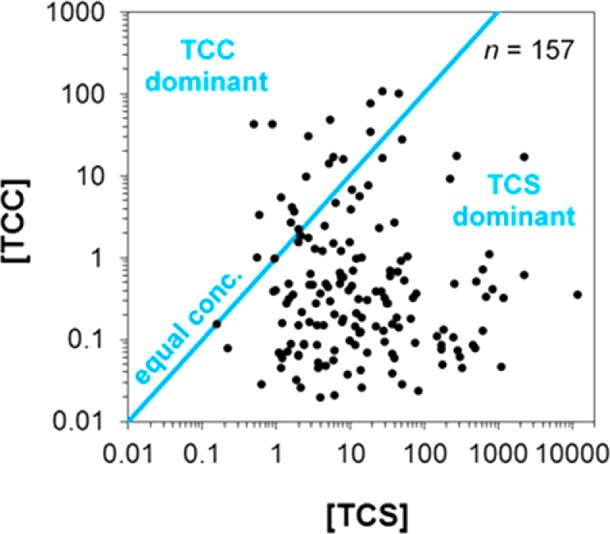
Relation between total (∑-) concentrations of TCS and TCC detected in maternal urine from 157 (86.7% of all) participants. Data are presented only when both chemicals were found at detectable levels (≥0.10 μg/L for TCS and ≥0.02 μg/L for TCC). Blue line depicts a hypothetical scenario of equal levels of TCS and TCC. All concentrations are expressed in units of μg/L.
TCS exposure has been studied extensively in biomonitoring studies using cohorts from across the globe2,3,9,29,31,35,54−58 but seldom in relation to prenatal exposure.9,55,59 Figure 3 shows that compared to the general population of the United States, our urban population of expecting women is exposed to substantially higher concentrations of TCS and at a higher frequency (100% compared to 74.6%).2 Yet, the interquartile range (i.e., the distance between 25th and 75th percentiles) in this study is highly similar to the age-matched subpopulation of the United States population reported previously (Figure 3).2
Figure 3.
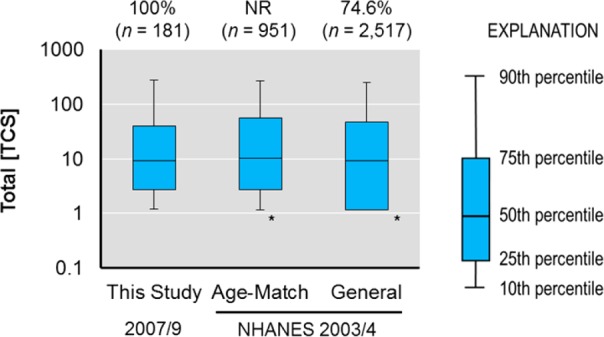
Urinary total (∑-) concentrations of TCS in the urban cohort (n = 181) compared to the age-matched subpopulation and general population in the NHANES cohort reported previously.2 The asterisk (*) shows when plots were truncated at LOD/2 when values were < LOD (2.3 μg/L).2 MDL = 0.10 μg/L and LOD = 0.025 μg/L for the current study. NR = not reported. Concentrations are expressed in units of μg/L.
Urine-Cord Plasma Relation
Our study was also aimed at determining the levels of total TCS and TCC (i.e., after conjugate hydrolysis) in cord blood plasma sampled at birth. Cord plasma samples were available for 33 participants (18.2%) of the 181 subjects that provided urine samples. TCC and TCS were detected in 8 (22.9%) and 16 samples (45.7%), respectively, of all cord plasma samples (n = 35). Both TCC and TCS were found to co-occur in 5 cord plasma samples (14.3%). No free TCS or TCC was detected in the cord plasma samples that tested positive for either analyte after conjugate hydrolysis. This finding suggests that all contaminants occurred as phase II conjugates and that no contamination occurred during sampling. One may argue that, because both matrices were sampled at different dates, urine and cord plasma might allow time discrete analysis of exposure. Hence, a correlation analysis of urinary and cord plasma concentrations for TCS and TCC was performed. This analysis demonstrated that the maternal urinary concentrations during the third trimester are poor predictors of fetal exposure via cord blood at birth (Figure 4). This observation was expected because both TCS and TCC are rapidly excreted after their absorption. Hence, even minor changes in product use or the time between exposure and sampling events will strongly affect their levels in urine as well as in cord blood plasma. Still, urine and cord blood are relevant matrices for monitoring excreted organic chemicals such as TCS and TCC during the third trimester, and our sample storage times were also adequate.60 In fact, the relevance of maternal urine as an indicator for fetal exposure may be increased with an improved study design, such as when maternal urine is collected closer to the time of delivery. We conclude that the limitations of our correlation analysis were that (i) urine and cord blood plasma were sampled at different time points and changes in product use or pharmacokinetics might be at the root of the strong variability, (ii) urine and cord blood plasma are two distinct matrices not necessarily providing a similar measure of exposure, (iii) analysis of cord blood plasma was 10× less sensitive due to small sample volumes, because the amount of sample available was limited in volume, and more detects might have yielded a better correlation, and (iv) cord blood plasma was sampled instead of whole cord blood. Though many other studies have reported using plasma for analysis of TCS and TCC exposure,7,61−64 future work should consider a previous study65 that suggests whole blood can be better suited as a matrix for analysis of hydrophobic contaminants [log P (n-octanol–water partition coefficient) = 4.8 and 4.9 for TCS and TCC, respectively].53
Figure 4.
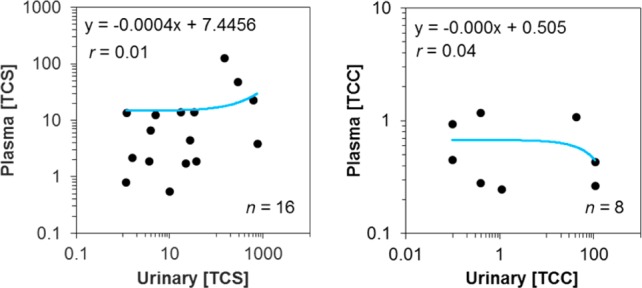
Correlation analysis of measured total (∑-) concentrations of TCS (n = 16) and TCC (n = 8) in maternal urine and cord blood plasma sampled between 6 and 9 months and at birth, respectively. Data were plotted only when the analytes were detected in both matrices from a study subject. All concentrations are expressed in units of μg/L.
Supported by a previous study,34 this work suggests that the U.S. population has a substantially higher degree of exposure to TCC compared to Canadian, Greek, and German populations (though the use of disparate methods between the different studies precludes making definitive conclusions on TCC exposure across the globe). Hence, the current study begins to fill an important data gap regarding knowledge of real-world body burdens of TCS and TCC originating from diverse environmental sources, including consumer products. It provided the first TCC biomonitoring data during pregnancy and reinforced the notion that TCS exposure is ubiquitous in the United States population, even in expecting mothers and their unborn children. In conclusion, our data suggest that a larger fraction of expecting women are vulnerable to potential TCS- and TCC-induced health outcomes compared to the general United States population due to a substantially higher frequency and extent of exposure. Future investigations should address the associations between adverse health outcomes and fetal exposures to TCS, TCC, their metabolites, and byproducts.
Acknowledgments
This project was supported in part by Award Numbers R01ES015445 and 1R01ES020889 from the National Institute of Environmental Health Sciences (NIEHS). The content is solely the responsibility of the authors and does not necessarily represent the official views of the NIEHS or the National Institutes of Health (NIH). This initial study was funded by the New York Community Trust. The sponsors had no role in the study outside of funding. The authors would like to thank Dr. Nicole Hansmeier for assistance with preparing the TOC art.
Supporting Information Available
The Supporting Information contains the descriptive statistics of the study population, an overview of the LC and MS parameters, and method performance characteristics, as well as the individual concentrations of all analytes per sample type, and per participant. This material is available free of charge via the Internet at http://pubs.acs.org.
The authors declare no competing financial interest.
Funding Statement
National Institutes of Health, United States
Supplementary Material
References
- Halden R. U. On the Need and Speed of Regulating Triclosan and Triclocarban in the United States. Environ. Sci. Technol. 2014, 4873603–3611. [DOI] [PMC free article] [PubMed] [Google Scholar]
- Calafat A. M.; Ye X.; Wong L. Y.; Reidy J. A.; Needham L. L. Urinary concentrations of triclosan in the U.S. population: 2003–2004. Environ. Health Perspect 2008, 1163303–7. [DOI] [PMC free article] [PubMed] [Google Scholar]
- Clayton E. M.; Todd M.; Dowd J. B.; Aiello A. E. The impact of bisphenol A and triclosan on immune parameters in the U.S. population, NHANES 2003–2006. Environ. Health Perspect. 2011, 1193390–6. [DOI] [PMC free article] [PubMed] [Google Scholar]
- Lankester J.; Patel C.; Cullen M. R.; Ley C.; Parsonnet J. Urinary Triclosan is Associated with Elevated Body Mass Index in NHANES. PLoS One 2013, 811e80057. [DOI] [PMC free article] [PubMed] [Google Scholar]
- Sandborgh-Englund G.; Adolfsson-Erici M.; Odham G.; Ekstrand J. Pharmacokinetics of triclosan following oral ingestion in humans. J. Toxicol Environ. Health A 2006, 69201861–73. [DOI] [PubMed] [Google Scholar]
- Allmyr M.; Harden F.; Toms L. M.; Mueller J. F.; McLachlan M. S.; Adolfsson-Erici M.; Sandborgh-Englund G. The influence of age and gender on triclosan concentrations in Australian human blood serum. Sci. Total Environ. 2008, 3931162–7. [DOI] [PubMed] [Google Scholar]
- Allmyr M.; Adolfsson-Erici M.; McLachlan M. S.; Sandborgh-Englund G. Triclosan in plasma and milk from Swedish nursing mothers and their exposure via personal care products. Sci. Total Environ. 2006, 372187–93. [DOI] [PubMed] [Google Scholar]
- Toms L. M.; Allmyr M.; Mueller J. F.; Adolfsson-Erici M.; McLachlan M.; Murby J.; Harden F. A. Triclosan in individual human milk samples from Australia. Chemosphere 2011, 85111682–6. [DOI] [PubMed] [Google Scholar]
- Philippat C.; Wolff M. S.; Calafat A. M.; Ye X.; Bausell R.; Meadows M.; Stone J.; Slama R.; Engel S. M. Prenatal exposure to environmental phenols: concentrations in amniotic fluid and variability in urinary concentrations during pregnancy. Environ. Health Perspect. 2013, 121101225–31. [DOI] [PMC free article] [PubMed] [Google Scholar]
- Queckenberg C.; Meins J.; Wachall B.; Doroshyenko O.; Tomalik-Scharte D.; Bastian B.; Abdel-Tawab M.; Fuhr U. Absorption, pharmacokinetics, and safety of triclosan after dermal administration. Antimicrob. Agents Chemother. 2010, 541570–2. [DOI] [PMC free article] [PubMed] [Google Scholar]
- Bhargava H. N.; Leonard P. A. Triclosan: applications and safety. Am. J. Infect. Control 1996, 243209–18. [DOI] [PubMed] [Google Scholar]
- Moss T.; Howes D.; Williams F. M. Percutaneous penetration and dermal metabolism of triclosan (2,4, 4′-trichloro-2′-hydroxydiphenyl ether). Food Chem. Toxicol. 2000, 384361–70. [DOI] [PubMed] [Google Scholar]
- Li X.; Ying G. G.; Su H. C.; Yang X. B.; Wang L. Simultaneous determination and assessment of 4-nonylphenol, bisphenol A and triclosan in tap water, bottled water and baby bottles. Environ. Int. 2010, 366557–62. [DOI] [PubMed] [Google Scholar]
- Loraine G. A.; Pettigrove M. E. Seasonal variations in concentrations of pharmaceuticals and personal care products in drinking water and reclaimed wastewater in southern California. Environ. Sci. Technol. 2006, 403687–95. [DOI] [PubMed] [Google Scholar]
- Wu X.; Ernst F.; Conkle J. L.; Gan J. Comparative uptake and translocation of pharmaceutical and personal care products (PPCPs) by common vegetables. Environ. Int. 2013, 60, 15–22. [DOI] [PubMed] [Google Scholar]
- Holling C. S.; Bailey J. L.; Vanden Heuvel B.; Kinney C. A. Uptake of human pharmaceuticals and personal care products by cabbage (Brassica campestris) from fortified and biosolids-amended soils. J. Environ. Monit. 2012, 14113029–36. [DOI] [PubMed] [Google Scholar]
- Macherius A.; Eggen T.; Lorenz W.; Moeder M.; Ondruschka J.; Reemtsma T. Metabolization of the bacteriostatic agent triclosan in edible plants and its consequences for plant uptake assessment. Environ. Sci. Technol. 2012, 461910797–804. [DOI] [PubMed] [Google Scholar]
- Wu C.; Spongberg A. L.; Witter J. D.; Fang M.; Czajkowski K. P. Uptake of pharmaceutical and personal care products by soybean plants from soils applied with biosolids and irrigated with contaminated water. Environ. Sci. Technol. 2010, 44166157–61. [DOI] [PubMed] [Google Scholar]
- Geens T.; Roosens L.; Neels H.; Covaci A. Assessment of human exposure to Bisphenol-A, Triclosan and Tetrabromobisphenol-A through indoor dust intake in Belgium. Chemosphere 2009, 766755–60. [DOI] [PubMed] [Google Scholar]
- Gee R. H.; Charles A.; Taylor N.; Darbre P. D. Oestrogenic and androgenic activity of triclosan in breast cancer cells. J. Appl. Toxicol. 2008, 28178–91. [DOI] [PubMed] [Google Scholar]
- Butt C. M.; Wang D.; Stapleton H. M. Halogenated phenolic contaminants inhibit the in vitro activity of the thyroid-regulating deiodinases in human liver. Toxicol. Sci. 2011, 1242339–47. [DOI] [PMC free article] [PubMed] [Google Scholar]
- Kumar V.; Balomajumder C.; Roy P. Disruption of LH-induced testosterone biosynthesis in testicular Leydig cells by triclosan: probable mechanism of action. Toxicology 2008, 2502–3124–31. [DOI] [PubMed] [Google Scholar]
- Lan Z.; Hyung Kim T.; Shun Bi K.; Hui Chen X.; Sik Kim H. Triclosan exhibits a tendency to accumulate in the epididymis and shows sperm toxicity in male sprague-dawley rats. Environ. Toxicol. 2013, published online Aug 9, 2013 10.1002/tox.21897. [DOI] [PubMed] [Google Scholar]
- Louis G. W.; Hallinger D. R.; Stoker T. E. The effect of triclosan on the uterotrophic response to extended doses of ethinyl estradiol in the weanling rat. Reprod. Toxicol. 2013, 36, 71–7. [DOI] [PubMed] [Google Scholar]
- Stoker T. E.; Gibson E. K.; Zorrilla L. M. Triclosan exposure modulates estrogen-dependent responses in the female wistar rat. Toxicol. Sci. 2010, 117145–53. [DOI] [PubMed] [Google Scholar]
- Tarnow P.; Tralau T.; Hunecke D.; Luch A. Effects of triclocarban on the transcription of estrogen, androgen and aryl hydrocarbon receptor responsive genes in human breast cancer cells. Toxicol. in Vitro 2013, 2751467–75. [DOI] [PubMed] [Google Scholar]
- James M. O.; Li W.; Summerlot D. P.; Rowland-Faux L.; Wood C. E. Triclosan is a potent inhibitor of estradiol and estrone sulfonation in sheep placenta. Environ. Int. 2010, 368942–9. [DOI] [PMC free article] [PubMed] [Google Scholar]
- Zorrilla L. M.; Gibson E. K.; Jeffay S. C.; Crofton K. M.; Setzer W. R.; Cooper R. L.; Stoker T. E. The effects of triclosan on puberty and thyroid hormones in male Wistar rats. Toxicol. Sci. 2009, 107156–64. [DOI] [PubMed] [Google Scholar]
- Buttke D. E.; Sircar K.; Martin C. Exposures to endocrine-disrupting chemicals and age of menarche in adolescent girls in NHANES (2003–2008). Environ. Health Perspect. 2012, 120111613–8. [DOI] [PMC free article] [PubMed] [Google Scholar]
- Chen M.; Tang R.; Fu G.; Xu B.; Zhu P.; Qiao S.; Chen X.; Xu B.; Qin Y.; Lu C.; Hang B.; Xia Y.; Wang X. Association of exposure to phenols and idiopathic male infertility. J. Hazard. Mater. 2013, 250–251, 115–21. [DOI] [PubMed] [Google Scholar]
- Savage J. H.; Matsui E. C.; Wood R. A.; Keet C. A. Urinary levels of triclosan and parabens are associated with aeroallergen and food sensitization. J. Allergy Clin. Immunol. 2012, 1302453–60 e7. [DOI] [PMC free article] [PubMed] [Google Scholar]
- Cherednichenko G.; Zhang R.; Bannister R. A.; Timofeyev V.; Li N.; Fritsch E. B.; Feng W.; Barrientos G. C.; Schebb N. H.; Hammock B. D.; Beam K. G.; Chiamvimonvat N.; Pessah I. N. Triclosan impairs excitation-contraction coupling and Ca2+ dynamics in striated muscle. Proc. Natl. Acad. Sci. U.S.A. 2012, 1093514158–63. [DOI] [PMC free article] [PubMed] [Google Scholar]
- Health Canada. Second report on human biomonitoring of environmental chemicals in Canada - Results of the Canadian health measures survey cycle 2 (2009–2011); Health Canada: Ottawa, ON, Apr 2013; p 444. [Google Scholar]
- Ye X.; Zhou X.; Furr J.; Ahn K. C.; Hammock B. D.; Gray E. L.; Calafat A. M. Biomarkers of exposure to triclocarban in urine and serum. Toxicology 2011, 2861–369–74. [DOI] [PMC free article] [PubMed] [Google Scholar]
- Asimakopoulos A. G.; Thomaidis N. S.; Kannan K. Widespread occurrence of bisphenol A diglycidyl ethers, p-hydroxybenzoic acid esters (parabens), benzophenone type-UV filters, triclosan, and triclocarban in human urine from Athens, Greece. Sci. Total Environ. 2014, 470–471, 1243–9. [DOI] [PubMed] [Google Scholar]
- Moos R. K.; Modick H.; Angerer J.; Bruning T.; Koch H. M., Human Biomonitoring of parabens and other phenols in the general German population. 22nd Annual Meeting of the International Society of Exposure Science, Seattle, WA, 2012. Avaliable online at: http://isesweb.org/Meetings/Docs/2012AbstractBook.pdf.
- Perencevich E. N.; Wong M. T.; Harris A. D. National and regional assessment of the antibacterial soap market: a step toward determining the impact of prevalent antibacterial soaps. Am. J. Infect. Control 2001, 295281–3. [DOI] [PubMed] [Google Scholar]
- Heidler J.; Halden R. U. Fate of organohalogens in US wastewater treatment plants and estimated chemical releases to soils nationwide from biosolids recycling. J. Environ. Monit. 2009, 11122207–15. [DOI] [PMC free article] [PubMed] [Google Scholar]
- Gautam P.; Carsella J. S.; Kinney C. A. Presence and transport of the antimicrobials triclocarban and triclosan in a wastewater-dominated stream and freshwater environment. Water Res. 2014, 48, 247–56. [DOI] [PubMed] [Google Scholar]
- Venkatesan A. K.; Pycke B. F.; Barber L. B.; Lee K. E.; Halden R. U. Occurrence of triclosan, triclocarban, and its lesser chlorinated congeners in Minnesota freshwater sediments collected near wastewater treatment plants. J. Hazard. Mater. 2012, 229–230, 29–35. [DOI] [PMC free article] [PubMed] [Google Scholar]
- Schebb N. H.; Flores I.; Kurobe T.; Franze B.; Ranganathan A.; Hammock B. D.; Teh S. J. Bioconcentration, metabolism and excretion of triclocarban in larval Qurt medaka (Oryzias latipes). Aquat. Toxicol. 2011, 1053–4448–54. [DOI] [PMC free article] [PubMed] [Google Scholar]
- Berger C.; Marsala J.; Salle B.; Teyssier G.; Mazauric B.; Rascle J. An “epidemic” of toxic neonatal methemoglobinemia due to the use of an ointment containing trichlorocarbanilide. Ann. Pediatr. (Paris) 1978, 25145–50. [PubMed] [Google Scholar]
- Nolen G. A.; Dierckman T. A. Reproduction and teratogenic studies of a 2:1 mixture of 3,4,4′-trichlorocarbanilide and 3-trifluoromethyl-4,4′-dichlorocarbanilide in rats and rabbits. Toxicol. Appl. Pharmacol. 1979, 513417–25. [DOI] [PubMed] [Google Scholar]
- Chen J.; Ahn K. C.; Gee N. A.; Ahmed M. I.; Duleba A. J.; Zhao L.; Gee S. J.; Hammock B. D.; Lasley B. L. Triclocarban enhances testosterone action: a new type of endocrine disruptor?. Endocrinology 2008, 14931173–9. [DOI] [PMC free article] [PubMed] [Google Scholar]
- Ahn K. C.; Zhao B.; Chen J.; Cherednichenko G.; Sanmarti E.; Denison M. S.; Lasley B.; Pessah I. N.; Kultz D.; Chang D. P.; Gee S. J.; Hammock B. D. In vitro biologic activities of the antimicrobials triclocarban, its analogs, and triclosan in bioassay screens: receptor-based bioassay screens. Environ. Health Perspect. 2008, 11691203–10. [DOI] [PMC free article] [PubMed] [Google Scholar]
- Yueh M. F.; Li T.; Evans R. M.; Hammock B.; Tukey R. H. Triclocarban mediates induction of xenobiotic metabolism through activation of the constitutive androstane receptor and the estrogen receptor alpha. PLoS One 2012, 76e37705. [DOI] [PMC free article] [PubMed] [Google Scholar]
- Liu J. Y.; Qiu H.; Morisseau C.; Hwang S. H.; Tsai H. J.; Ulu A.; Chiamvimonvat N.; Hammock B. D. Inhibition of soluble epoxide hydrolase contributes to the anti-inflammatory effect of antimicrobial triclocarban in a murine model. Toxicol. Appl. Pharmacol. 2011, 2552200–6. [DOI] [PMC free article] [PubMed] [Google Scholar]
- Schebb N. H.; Inceoglu B.; Ahn K. C.; Morisseau C.; Gee S. J.; Hammock B. D. Investigation of human exposure to triclocarban after showering and preliminary evaluation of its biological effects. Environ. Sci. Technol. 2011, 4573109–15. [DOI] [PMC free article] [PubMed] [Google Scholar]
- Geer L. A.; Persad M. D.; Palmer C. D.; Steuerwald A. J.; Dalloul M.; Abulafia O.; Parsons P. J. Assessment of prenatal mercury exposure in a predominately Caribbean immigrant community in Brooklyn, NY. J. Environ. Monit 2012, 1431035–43. [DOI] [PubMed] [Google Scholar]
- Schebb N. H.; Inceoglu B.; Ahn K. C.; Morisseau C.; Gee S. J.; Hammock B. D. Investigation of Human Exposure to Triclocarban after Showering and Preliminary Evaluation of Its Biological Effects. Environ. Sci. Technol. 2011, 4573109–3115. [DOI] [PMC free article] [PubMed] [Google Scholar]
- Oblinger C. J.; Foreman W. T.; Connor B. F.; Maloney T. J.. New reporting procedures based on long-term method detection levels and some considerations for interpretations of water-quality data provided by the U.S. Geological Survey National Water Quality Laboratory; U.S. Geological Survey: Reston, VA, 1999. [Google Scholar]
- USEPA Appendix B to Part 136-Definition and procedure for the determination of the method detection limit-revision 1.11; October 26, 1984.
- Halden R. U.; Paull D. H. Co-occurrence of triclocarban and triclosan in U.S. water resources. Environ. Sci. Technol. 2005, 3961420–6. [DOI] [PubMed] [Google Scholar]
- Bertelsen R. J.; Longnecker M. P.; Lovik M.; Calafat A. M.; Carlsen K. H.; London S. J.; Lodrup Carlsen K. C. Triclosan exposure and allergic sensitization in Norwegian children. Allergy 2013, 68184–91. [DOI] [PMC free article] [PubMed] [Google Scholar]
- Frederiksen H.; Nielsen J. K.; Morck T. A.; Hansen P. W.; Jensen J. F.; Nielsen O.; Andersson A. M.; Knudsen L. E. Urinary excretion of phthalate metabolites, phenols and parabens in rural and urban Danish mother-child pairs. Int. J. Hyg. Environ. Health 2013, 2166772–83. [DOI] [PubMed] [Google Scholar]
- Kim K.; Park H.; Yang W.; Lee J. H. Urinary concentrations of bisphenol A and triclosan and associations with demographic factors in the Korean population. Environ. Res. 2011, 11181280–5. [DOI] [PubMed] [Google Scholar]
- Li X.; Ying G. G.; Zhao J. L.; Chen Z. F.; Lai H. J.; Su H. C. 4-Nonylphenol, bisphenol-A and triclosan levels in human urine of children and students in China, and the effects of drinking these bottled materials on the levels. Environ. Int. 2013, 52, 81–6. [DOI] [PubMed] [Google Scholar]
- Pirard C.; Sagot C.; Deville M.; Dubois N.; Charlier C. Urinary levels of bisphenol A, triclosan and 4-nonylphenol in a general Belgian population. Environ. Int. 2012, 48, 78–83. [DOI] [PubMed] [Google Scholar]
- Bertelsen R. J.; Engel S. M.; Jusko T. A.; Calafat A. M.; Hoppin J. A.; London S. J.; Eggesbo M.; Aase H.; Zeiner P.; Reichborn-Kjennerud T.; Knudsen G. P.; Guidry V. T.; Longnecker M. P. Reliability of triclosan measures in repeated urine samples from Norwegian pregnant women. J. Exposure Sci. Environ. Epidemiol. 2014, published online Jan 29, 2014 10.1038/jes.2013.95. [DOI] [PMC free article] [PubMed] [Google Scholar]
- Barr D. B.; Wang R. Y.; Needham L. L. Biologic monitoring of exposure to environmental chemicals throughout the life stages: requirements and issues for consideration for the National Children’s Study. Environ. Health Perspect. 2005, 11381083–91. [DOI] [PMC free article] [PubMed] [Google Scholar]
- Allmyr M.; McLachlan M. S.; Sandborgh-Englund G.; Adolfsson-Erici M. Determination of triclosan as its pentafluorobenzoyl ester in human plasma and milk using electron capture negative ionization mass spectrometry. Anal. Chem. 2006, 78186542–6. [DOI] [PubMed] [Google Scholar]
- Hovander L.; Malmberg T.; Athanasiadou M.; Athanassiadis I.; Rahm S.; Bergman A.; Wehler E. K. Identification of hydroxylated PCB metabolites and other phenolic halogenated pollutants in human blood plasma. Arch. Environ. Contam. Toxicol. 2002, 421105–17. [DOI] [PubMed] [Google Scholar]
- Sioufi A.; Caudal F.; Grimault D. GLC determination of free and conjugated triclosan in human plasma and urine. J. Pharm. Sci. 1977, 6681166–8. [DOI] [PubMed] [Google Scholar]
- Wu J.; Yue H.; Cai Z. Investigation on metabolism and pharmacokinetics of triclosan in rat plasma by using UPLC-triple quadrupole MS. Se Pu 2009, 275724–30(Chinese Journal of Chromatography). [PubMed] [Google Scholar]
- Schebb N. H.; Ahn K. C.; Dong H.; Gee S. J.; Hammock B. D. Whole blood is the sample matrix of choice for monitoring systemic triclocarban levels. Chemosphere 2012, 877825–827. [DOI] [PMC free article] [PubMed] [Google Scholar]
Associated Data
This section collects any data citations, data availability statements, or supplementary materials included in this article.