

Abstract
Objective
Non-alcoholic fatty liver disease (NAFLD) is an obesity-related condition associated with cardiovascular mortality. Yet, whether or not NAFLD is independently related to atherosclerosis is unclear. In a population-based cross-sectional sample of middle-aged adults free from liver or heart disease, we tested the hypothesis that NAFLD is associated with subclinical atherosclerosis (coronary artery (CAC) and abdominal aortic calcification (AAC)) independent of obesity.
Methods
Participants from the Coronary Artery Risk Development in Young Adults study with CT quantification of liver fat, CAC and AAC were included (n=2,424). NAFLD was defined as liver attenuation ≤ 40 Hounsfield Units after exclusion of other causes of liver fat. CAC and AAC presence was defined as Agatston score > 0.
Results
Mean participant age was 50.1±3.6 years, (42.7% men, 50.0% black) and BMI was 30.6±7.2 kg/m2. The prevalence of NAFLD, CAC, and AAC was 9.6%, 27.1%, and 51.4%. NAFLD participants had increased prevalence of CAC (37.9% vs. 26.0%, p<0.001) and AAC (65.1% vs. 49.9%, p<0.001). NAFLD remained associated with CAC (OR, 1.33; 95% CI, 1.001–1.82) and AAC (OR, 1.74; 95% CI, 1.29–2.35) after adjustment for demographics and health behaviors. However, these associations were attenuated after additional adjustment for visceral adipose tissue (CAC OR, 1.05; 95% CI, 0.74–1.48, AAC OR=1.20; 95% CI, 0.86–1.67). There was no interaction by race or sex.
Conclusion
In contrast to prior research, these findings suggest that obesity attenuates the relationship between NAFLD and subclinical atherosclerosis. Further studies evaluating the role of NAFLD duration on atherosclerotic progression and cardiovascular events are needed.
Keywords: calcium, cardiovascular diseases, epidemiology, imaging, liver, obesity, risk factors
INTRODUCTION
Non-alcoholic fatty liver disease (NAFLD) is the most common cause of abnormal liver enzymes in the U.S., with a prevalence of 10–30% worldwide(1). NAFLD represents a spectrum of liver conditions ranging from isolated fatty liver to fat plus inflammation [non-alcoholic steatohepatitis (NASH)], which can progress to cirrhosis. Most NAFLD patients exhibit insulin resistance and obesity, and NAFLD is recognized as the hepatic correlate of the metabolic syndrome(2). NAFLD is a systemic disease and patients are three times more likely to die from cardiovascular disease than from liver-related death(3).
The role of NAFLD as an independent risk factor for coronary heart disease has gained attention(4–8). NAFLD is associated with impaired endothelial function(9), higher prevalence of vulnerable coronary plaques(10,11), and increased carotid intima media thickness(12). A recent meta-analysis also suggests that NAFLD may be associated with increased cardiovascular events independent of several traditional cardiovascular disease risk factors(8).
Visceral adipose tissue (VAT) is an endocrine organ that secretes factors contributing to vascular inflammation and insulin resistance, and may be a causative risk factor for NAFLD or a marker of NAFLD severity(13). Since NAFLD and metabolic syndrome features often coexist, any relationship between NAFLD and cardiovascular disease may be mediated by VAT volume or other cardiometabolic risk factors.
Some,(14–17) but not all,(18) studies have demonstrated that NAFLD patients have greater coronary atherosclerotic burden independent of abdominal VAT or metabolic syndrome features. Thus, it remains unclear whether the association between NAFLD and subclinical atherosclerosis is independent of these factors. The objectives of the current study were two-fold: 1) To examine associations between NAFLD and coronary artery (CAC) and abdominal aortic calcification (AAC); and 2) To determine whether the strengths of these associations are influenced by cardiometabolic risk factors. Based on prior findings, we hypothesize that NAFLD will be positively associated with both CAC and AAC, but that these associations will be attenuated by traditional cardiometabolic risk factors.
RESEARCH DESIGN AND METHODS
Study population
CARDIA is a multicenter community-based longitudinal cohort study of the development and determinants of cardiovascular disease in black and white young adults recruited in 1985 and 1986 at 18–30 years of age across 4 US cities (Birmingham, AL; Chicago, IL; Minneapolis, MN; and Oakland, CA). The study design has been published previously(19). Eight examinations have been completed, approved by institutional review boards at all sites and informed consent obtained at every examination. The present study includes participants who underwent computed tomography (CT) scanning of both the thorax and abdomen from June 2010 to August 2011 as part of the 25-year follow-up examination.
There were 3,499 participants (45.5% men, 50.5% black) that attended the CARDIA Year 25 Exam. Participants were excluded from the CT exam if they were pregnant, weighed more than 450lbs or were unable to fit within the CT gantry (n=318). We also excluded those missing measurements for liver fat, VAT, CAC or AAC (n=84). Of the remaining 3,097 participants, we excluded 41 participants with a medically verified history of acute myocardial infarction, angina or congestive heart failure and those with a self-reported history of liver disease (n=76). There was no difference in mean liver attenuation between those with self-reported liver disease and the remaining cohort. We also excluded participants with a risk factor for chronic liver disease (i.e. intravenous drug use) or with a potential cause of secondary hepatic steatosis (n=556): alcohol consumption ≥ 20 g/day in women and ≥ 30 g/day in men(20) (n=332), self-reported HIV (n=22), prior intravenous drug use (n=76), and medications known to cause hepatic steatosis (e.g. estrogens, corticosteroids and amiodarone) (n=126) (Figure 1). The remaining 2,424 participants (42.7% men, 50.0% black) formed the sample population.
Figure 1.

Cohort of CARDIA participants meeting inclusion and exclusion criteria. *Alcohol use: ≥ 20 g/day in women, ≥ 30 g/day in men. †medications excluded: corticosteroids, estrogens, amiodarone. Abbreviations: AAC, abdominal aortic calcification; CT, computed tomography; CAC, coronary artery calcification; HIV, human immunodeficiency virus; VAT, visceral adipose tissue.
Measurements
Standardized protocols for data collection were used across study centers and measurements have previously been described(19). Participants were asked to fast for at least 12h and to avoid smoking and heavy physical activity for at least 2h before each examination. Demographics, alcohol and smoking habits were ascertained through questionnaires. Medication use was self-reported and participants brought in medications for verification. Blood was drawn in the seated position, separated and plasma frozen to -70°C prior to analysis in a centr al laboratory(19). Glucose was assayed using the hexokinase method and insulin by the Elecsys sandwich immunoassay. Total cholesterol, HDL cholesterol and triglycerides were measured enzymatically by the Northwest Lipid Laboratory(21). LDL cholesterol was calculated using the Friedewald equation(22). Body weight was measured to the nearest 0.2 kg with a calibrated balance-beam scale. Height was measured with a vertical ruler to the nearest 0.5 cm. Seated blood pressure was measured three times at 1-min intervals after 5-min resting and the second and third measures averaged. Hypertension was defined as antihypertensive medications use and/or systolic pressure ≥140 mm Hg or diastolic pressure ≥90 mm Hg. Diabetes was defined as fasting plasma glucose ≥126 mg/dl, treatment with insulin or hypoglycemic agent, 2-hour post-challenge glucose ≥200 mg/dl and/or HbA1c ≥6.5%. Impaired fasting glucose was defined as a fasting plasma glucose ≥ 100 and <126 mg/dl. Obesity was defined as BMI ≥ 30 kg/m2 and modified National Cholesterol Education Program Adult Treatment Panel III criteria were used to define hyperlipidemia and the metabolic syndrome(23).
CT Scan Protocol
The CT protocol included the heart and lower abdomen using a non-contrast CT scan performed using GE [GE 750HD (64) and GE LightSpeed VCT (64) Birmingham and Oakland Centers, respectively; GE Healthcare, Waukesha, Wisconsin] or Siemens [Sensation 64, Chicago and Minneapolis Centers; Siemens Medical Solutions, Erlangen, Germany] multidetector CT scanners. Quality control and image analysis was performed at a core reading center (Wake Forest University Health Sciences, Winston-Salem, North Carolina). The protocol included scout images, one ECG gated heart series, and a lower abdominal series.
Assessment of Hepatic Steatosis
The CT diagnosis of liver fat is made by measuring liver attenuation (LA) in Hounsfield Units (HU) or the difference between the liver and spleen (24,25). As the amount of liver fat increases, the measured LA decreases (low LA = high fatty liver)(24). A liver-to-spleen ratio < 1.0 is comparable to using a LA cut-off of ≤ 51 HU for the diagnosis of mild liver fat(26). However, studies demonstrate that a LA value of ≤ 40 HU on unenhanced CT is the most clinically indicative of moderate-to-severe (> 30%) steatosis(25–28). Therefore, in the present study NAFLD was defined as LA of ≤ 40 HU after exclusion of other causes of liver fat (see Figure 1). Measurement of LA was performed in the right lobe of the liver using CT slices through the upper abdomen. A dedicated workflow was used within the National Institute’s of Health’s Center of Information Technology Medical Image Processing, Analysis, and Visualization (MIPAV) application (http://mipav.cit.nih.gov/index.php) to perform quantitative measurements. The LA was the average of nine measurements in the right lobe of the liver on three slices using circular regions of interest of 2.6 cm2. Readers were trained to place the liver regions of interest avoiding the large vessels and any focal liver lesions(17,24). The interclass correlation coefficient between different readers on a random selected sample of 156 participants was 0.975 for LA, indicating high reproducibility of CT measured LA in this study.
Assessment of CAC and AAC
CT assessed CAC was reported as present or absent based on CAC score > 0. Images of the coronary arteries were obtained in late diastole using ECG gating without intravenous contrast agent. Experienced image analysts, masked to participant information, measured calcified plaque in the epicardial coronary arteries using a modified Agatston method to account for slice thickness, a minimum lesion size of 4 adjacent pixels (an area of at least 1.87 mm2), and a density greater than 130 HU on a dedicated workstation (Aquarius Workstation, TerraRecon, Foster City, CA)(29). The interclass correlation coefficient for inter-reader comparisons was 0.999 for both CAC and AAC, and intra- and inter-reader error were 5.6% and 7.0% for CAC, and 6.4% and 8.6% for AAC, respectively, in 156 scans that were blinded and reevaluated. The accuracy, comparability, reproducibility, and robustness of the calcium score using CT systems has previously been described(30–33).
Assessment of Visceral Adiposity
Noncontrast CT images covering the lower abdomen from L2 to S1 were obtained and the MIPAV software was used to perform quantitative measurements of abdominal adiposity. Contiguous 1–1.25 mm slices were loaded into the MIPAV viewer and the axial, coronal and sagittal reformats were used to select the center of the lumbar disk space at L4-5. A block of slices 10 mm thick was used for quantification of abdominal adiposity. The skin and abdominal muscular wall were manually traced and the adipose tissue volumes in different compartments (subcutaneous, intermuscular and intrabdominal) were measured by semiautomatic segmentation techniques. The MIPAV program, based on user-defined boundaries, segmented and characterized each voxel as a tissue attenuation of fat using a threshold range of −190 to −30 HU. The VAT volumes were the sum of fat voxels within the 10 mm set of slices centered at L4-5 disk within the intra-abdominal cavity(17,34). The interclass correlation coefficient for inter-reader comparisons was 0.989 for VAT, and intra- and inter-reader error were 2.4% and 6.7%, respectively, in 156 scans that were blinded and reevaluated.
Statistical Analysis
Analyses were performed using SAS 9.2 (SAS institute, Cary, NC). Characteristics were compared by NAFLD status using linear models for continuous variables and chi-square tests for categorical variables. Logistic regression models were used to quantify cross sectional associations between the exposure, presence of NAFLD, and the outcome variables, presence of CAC (score>0) and presence of AAC (score>0), in separate analyses. Covariates in the multivariable model were chosen a priori for clinical importance. Factors considered potential confounders included age, race, sex, study center, socioeconomic level, alcohol intake and physical activity score. Factors considered potential effect modifiers were BMI and VAT. Continuous variables were standardized to a mean of 0 and a standard deviation of 1 prior to model entry. Pearson correlation coefficients were computed to assess the relationship between obesity measures and LA. Five models were fitted: Model 1: age, race, sex, study center, educational level, income level, alcohol intake, smoking status and physical activity score; Model 2: Model 1 + BMI; Model 3: Model 1 + VAT; Model 4: Model 1 + diabetes status, systolic blood pressure, total cholesterol, high density lipoprotein, and lipid and antihypertensive medication use. No significant interactions between NAFLD and CAC or AAC were observed according to sex, age, race and NAFLD. Multivariable linear regression was used to quantify associations between dependent variable continuous log-transformed CAC and dichotomous (or continuous) NAFLD status among participants with CAC present and dependent variable log-transformed AAC score among AAC present participants, respectively. Log transformation was successful in achieving a normal distribution for all parameters. A p value < 0.05 was considered statistically significant.
RESULTS
A total of 2,424 participants (42.7% men, 50.0% black) met the inclusion criteria and of these, 232 (9.6%) had CT-diagnosed NAFLD. Table 1 shows individuals with and without NAFLD. NAFLD participants were 50.5 ± 3.7 years old, similar to non-NAFLD, but more likely to be male, white, and have the metabolic syndrome. They were also more likely to have CAC (37.9%) and AAC (65.1%) (Figure 2). NAFLD participants also exhibited a higher prevalence of insulin resistance compared to non-NAFLD (Table 1), as demonstrated by higher fasting insulin, glucose, and diabetes prevalence. Among those with CAC, there was no significant difference in means of log-transformed CAC score between NAFLD (3.59 ± 1.65) and non-NAFLD (3.59 ± 1.70, p=0.97). Similarly, there was no significant difference in means of log-transformed AAC score by NAFLD status (4.00 ± 2.03 vs. 4.07 ± 2.22, p=0.72) in those with AAC.
Table 1.
Comparison of characteristics between overall study sample and participants with and without nonalcoholic fatty liver disease (NAFLD)
| Study Sample (n=2424) | No NAFLD (n=2192) | NAFLD (n=232) | P value* | |
|---|---|---|---|---|
| Age, mean, years | 50.1 ± 3.6 | 49.9 ± 3.6 | 50.5 ± 3.7 | 0.31 |
| Men, No (%) | 1036 (42.7) | 901 (41.1) | 135 (58.2) | <0.0001 |
| White, No (%) | 1212 (50.0) | 1078 (49.2) | 134 (57.8) | <0.05 |
| Grade of School completed, mean | 15.0 ± 2.7 | 15.0 ± 2.7 | 15.2 ± 2.6 | 0.36 |
| Income < $50,000/year, No (%) | 856 (35.3) | 770 (35.1) | 86 (37.1) | 0.26 |
| BMI (kg/m2), mean | 30.6 ± 7.2 | 30.0 ± 6.9 | 36.3 ± 7.4 | <0.0001 |
| BMI ≥ 30, No (%) | 1114 (46.0) | 925 (42.3) | 189 (81.5) | <0.0001 |
| Weight (lbs), mean | 195.1 ± 48.5 | 190.4 ± 45.9 | 239.3 ± 50.3 | <0.0001 |
| Height (cm), mean | 170.3 ± 9.5 | 170.0 ± 9.5 | 173.1 ± 8.9 | <0.0001 |
| Waist circumference (cm), mean | 94.9 ± 15.8 | 93.1 ± 14.8 | 112.3 ± 14.7 | <0.0001 |
| Current smokers, No (%) | 338 (14.1) | 310 (14.3) | 28 (12.2) | 0.38 |
| Alcohol use, No (%) | 1070 (44.1) | 973 (44.4) | 97 (41.8) | 0.60 |
| Daily alcohol use (g/day) | 9.8 ± 7.1 | 9.8 ± 6.9 | 9.8 ± 7.8 | 0.23 |
| Physical activity (exercise units/week) | 330.4 ± 274.0 | 335.4 ± 277.0 | 282.8 ± 240.2 | <0.01 |
| Comorbidities, No (%) | ||||
| Hyperlipidemia | 357 (14.7) | 300 (13.7) | 57 (24.6) | <0.0001 |
| Hypertension | 796 (32.9) | 676 (30.9) | 120 (52.0) | <0.0001 |
| Diabetes Mellitus | 293 (12.1) | 201 (9.2) | 92 (39.7) | <0.0001 |
| Impaired Glucose Tolerance | 975 (40.3) | 876 (40.1) | 99 (42.7) | <0.0001 |
| Medication use, No (%) | ||||
| Lipid-lowering | 357 (14.8) | 300 (13.7) | 57 (24.7) | <0.0001 |
| Anti-hypertensive | 654 (27.1) | 549 (25.1) | 105 (45.5) | <0.0001 |
| Anti-diabetic | 146 (6.0) | 102 (4.7) | 44 (19.0) | <0.0001 |
| Metabolic syndrome†, No (%) | 678 (28.0) | 515 (23.5) | 163 (70.3) | <0.0001 |
| Systolic blood pressure (mmHg), mean | 119.6 ± 16.1 | 119.1 ± 16.1 | 124.4 ± 15.1 | <0.0001 |
| Diastolic blood pressure (mmHg), mean | 74.9 ± 11.2 | 74.4 ± 11.2 | 79.7 ± 10.4 | <0.0001 |
| Laboratory Values, mean ± SD | ||||
| Fasting insulin (μU/mL) | 11.6 ± 10.1 | 10.5 ± 9.4 | 21.2 ± 11.8 | <0.0001 |
| Fasting glucose (mg/dL) | 98.9 ± 26.8 | 96.8 ± 23.7 | 118.8 ± 42.4 | <0.0001 |
| Hemoglobin A1c (%) | 5.7 ± 1.0 | 5.7 ± 0.90 | 6.4 ± 1.5 | <0.0001 |
| Total Cholesterol (mg/dL) | 191.9 ± 36.5 | 192.1 ± 36.4 | 189.4 ± 36.9 | 0.27 |
| LDL cholesterol (mg/dL) | 112.7 ± 32.5 | 113.0 ± 32.6 | 109.9 ± 31.3 | 0.17 |
| HDL cholesterol (mg/dL) | 57.2 ± 17.0 | 58.2 ± 17.1 | 47.1 ±12.4 | <0.0001 |
| VLDL cholesterol (mg/dL) | 21.4 ± 11.5 | 20.6 ± 10.9 | 30.4 ± 13.5 | <0.0001 |
| Triglycerides (mg/dL) | 112.3 ± 88.1 | 105.0 ± 68.1 | 180.8 ± 179.6 | <0.0001 |
| CT fat measures, mean | ||||
| Total Abdominal Fat Volume (cm3) | 234.1 ± 86.4 | 222.5 ± 75.1 | 343.3 ± 107.4 | <0.0001 |
| VAT (cm3) | 130.3 ± 73.1 | 120.5 ± 64.5 | 223.7 ± 82.7 | <0.0001 |
| Liver Attenuation (HU) | 55.7 ± 11.4 | 58.5 ± 7.5 | 29.5 ± 8.5 | <0.0001 |
General linear model for continuous variables, chi-square or Fischer exact for categorical variables for the difference between NAFLD and no NAFLD
Defined using ATPIII criteria
NAFLD = liver attenuation ≤ 40 HU
Abbreviations: SD, standard deviation; No, number; BMI, body mass index; CT, computed tomography; LDL, low density lipoprotein; HDL, high density lipoprotein; VLDL, very low density lipoprotein; NAFLD, nonalcoholic fatty liver disease; VAT, visceral adipose tissue
Figure 2.
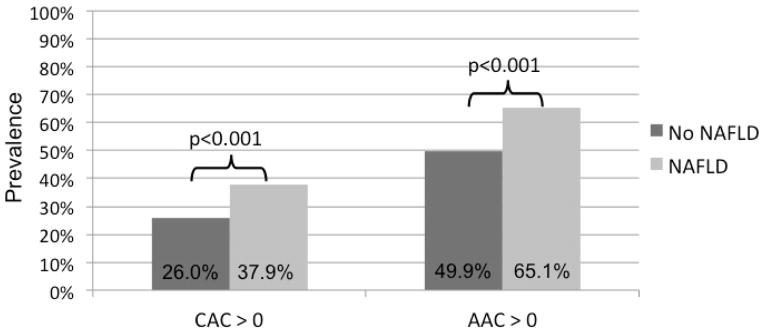
Unadjusted prevalence of coronary artery (CAC) and abdominal aortic calcification (AAC) in participants with and without nonalcoholic fatty liver disease (NAFLD).
The CAC and AAC prevalence was 27.1% and 51.4%, respectively. Association between NAFLD and CAC prevalence is shown in Table 2. In multivariable analyses adjusted for demographics and health behaviors, NAFLD was associated with CAC presence (OR, 1.33; 95% CI, 1.001–1.82). However, when other measures of obesity, including BMI or VAT, were added into the model, the association was attenuated (Table 2). Not surprisingly there was an inverse correlation between BMI and LA (r = −0.377, p<0.0001), and VAT and LA (r = −0.537, p <0.0001). However, the Variance Inflation Factors were < 2 for all model covariates, suggesting that multicolinearity did not interfere with model fit. Similarly when the reduced model (Model 1) was adjusted for other CVD risk factors, including diabetes status, systolic blood pressure, total cholesterol, high density lipoprotein levels, and treatments for hypertension and dyslipidemia, the association between NAFLD and CAC prevalence was again attenuated. NAFLD was also associated with AAC prevalence when adjusted for age, sex, race, education level, alcohol intake, smoking status and physical activity level (OR, 1.74; 95% CI, 1.29–2.35, Table 2). However, the effect of NAFLD was again attenuated in subsequent models after adjustment for CVD risk factors and adiposity measures (Table 2). These findings remained consistent even when the cut-point for the definition of NAFLD was increased to ≤ 51HU (consistent with a L/S ratio < 1.0) and when continuous LA was used. There was an apparent, but non-significant, race-sex difference in the effect of NAFLD on AAC (though not CAC) when subgroups were examined (see Supplemental eTable 1 and eTable 2). Finally, while the relationship between NAFLD and subclinical atherosclerosis was attenuated by BMI (model 2) and VAT (model 3), both BMI and VAT, respectively, were independently associated with subclinical atherosclerosis in these adjusted models (p<0.0001 for all). This suggess that obesity may act as a mediator of the relationship between NAFLD and subclinical atherosclerosis.
Table 2.
Odds Ratios and 95% Confidence Intervals (CI) for the association of non-alcoholic fatty liver disease (NAFLD) with coronary artery (CAC) or abdominal aortic calcification (AAC)
|
|
||||
|---|---|---|---|---|
| CAC | AAC | |||
|
| ||||
| OR (95% CI) | P value | OR (95% CI) | P value | |
| Unadjusted* | 1.72 (1.29–2.28) | <0.01 | 1.85 (1.40–2.46) | <0.001 |
|
| ||||
| Model 1 | 1.33 (1.001–1.82) | <0.05 | 1.74 (1.29–2.35) | <0.01 |
|
| ||||
| Model 2 | 1.04 (0.75–1.44) | 0.82 | 1.33 (0.97–1.83) | 0.07 |
|
| ||||
| Model 3 | 1.05 (0.74–1.48) | 0.78 | 1.20 (0.86–1.67) | 0.27 |
|
| ||||
| Model 4 | 0.99 (0.71–1.40) | 0.99 | 1.33 (0.96–1.84) | 0.08 |
Adjusted additionally for field center
NAFLD = liver attenuation ≤ 40 HU
Model 1: Adjusted for age, race, sex, study center, income level, educational level, alcohol intake (g/day), smoking status (current vs. never; former vs. never), physical activity score
Model 2: Adjusted for Model 1 + body mass index
Model 3: Adjusted for Model 1 + visceral adipose tissue volume
Model 4: Adjusted for Model 1 + diabetes status, systolic blood pressure, total cholesterol, high density lipoprotein and treatments for hypertension and dyslipidemia
DISCUSSION
Similar to previous studies, our cross-sectional results suggest that the relationship between prevalent NAFLD and subclinical atherosclerosis is independent of demographic and lifestyle behaviors, including smoking status, alcohol intake and physical activity. However, in contrast to prior findings, our data indicate that this association is attenuated after accounting for general or abdominal adiposity.
Several clinical and population studies observed associations of fatty liver with CAC independent of cardiovascular disease risk factors, including VAT(14–17,35). However, many of these studies included ethnically homogeneous populations of either Blacks or Eastern Asians (Taiwan, Korea, Japan). Only one study to date has examined the association between continuous liver attenuation and atherosclerosis in a multi-ethnic population. In a sub-study of the Multi-Ethnic Study of Atherosclerosis (MESA), 398 participants underwent multi-detector CT to detect liver fat and similar to our study, no associations were observed with CAC after adjustment for cardiovascular risk factors(18). In contrast, Chhabra et al. recently demonstrated that CT-diagnosed hepatic steatosis is associated with a coronary calcium score > 100 independent of the metabolic syndrome in 400 asymptomatic volunteers who were self-referred for coronary calcium score imaging(35). However, the population was significantly older (57.1 ± 9.7 years) and more likely to be white (88.3%) compared to the current study, which likely accounts for the higher observed prevalence of severe coronary calcification. In addition, the authors did not account for measures of obesity outside of the collective metabolic syndrome.
Interestingly, there are significant differences in NAFLD prevalence between racial-ethnic groups with a higher risk of severe disease in Hispanics and Asians, and a surprisingly low risk of severe disease in Blacks for reasons that are not known (36–38). Blacks may have a less “metabolically active” liver fat deposit which potentially contributes to excess cardiovascular risk. For example, triglyceride levels, a marker of insulin resistance, are often normal in people of African descent even when Diabetes is present(39). This may be secondary to greater clearance of free fatty acids from the circulation, which in turn leads to less hepatic fat accumulation and therefore less substrate for hepatic triglyceride production(40). In addition, multiple genetic variants are associated with NAFLD and explain a substantial proportion of the genetic predisposition in both African and Hispanic Americans(41). These racial variations may act as a confounder or mediator in studies of homogenous populations. In the current study we examined this issue by testing for effect modification by race. Similar to the MESA sub-study findings, we did not detect an independent association between NAFLD and CAC, and findings were consistent by race. Further comparisons to the MESA cohort are limited by the age difference between CARDIA (mean age: 50.1±3.6 years) and MESA (mean age: 63 ± 10 years) participants, where older age results in both higher NAFLD and CAC prevalence.
In the present study, the overall NAFLD prevalence (9.6%) is consistent with published prevalence estimates in the U.S. (20,35,42). In some publications, NAFLD prevalence has been much higher, ranging from 17–43%(14–17,43,44). These studies are heterogeneous with respect to the definition of NAFLD (biochemical, radiological, histological) and thus the low sensitivity of some modalities (i.e. biochemical) may attenuate the strength of the association between NAFLD and cardiovascular outcomes. In addition, CT parameters used to define NAFLD have varied considerably across studies, which may account for differences in reported prevalence rates. For example, using a liver/spleen ratio < 1 prevalence of NAFLD was 17% among both MESA(26,44) and Framingham(43) participants. This is comparable to a LA of ≤ 51 HU(26), and thus detects much lower levels of liver fat which may not be clinically significant. In the current study we chose a LA ≤ 40 HU as a clinical indicator of moderate-to-severe steatosis, which may account for our somewhat lower observed population prevalence. However, we also examined all associations using both a LA ≤ 51 HU and continuous LA and found no differences in the observed effects further strengthening the current study findings. Finally, due to study design the existing evidence is often unable to fully consider confounding or heterogeneity by established cardiovascular risk factors. Even where adjustments have been made, they often have included dichotomous variables such as the metabolic syndrome, rather than the full range of continuous cardiovascular risk factors used in clinical practice. The current study attempts to address these issues using a large racially diverse sample on which a complete set of cardiovascular and metabolic covariates was measured.
The strengths of the present study include our large, well-characterized population-based cohort of both whites and blacks, the measurement of a comprehensive set of metabolic covariates, and a NAFLD prevalence that is consistent with published population estimates. We believe that this makes our findings more generalizable to the U.S. population compared to previously published findings in homogenous populations(14,15). In addition, we sought to clinically define NAFLD by excluding participants with known chronic liver disease or those with potential confounders for hepatic fat. Prior research has focused primarily on associations between various fat deposits and atherosclerotic deposition, often ignoring other important potential confounders, and thus our study findings may have greater clinical applicability(17,18,34).
Some limitations warrant mention. Our findings are cross-sectional and derived from an observational study; therefore, neither temporal nor causal relationships can be inferred. CT is a relatively insensitive measure of hepatic fat compared to hepatic triglyceride content measured by proton magnetic resonance spectroscope (MR spectroscopy)(25,42), which may bias our results toward the null and underestimate the strength of the association between NAFLD and atherosclerosis. In addition, contemporaneous laboratory data on hepatic function was not available to us in the present study. We addressed this limitation by excluding participants at high risk of subclinical chronic liver disease. Although we may have excluded some participants who were most likely to have CAC, we do not anticipate that participants with NAFLD were more likely to be in that group. In fact, the overall CAC prevalence (26.6%) is consistent with previously published CAC prevalence in CARDIA, and thus our study subset appears representative of the overall CARDIA study population(17). Finally, there is no laboratory test for NAFLD, thus documenting steatosis on imaging in the presence of risk factors after exclusion of other liver diseases makes the diagnosis. Therefore, the NAFLD definition used in this study is similar to what is used in clinical practice. Furthermore, serum aminotransferases are often normal despite the presence of liver injury in NAFLD (45). Thus, we strongly doubt that hepatic function variables would have improved the classification of the NAFLD phenotype.
CONCLUSION
Our findings provide evidence that a NAFLD diagnosis is not associated with subclinical cardiovascular disease aside from established modifiable cardiovascular risk factors, including obesity, dyslipidemia, hypertension, diabetes and smoking status. Future studies of the association of NAFLD and subclinical atherosclerosis should be longitudinal and include additional racial/ethnic groups, due to the ethnic variability in the NAFLD phenotype, to further elucidate the contributory role of duration of NAFLD on atherosclerotic progression and subsequent cardiovascular events.
Supplementary Material
Highlights.
We examine the relationship between nonalcoholic fatty liver disease and atherosclerosis.
Nonalcoholic fatty liver disease is associated with subclinical atherosclerosis.
Obesity seems to mediate any observed relationship.
Acknowledgments
The authors thank the participants of the CARDIA study for their long-term commitment and important contributions to the study.
The Coronary Artery Risk Development in Young Adults Study (CARDIA) is conducted and supported by the National Heart, Lung, and Blood Institute in collaboration with the University of Alabama at Birmingham (HHSN268201300025C & HHSN268201300026C), Northwestern University (HHSN268201300027C), University of Minnesota (HHSN268201300028C), Kaiser Foundation Research Institute (HHSN268201300029C), and Johns Hopkins University School of Medicine (HHSN268200900041C). CARDIA is also partially supported by the Intramural Research Program of the National Institute on Aging. This manuscript has been reviewed by CARDIA for scientific content.
L.B.V. is supported by the National Institutes of Health (1 F32 HL116151-01) and the American Liver Foundation (New York, NY).
J.J.C. is supported by the National Institutes of Health (R01-HL-098445), which funded the measures of CAC and AAC for the year 25 exam.
None of the funding sources participated in the study design; in the collection, analysis and interpretation of data; in the writing of the report; or in the decision to submit this article for publication.
Abbreviations
- NAFLD
non-alcoholic fatty liver disease
- NASH
non-alcoholic steatohepatitis
- VAT
visceral adipose tissue
- CAC
coronary artery calcification
- AAC
abdominal aortic calcification
- CT
computed tomography
- MESA
Multi-Ethnic Study of Atherosclerosis
- HU
Hounsfield Units
- LA
liver attenuation
- MIPAV
Medical Image Processing, Analysis, and Visualization
Footnotes
CO-AUTHOR CONTRIBUTIONS & CONTACT INFORMATION
- Christina Shay, University of Oklahoma Health Sciences Center, Oklahoma City, OK christina-shay@ouhsc.edu 412-605-9782
- Hongyan Ning, Northwestern University, Chicago, IL h-ning@northwestern.edu 312-503-2766
- John Wilkins, Northwestern University, Chicago, IL j-wilkins@md.northwestern.edu 312-926-7708
- Cora E. Lewis, University of Alabama Birmingham, Birmingham, AL clewis@mail.dopm.uab.edu 205-934-6383
- J. Jeffrey Carr, Vanderbilt University, Nashville, TN j.jeffrey.carr@vanderbilt.edu 615.343.5343
- James Greg Terry, Wake Forest University, Winston-Salem, NC jgterry@wakehealth.edu, 336-716-7234
- Donald M. Lloyd-Jones, Northwestern University, Chicago, IL dlj@northwestern.edu 312-908-7914
- David R. Jacobs, University of Minnesota, Minneapolis MN jacob004@umn.edu 612-624-6669
- Mercedes Carnethon, Northwestern University, Chicago, IL carnethon@northwestern.edu 312-503-4479
CONFLICT OF INTEREST DISCLOSURES
The authors have no conflicts of interest pertinent to this study.
Publisher's Disclaimer: This is a PDF file of an unedited manuscript that has been accepted for publication. As a service to our customers we are providing this early version of the manuscript. The manuscript will undergo copyediting, typesetting, and review of the resulting proof before it is published in its final citable form. Please note that during the production process errors may be discovered which could affect the content, and all legal disclaimers that apply to the journal pertain.
References
- 1.Vernon G, Baranova A, Younossi ZM. Systematic review: the epidemiology and natural history of non-alcoholic fatty liver disease and non-alcoholic steatohepatitis in adults. Aliment Pharmacol Ther. 2011;34:274–85. doi: 10.1111/j.1365-2036.2011.04724.x. [DOI] [PubMed] [Google Scholar]
- 2.Charlton M. Nonalcoholic fatty liver disease: a review of current understanding and future impact. Clin Gastroenterol Hepatol. 2004;2:1048–58. doi: 10.1016/s1542-3565(04)00440-9. [DOI] [PubMed] [Google Scholar]
- 3.Lazo M, Hernaez R, Bonekamp S, et al. Non-alcoholic fatty liver disease and mortality among US adults: prospective cohort study. BMJ. 2011;343:d6891. doi: 10.1136/bmj.d6891. [DOI] [PMC free article] [PubMed] [Google Scholar]
- 4.Nestel PJ, Mensink RP. Perspective: nonalcoholic fatty liver disease and cardiovascular risk. Curr Opin Lipidol. 2013;24:1–3. doi: 10.1097/MOL.0b013e32835c0834. [DOI] [PubMed] [Google Scholar]
- 5.Bhatia LS, Curzen NP, Calder PC, Byrne CD. Non-alcoholic fatty liver disease: a new and important cardiovascular risk factor? Eur Heart J. 2012;33:1190–200. doi: 10.1093/eurheartj/ehr453. [DOI] [PubMed] [Google Scholar]
- 6.Targher G, Day CP, Bonora E. Risk of cardiovascular disease in patients with nonalcoholic fatty liver disease. N Engl J Med. 2010;363:1341–50. doi: 10.1056/NEJMra0912063. [DOI] [PubMed] [Google Scholar]
- 7.Pacana T, Fuchs M. The cardiovascular link to nonalcoholic fatty liver disease: a critical analysis. Clin Liver Dis. 2012;16:599–613. doi: 10.1016/j.cld.2012.05.008. [DOI] [PubMed] [Google Scholar]
- 8.Lu H, Liu H, Hu F, Zou L, Luo S, Sun L. Independent Association between Nonalcoholic Fatty Liver Disease and Cardiovascular Disease: A Systematic Review and Meta-Analysis. International journal of endocrinology. 2013;2013:124958. doi: 10.1155/2013/124958. [DOI] [PMC free article] [PubMed] [Google Scholar]
- 9.Villanova N, Moscatiello S, Ramilli S, et al. Endothelial dysfunction and cardiovascular risk profile in nonalcoholic fatty liver disease. Hepatology. 2005;42:473–80. doi: 10.1002/hep.20781. [DOI] [PubMed] [Google Scholar]
- 10.Akabame S, Hamaguchi M, Tomiyasu K, et al. Evaluation of vulnerable coronary plaques and non-alcoholic fatty liver disease (NAFLD) by 64-detector multislice computed tomography (MSCT) Circ J. 2008;72:618–25. doi: 10.1253/circj.72.618. [DOI] [PubMed] [Google Scholar]
- 11.Assy N, Djibre A, Farah R, Grosovski M, Marmor A. Presence of coronary plaques in patients with nonalcoholic fatty liver disease. Radiology. 2010;254:393–400. doi: 10.1148/radiol.09090769. [DOI] [PubMed] [Google Scholar]
- 12.Volzke H, Robinson DM, Kleine V, et al. Hepatic steatosis is associated with an increased risk of carotid atherosclerosis. World J Gastroenterol. 2005;11:1848–53. doi: 10.3748/wjg.v11.i12.1848. [DOI] [PMC free article] [PubMed] [Google Scholar]
- 13.Park BJ, Kim YJ, Kim DH, et al. Visceral adipose tissue area is an independent risk factor for hepatic steatosis. J Gastroenterol Hepatol. 2008;23:900–7. doi: 10.1111/j.1440-1746.2007.05212.x. [DOI] [PubMed] [Google Scholar]
- 14.Kim D, Choi SY, Park EH, et al. Nonalcoholic fatty liver disease is associated with coronary artery calcification. Hepatology. 2012;56:605–13. doi: 10.1002/hep.25593. [DOI] [PMC free article] [PubMed] [Google Scholar]
- 15.Chen CH, Nien CK, Yang CC, Yeh YH. Association between nonalcoholic fatty liver disease and coronary artery calcification. Dig Dis Sci. 2010;55:1752–60. doi: 10.1007/s10620-009-0935-9. [DOI] [PubMed] [Google Scholar]
- 16.Sung KC, Wild SH, Kwag HJ, Byrne CD. Fatty Liver, Insulin Resistance, and Features of Metabolic Syndrome: Relationships with coronary artery calcium in 10,153 people. Diabetes Care. 2012 doi: 10.2337/dc12-0515. [DOI] [PMC free article] [PubMed] [Google Scholar]
- 17.Liu J, Musani SK, Bidulescu A, et al. Fatty liver, abdominal adipose tissue and atherosclerotic calcification in African Americans: the Jackson Heart Study. Atherosclerosis. 2012;224:521–5. doi: 10.1016/j.atherosclerosis.2012.07.042. [DOI] [PMC free article] [PubMed] [Google Scholar]
- 18.Ding J, Kritchevsky SB, Hsu FC, et al. Association between non-subcutaneous adiposity and calcified coronary plaque: a substudy of the Multi-Ethnic Study of Atherosclerosis. Am J Clin Nutr. 2008;88:645–50. doi: 10.1093/ajcn/88.3.645. [DOI] [PMC free article] [PubMed] [Google Scholar]
- 19.Friedman GD, Cutter GR, Donahue RP, et al. CARDIA: study design, recruitment, and some characteristics of the examined subjects. J Clin Epidemiol. 1988;41:1105–16. doi: 10.1016/0895-4356(88)90080-7. [DOI] [PubMed] [Google Scholar]
- 20.Chalasani N, Younossi Z, Lavine JE, et al. The diagnosis and management of non-alcoholic fatty liver disease: Practice Guideline by the American Association for the Study of Liver Diseases, American College of Gastroenterology, and the American Gastroenterological Association. Hepatology. 2012;55:2005–2023. doi: 10.1002/hep.25762. [DOI] [PubMed] [Google Scholar]
- 21.Warnick GR. Enzymatic methods for quantification of lipoprotein lipids. Methods Enzymol. 1986;129:101–23. doi: 10.1016/0076-6879(86)29064-3. [DOI] [PubMed] [Google Scholar]
- 22.Friedewald WT, Levy RI, Fredrickson DS. Estimation of the concentration of low-density lipoprotein cholesterol in plasma, without use of the preparative ultracentrifuge. Clin Chem. 1972;18:499–502. [PubMed] [Google Scholar]
- 23.Grundy SM, Brewer HB, Jr, Cleeman JI, Smith SC, Jr, Lenfant C. Definition of metabolic syndrome: report of the National Heart, Lung, and Blood Institute/American Heart Association conference on scientific issues related to definition. Arterioscler Thromb Vasc Biol. 2004;24:e13–8. doi: 10.1161/01.ATV.0000111245.75752.C6. [DOI] [PubMed] [Google Scholar]
- 24.Davidson LE, Kuk JL, Church TS, Ross R. Protocol for measurement of liver fat by computed tomography. J Appl Physiol. 2006;100:864–8. doi: 10.1152/japplphysiol.00986.2005. [DOI] [PubMed] [Google Scholar]
- 25.Kodama Y, Ng CS, Wu TT, et al. Comparison of CT methods for determining the fat content of the liver. AJR Am J Roentgenol. 2007;188:1307–12. doi: 10.2214/AJR.06.0992. [DOI] [PubMed] [Google Scholar]
- 26.Zeb I, Li D, Nasir K, Katz R, Larijani VN, Budoff MJ. Computed tomography scans in the evaluation of fatty liver disease in a population based study: the multi-ethnic study of atherosclerosis. Acad Radiol. 2012;19:811–8. doi: 10.1016/j.acra.2012.02.022. [DOI] [PMC free article] [PubMed] [Google Scholar]
- 27.Park SH, Kim PN, Kim KW, et al. Macrovesicular hepatic steatosis in living liver donors: use of CT for quantitative and qualitative assessment. Radiology. 2006;239:105–12. doi: 10.1148/radiol.2391050361. [DOI] [PubMed] [Google Scholar]
- 28.Boyce CJ, Pickhardt PJ, Kim DH, et al. Hepatic steatosis (fatty liver disease) in asymptomatic adults identified by unenhanced low-dose CT. AJR Am J Roentgenol. 2010;194:623–8. doi: 10.2214/AJR.09.2590. [DOI] [PubMed] [Google Scholar]
- 29.Agatston AS, Janowitz WR, Hildner FJ, Zusmer NR, Viamonte M, Jr, Detrano R. Quantification of coronary artery calcium using ultrafast computed tomography. J Am Coll Cardiol. 1990;15:827–32. doi: 10.1016/0735-1097(90)90282-t. [DOI] [PubMed] [Google Scholar]
- 30.Carr JJ, Crouse JR, 3rd, Goff DC, Jr, D'Agostino RB, Jr, Peterson NP, Burke GL. Evaluation of subsecond gated helical CT for quantification of coronary artery calcium and comparison with electron beam CT. AJR Am J Roentgenol. 2000;174:915–21. doi: 10.2214/ajr.174.4.1740915. [DOI] [PubMed] [Google Scholar]
- 31.Detrano RC, Anderson M, Nelson J, et al. Coronary calcium measurements: effect of CT scanner type and calcium measure on rescan reproducibility--MESA study. Radiology. 2005;236:477–84. doi: 10.1148/radiol.2362040513. [DOI] [PubMed] [Google Scholar]
- 32.Chung H, McClelland RL, Katz R, Carr JJ, Budoff MJ. Repeatability limits for measurement of coronary artery calcified plaque with cardiac CT in the Multi-Ethnic Study of Atherosclerosis. AJR Am J Roentgenol. 2008;190:W87–92. doi: 10.2214/AJR.07.2726. [DOI] [PubMed] [Google Scholar]
- 33.Budoff MJ, McClelland RL, Chung H, et al. Reproducibility of coronary artery calcified plaque with cardiac 64-MDCT: the Multi-Ethnic Study of Atherosclerosis. AJR Am J Roentgenol. 2009;192:613–7. doi: 10.2214/AJR.08.1242. [DOI] [PubMed] [Google Scholar]
- 34.Liu J, Fox CS, Hickson D, Bidulescu A, Carr JJ, Taylor HA. Fatty liver, abdominal visceral fat, and cardiometabolic risk factors: the Jackson Heart Study. Arterioscler Thromb Vasc Biol. 2011;31:2715–22. doi: 10.1161/ATVBAHA.111.234062. [DOI] [PMC free article] [PubMed] [Google Scholar]
- 35.Chhabra R, O'Keefe JH, Patil H, et al. Association of coronary artery calcification with hepatic steatosis in asymptomatic individuals. Mayo Clin Proc. 2013;88:1259–65. doi: 10.1016/j.mayocp.2013.06.025. [DOI] [PubMed] [Google Scholar]
- 36.Tabibian JH, Lazo M, Durazo FA, Yeh HC, Tong MJ, Clark JM. Nonalcoholic fatty liver disease across ethno-racial groups: do Asian-American adults represent a new at-risk population? J Gastroenterol Hepatol. 2011;26:501–9. doi: 10.1111/j.1440-1746.2010.06443.x. [DOI] [PMC free article] [PubMed] [Google Scholar]
- 37.Weston SR, Leyden W, Murphy R, et al. Racial and ethnic distribution of nonalcoholic fatty liver in persons with newly diagnosed chronic liver disease. Hepatology. 2005;41:372–9. doi: 10.1002/hep.20554. [DOI] [PubMed] [Google Scholar]
- 38.Browning JD, Szczepaniak LS, Dobbins R, et al. Prevalence of hepatic steatosis in an urban population in the United States: impact of ethnicity. Hepatology. 2004;40:1387–95. doi: 10.1002/hep.20466. [DOI] [PubMed] [Google Scholar]
- 39.Yu SS, Castillo DC, Courville AB, Sumner AE. The triglyceride paradox in people of African descent. Metab Syndr Relat Disord. 2012;10:77–82. doi: 10.1089/met.2011.0108. [DOI] [PMC free article] [PubMed] [Google Scholar]
- 40.Chow CC, Periwal V, Csako G, et al. Higher acute insulin response to glucose may determine greater free fatty acid clearance in African-American women. J Clin Endocrinol Metab. 2011;96:2456–63. doi: 10.1210/jc.2011-0532. [DOI] [PMC free article] [PubMed] [Google Scholar]
- 41.Palmer ND, Musani SK, Yerges-Armstrong LM, et al. Characterization of European-ancestry NAFLD-associated Variants in individuals of African and Hispanic descent. Hepatology. 2013 doi: 10.1002/hep.26440. [DOI] [PMC free article] [PubMed] [Google Scholar]
- 42.Musso G, Gambino R, Cassader M, Pagano G. Meta-analysis: natural history of non-alcoholic fatty liver disease (NAFLD) and diagnostic accuracy of non-invasive tests for liver disease severity. Ann Med. 2011;43:617–49. doi: 10.3109/07853890.2010.518623. [DOI] [PubMed] [Google Scholar]
- 43.Speliotes EK, Massaro JM, Hoffmann U, et al. Fatty liver is associated with dyslipidemia and dysglycemia independent of visceral fat: the Framingham Heart Study. Hepatology. 2010;51:1979–87. doi: 10.1002/hep.23593. [DOI] [PMC free article] [PubMed] [Google Scholar]
- 44.DeFilippis AP, Blaha MJ, Martin SS, et al. Nonalcoholic fatty liver disease and serum lipoproteins: the Multi-Ethnic Study of Atherosclerosis. Atherosclerosis. 2013;227:429–36. doi: 10.1016/j.atherosclerosis.2013.01.022. [DOI] [PMC free article] [PubMed] [Google Scholar]
- 45.Mofrad P, Contos MJ, Haque M, et al. Clinical and histologic spectrum of nonalcoholic fatty liver disease associated with normal ALT values. Hepatology. 2003;37:1286–92. doi: 10.1053/jhep.2003.50229. [DOI] [PubMed] [Google Scholar]
Associated Data
This section collects any data citations, data availability statements, or supplementary materials included in this article.