

Abstract
The computational fluid dynamics (CFD) are used to evaluate the physiological function of the nose. We evaluated the aerodynamics of the nasal cavity in a patient with septal perforation (SP), pre- and postvirtual repair. Three-dimensional nasal models were reconstructed, and then a wide range of the pressure drops and flow rates were analyzed. The airflow velocity is higher in the central region and is lower around the boundary of the SP. The air velocity in the SP increases as the pressure drop increases. Furthermore, at the anterior part of the SP, the shear stress is higher in the upper part. In addition, the repair of SP does not affect the total nasal airflow rate and the velocity contour patterns. The potential usage of the CFD technique as a predictive technique to explore the details and a preoperative assessment tool to help in clinical decision making in nasal surgery is emphasized.
Keywords: Aerodynamics, airflow velocity, computational fluid dynamics, geometry, nasal cavity, nasal septal perforation
It is well recognized that the nasal passage geometry significantly influences the aerodynamic behavior of the human nasal cavity and thus greatly affects the physiology of the nasal airway. In addition, computer software and mathematics have now a wide usage in many scientific fields all over the world. Fortunately, computers and mathematics have found their way in rhinology to help specialists by computational fluid dynamics (CFD). The CFD provides a tool for virtual evaluation of the physiological function of the nose with a given geometry. In other words, CFD is a numerical simulation technique that allows for the quantitative evaluation as well as visualization of flow variables (such as velocity, pressure, vector, and streamline) under different conditions. To perform a CFD study, the following steps are required: (1) generation of an appropriate geometric model by use of high-resolution computed tomography (CT) or magnetic resonance imaging (MRI) data; (2) physical modeling of fluid flow from fundamental laws of mechanics; (3) discretization of the mathematical model and numerical simulation of the fluid flow; and (4) postprocessing analysis of the simulation results for graphical presentation of flow variables such as velocity, pressure, turbulence quantities, and temperature.1–4
The most significant advantages of using CFD analysis in the evaluation of nasal pathologies are the ability to assess local aerodynamics at any point inside the nasal cavity and the opportunity for the evolution of the aerodynamic consequences of planned surgical interventions via virtual operations on the numerical models.
To assess the physiological function of the nose and quantify the flow parameters, a few authors have recently focused on exploring the application of CFD in the field of rhinology. Chen et al.5found that there was significant aerodynamic flow redistribution in a patient with bilateral nasal bone fractures. Ishikawa et al.1used the CFD method in the normal physiological configurations and compared the inspiratory and expiratory phase flow patterns. They reported that in the inspiratory phase, the highest airflow velocity occurs along the middle meatus and the sites of airflow resistance are localized along the anterior segment of the middle meatus. In another study, the same authors found that during the sniffing phase when velocity increased, area circulation flow was generated in the olfactory area, and the flow streamlines moved higher into the olfactory area compared with the normal inspiration situation.6 In their literature review Wolf et al.7 reported the details of the nasal airflow pattern and found that the bulk of the airflow occurs through the inferior and middle meatuses and near the floor of the nose. Zamankhan et al.8 and Shanley et al.9 used computational fluid mechanics and particle tracking and analyzed nano-and microparticle transport and deposition in the human nasal cavity. Verbanck et al.10 also used a CFD method to study aerosol deposition in a realistic upper airway. They concluded that the deposition patterns were consistent in different compartments of the upper airway model and only slightly dependent on the studied range of particle size or flow rate.
In addition, a few researches were conducted in connection with the nasal endoscopic surgery and CFD analysis. Xiong and et al.11 suggested that virtual endoscopic sinus surgery is associated with significant increases in airflow distribution in the osteomeatal complex and the sinuses. In another study, the same authors found larger nasal airflow velocity after removal of the uncinate process in a cadaver.12 Lindemann and coworkers13 simulated the intranasal airflow after complete removal of the lateral nasal wall and inferior turbinate ethmoidectomy and resection of the middle turbinate. Although the simulated case of radical sinus surgery is unusual in real life, they found that because of increased cross-sectional areas and decreased airflow resistance after such sinus surgery, the airflow remains more laminar, resulting in a lesser contact between air and surrounding mucosa. Chen et al.,14 simulated partial and radical inferior turbinectomy and studied its effects on the heating capacities of nasal cavity. They showed in both normal nasal cavities and those with turbinectomy the largest temperature gradient location is the minimum cross-sectional area. In addition, the nasal cavities with partial turbinectomy can preserve its heating capability but can not in radical inferior turbinectomy.
Zhao and coworkers showed considerable improvement in airflow and olfactory odorant delivery rate after endoscopy nasal polypectomy.15
In a study by Chen et al.,16 on a patient with endoscopic sinus surgery on the right nasal cavity, they showed relatively larger amounts of continuous airflow were circulated inside the enlarged sinus regions for the whole respiration cycle.
A few studies focused on the prediction of appropriate treatment of septal deviation and or turbinate hypertrophy in nasal obstruction based on the CFD results. Wexler and coworkers detected a noticeable reduction in intranasal pressures along the full length of nasal cavity after conservative unilateral inferior turbinate reduction.17 Rhee et al.18 found a decrease in overall nasal airway resistance after virtual septoplasty with inferior turbinate reduction. However, only inferior turbinate reduction caused a small alteration in nasal resistance or regional airflow.
In a study by Chen et al.,19 hey the effects were evaluated of C-shaped deviated septum in the middle portion on the aerodynamic airflow pattern of the nasal cavity. They detected that in the normal nose, the highest intensity of turbulent flow was in the nasal valve area, but in the nose with deviated septum, it was less apparent or even disappeared. In addition, they found that a greater pressure gradient was posterior to the deviation.
Ozlugedik et al.20 detected that the airflow crossing the middle meatus was highly increased after virtual dissection of the lateral portion of the concha bullosa. Using CFD, Gaball et al.21 found that a submucous cartilaginous and/or bony window after septoplasty can cause nasal obstruction. In our first experiment in this field, with Moghadas and our team, 22 the effect of septal deviation on the airflow patterns and the deposition of micro-/nanoparticles were evaluated. We found that after septoplasty the deposition of 15 μm and 2 nm particles decreased, respectively, by ∼60 and 20%. In another study using a CFD, Garcia et al.23 suggested that lack of turbinates led to an abnormal airflow that resulted in abnormal patterns of moisture fluxes across the nasal mucosa in the nasal cavity of a patient who suffered from atrophic rhinitis.
Nasal septal perforation (SP), as a complication of septoplasty, causes disturbance of flow patterns because of abnormal anatomy and geometry of the nasal cavity.24 Recently, a few researchers studied the pattern of airflow distribution, particularly, in SP. Grant et al.25 reconstructed a virtual nasal SP and found high concentrations of shear stresses at the posterior portion of the SP. In their study, Pless and coworkers detected that SP may cause airflow disturbances and imbalanced temperature distribution.24 The recent CFD study on SP by Lee et al.26 revealed that there are airflow exchanges between the nasal cavity with higher flow rate to the one with lower flow rate, particularly for moderate- and large-sized virtual perforations.
Despite a low number of studies, there is a research gap about the effect of the wide range of the pressure drops and flow rates. Also, another research gap is an evaluation of shear stress around the SP. Actually, our primary objective of this study was to exemplify one of the implications of CFD in this field.
MODEL DESCRIPTION
A 39-year-old man was referred to the Department of Otolaryngology in Sadughi Hospital (affiliated with Yazd University of Medical Sciences), with the chief complaint of occasional nasal obstruction. He underwent septoplasty in another hospital, 6 months before attending our center. A nasal endoscopy revealed a large anterior SP with crust around it. In this study, the aerodynamics of the nasal cavity of a real patient with SP who refused surgical repair was assessed. The model was constructed from a CT scan of the nasal cavity of this volunteer patient with the following parameters: 0.625-mm-slice increment, 21.40-cm field of view, 120 kV peak, and 200.00 mA. Under the supervision of an otolaryngologist, the boundary between the airway mucosa and air in the upper respiratory tract was defined in the CT scan slices.
To reconstruct the 3-day model, the boundaries were imported into GAMBIT (Fluent Inc., Lebanon, NH), which is a CFD preprocessor software. An unstructured Tri/tetrahedral hybrid volume mesh was generated inside the airway passage. A grid of ∼2,500,000 cells was obtained after the grid independency test.
In our patient, SP had a width of 22 mm and height of 11.5 mm. The perforation starts at a distance of 25 mm from the nostril and ends at 47 mm from the nostril. The cross-sectional area of the SP is 1.6 cm2. The location of perforation is shown in Fig. 1 (red zone).
Figure 1.
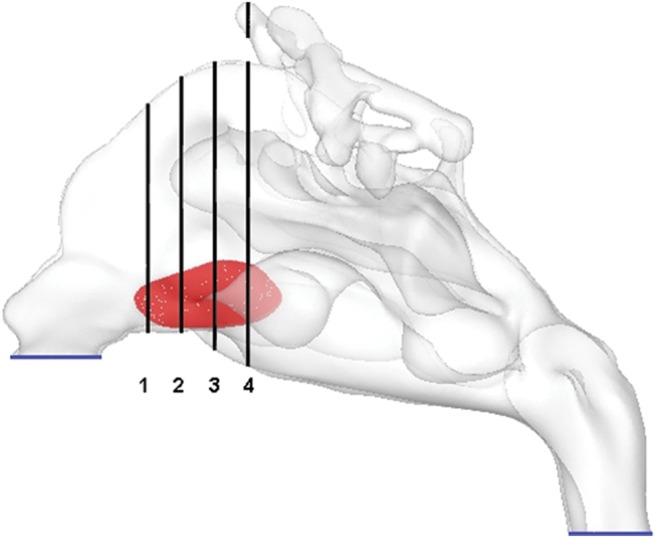
Location of perforation in sagittal view into the three-dimensional nasal cavity model. Four different coronal sections are defined at the region of the septal perforation to show the results.
GOVERNING EQUATIONS AND BOUNDARY CONDITIONS
The flow regime was assumed to be steady and four different pressure drops of 5, 10, 20, and 40 Pa were used for analyzing the airflow conditions. In 5- and 10-Pa pressure differences, the flow was determined to be laminar, but at 10- and 20-Pa pressure differences the flow was determined to be in a turbulent regime and the k-ε model was used to account for the turbulence effects. The gauge pressure boundary condition was set at the inlet and outlet. No-slip velocity boundary condition was assumed on the airway walls and the gravitational effects on the airflow were neglected.
The air was assumed to be a Newtonian, homogeneous, and incompressible fluid. The Navier–Stokes equations and the continuity equation are the governing equations for the laminar fluid flows. The Navier–Stokes equations are a set of equations that describe the balance of forces during fluid motion; i.e., the rate of change in the momentum of a differential volume of a fluid is simply balanced by the pressure and viscous forces acting on the fluid element. The continuity equation is a statement of the conservation of mass.
The continuity and the Navier–Stokes equations are given as
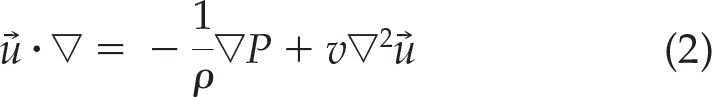 |
In Eqs. 1 and 2, →u is the velocity vector, P is the fluid pressure, ρ is the fluid kinematics, and ν is the kinematical viscosity.
When the flow becomes turbulent, the flow parameters vary randomly. In this case, the so-called Reynolds averaged Navier–Stokes equation is used to evaluate the averaged values of flow parameters. These equations also need to be supplemented by two additional equations for the kinetic energy of turbulence k and the turbulence dissipation rate ε, in the context of the k-ε model. The Reynolds averaged Navier-Stokes and the k-ε equations may be found in the FLUENT manual.27
The CFD package, FLUENT 6.3 (ANSYS Inc., Canonsburg, PA) was used to solve the governing equations for the airflow in the complex passages of the human upper airway. The numerical solution is based on the finite volume formulation. The governing equations were integrated over each control volume to obtain a set of algebraic equations. These equations were solved by using the SIMPLE algorithm for the pressure correction processes. The convective and diffusive terms were discretized, respectively, by the first-order upwind and the central difference schemes. For the flow field simulation, the convergence criteria set the conditions that the nondimensional residuals of equations reduce to <109. In addition, no change in value of the velocity and other parameters in some probes located in the computational domain were checked as the second the convergence criteria.
RESULTS
Figure 2 shows the airflow rate before and after surgery in the nasal passage. The rate of flow after the virtual surgery at the same pressure difference in the nasal cavity had a small decrease and the total airflow rate was not affected considerably by repair of SP.
Figure 2.
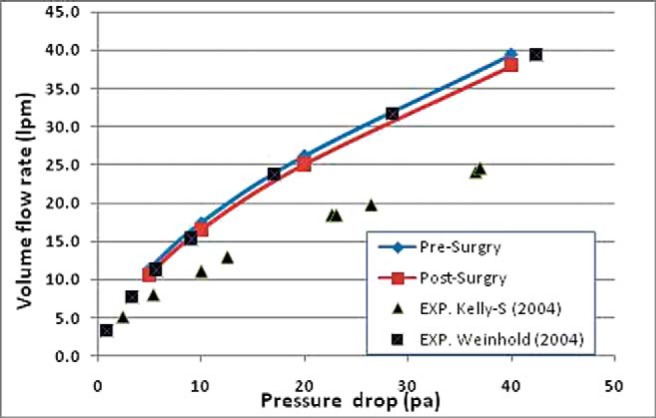
Volume airflow rate for various pressure drops (Pa) in the nasal cavity (from the entrance of the nose to the nasopharynx) before and after surgery. Comparison with experimental or numerical data available in the literature is also shown.
The variation of the volume flow rate entering and exiting the right and left passages is shown in Fig. 3 before repair of SP. The flow passing through the perforation is also shown in the figure. It is interesting to see that the airflow that exits the left side (top blue line) is more than the amount that enters it (red line). In fact, the volume flow rate passing through the left passage is almost twice more than that of the right side. This difference of flow is the amount that leaks through the perforation (black blue).
Figure 3.
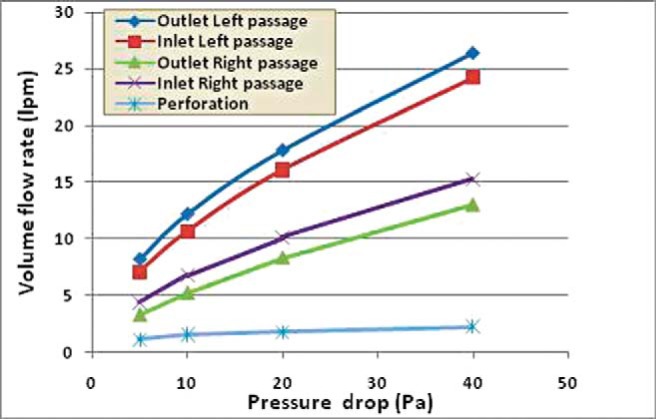
Entering and exiting volume flow rates for right and left passages and the flow leakage through the septal perforation (SP).
Figure 4 shows the contours for the pressure and velocity on the cross-section of the SP for various pressure drops in the nasal cavity. The airflow velocity is highest in the central region of the perforation and is lowest around the boundary of the SP. The air velocity in the SP is higher for the larger pressure drop in the nasal passage and reaches to 5 m/s for the pressure drop of 40 Pa. We also found the pattern for pressure distribution. The pressure on the cross-section of the SP is lower at the higher flow rates, as expected. Additionally, the pressure is less in the lower half of this region.
Figure 4.

The velocity and pressure contours in the septal perforation (SP) for different ΔP. Scale indicates color codes for least (blue) to greatest (red) velocity.
To provide better insight of the flow field around the SP, four coronal planes in this region were defined for describing the details of the simulation results. These planes are marked in Fig. 1. We evaluated the velocity contours at the coronal planes of SP for a range of pressure drops from 5 to 40 Pa before and after the surgical repair of the perforation. The results for a pressure drop of 40 Pa are shown in Fig. 5. It is seen that the velocity is higher in the lower portion of the coronal cross-section. The airflow velocity decreases at lower pressure drops (not shown here) because of lower inhaled flow rates. After repair of the SP, the airflow velocity in the right nasal passage decreased. This is because of the increase of resistance to airflow in the right nasal cavity after repair of perforation, which causes a slight decrease in velocity. The velocity inside the perforation is lower than that in the main airway passage in coronal planes of 1 and is equal or even higher than the main air velocity at other coronal planes. After repair of the SP, these high velocity regions disappear. As shown in Fig. 2, the total airflow rate did not change significantly after SP repair. This is the reason that the velocity contours did not change noticeably. The trend of the contours for other studied pressure drops corresponding to lower volume flow rates is the same but with a lower magnitude of the velocity and therefore is not shown here.
Figure 5.
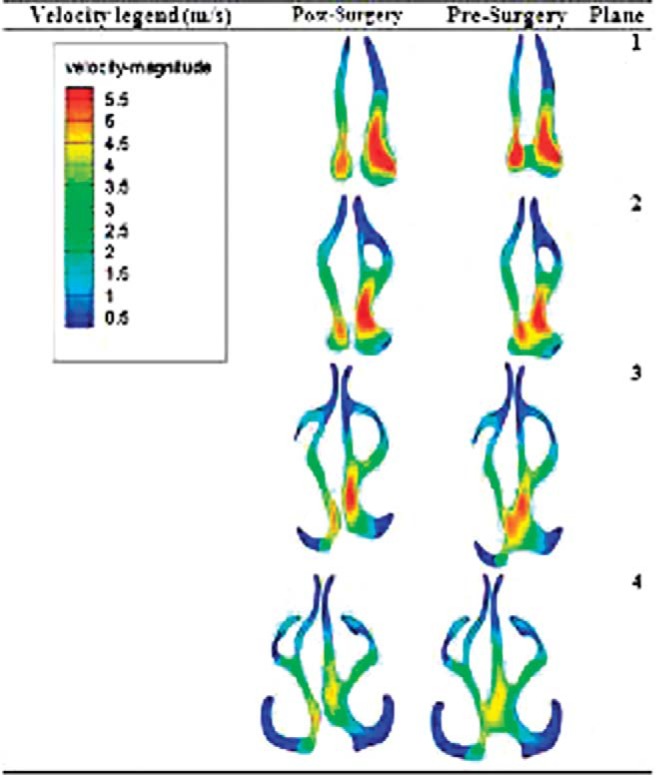
Velocity contours at planes 1–4 (refer to Fig. 1) for a pressure drop of 40 Pa, pre- and postsurgery.
The pressure contours are not shown here for the sake of brevity but, generally, the pressure is lower in the locations where the airflow velocity is higher (lower part of the section in this case). At higher pressure drops where the flow rate is higher, the pressure is lower in the coronal cross-sections. As noted before, after repair of SP the pressure distribution in the main airway did not change noticeably.
The distribution of wall shear stress was also computed. As expected, the wall shear stress increased with the increase of the volume flow rate in the nasal cavity. The shear stress on plane 1, anterior part of SP (Fig. 1), is higher in the upper part of the perforation. In plane 4 (posterior) the shear stress on the lower part of the perforation is higher. The shear stress acting on the mucus layer can reach ∼1 Pa for the pressure drop of 40 Pa in the nasal cavity.
To provide a better insight about the nature of the airflow field in different parts of the nasal cavity, the velocity contour before and after virtual surgery at various cross-sections at nostril, vestibule, nasal valve, main airway, and nasopharynx was evaluated. The results revealed that the pattern of the velocity contours in the nasal cavity did not change noticeably after the repair of the perforation, except for the region around the SP. Maximum velocity occurs in the inlet of the nostril. The flow in the nasal valve around the middle turbinate experiences another high velocity region.
A video was prepared from the simulation results to provide a better understanding of airflow pattern in the nasal passages. The video is for the pressure drop of 5 Pa but shows the structure of the airflow motion, which is similar for all studied flow rates. In the video, the path lines colored by the velocity magnitude are shown. The red color shows the region with high velocity. The video shows the path lines that entered through the right nostril. The air passing through the perforation and entering the left nasal cavity can be easily seen in the video. The video indicates that the flow reached the velocity of 3.12 m/s around the perforation.
DISCUSSION
In this study the detailed aerodynamic patterns of the airflow in the nasal cavity of a patient with SP and pre- and postvirtual repair of SP is reported. We found that the repair of SP did not affect total nasal airflow rate. Airflow velocity and flow rate in the right nasal passage decreased after the repair of SP. This is because of the increased resistance to airflow in the right nasal cavity after repair of the perforation. Also, we found that the pattern of the velocity contours in the nasal cavity did not change noticeably after repair of the perforation, except around the SP. In addition, the airflow velocity is higher in the central region of the perforation and lower around the boundary. The airflow velocity in the SP is higher for the larger pressure drop in the nasal passage. In addition, at the anterior part of the SP, the shear stress was higher in the upper part of the SP but for the posterior part of SP, it was higher in the lower part of the SP.
We compared our results with experimental data of Kelly et al.28 and numerical data of Weinhold et al.29 in Fig. 2. Our results are close to Weinhold's data but differ from Kelly's data, which may be caused by the differences in the geometry passage and anatomy of the patient in the present study with that in Kelly's experimental investigation. In addition, the data reported by Kelly et al. is for a replica model developed from low-resolution MRI, which led to a lower flow rate at a fixed pressure drop compared with that in a smooth nasal passage studied in the present work.
To the best of our knowledge, this is the first study to report CFD data in a real patient who suffered with SP. In the past, however, a few researchers focused on this aspect of rhinology by virtual models. Pless and coworkers created a model from a CT scan of the normal nasal cavity. They generated an anterior cartilaginous SP with a horizontal diameter of the SP was 20 mm and the vertical one was 15 mm virtually. They used a constant nasal wall temperature and airflow velocity for the boundary condition at the inflow of the nose. They found that there were lower temperature values and higher velocities in the upper part of the perforation, and higher temperatures associated with lower velocities in its lower part. They also observed airflow leakage through the perforation.24 We also noticed airflow leakage through the perforation and also assessed the effect of different airflows on aerodynamics of nasal cavity and localized patterns of the flow field on the SP.
In a study by Grant et al.25 CFD analysis was performed in a virtual SP under conditions of steady, laminar flow with a flow rate of 165 mL/s, which corresponds to breathing at rest. This flow rate was obtained with a pressure drop of 50 Pa, which seems high for a breathing rate at rest condition. Although they included the facial effect in their model, nevertheless, this pressure drop for a flow rate on the order of 10 L/min is much higher compared with earlier studies (see Fig. 2). This is probably because of the low resolution of the nasal model prepared by Grant et al., which led to a higher pressure drop. Their results suggested that the nasal valve area had the higher shear stresses in the healthy human case, whereas the posterior wall of the SP had the highest shear stresses in the diseased case. They found the highest velocities across the SP, especially at the anterior end of the SP, and the overall flow regime was similar for both normal and SP cases. Although they did not provide information on the size and location of the SP in their study, they found that the SP did not affect the total airflow rates, similar to our study.
Recently, Lee and coworkers26 used data from MRI scans of a healthy human and reconstructed a virtual SP models, with a diameter of 5, 10, and 15 mm. They used a constant nasopharyngeal airflow velocity of 2 m/s as a boundary condition. In addition, they applied a pressure boundary condition as the pressure inlet of 0 Pa and throat pressure of −50 Pa, to compare their model with the reported findings of Grant et al.25 They observed that the maximum velocity and higher shear stresses are concentrated in the posterior region of the perforation. They also found that there was a flow exchange through the SP during the breathing process, from the higher flow rate to the lower flow rate nostril side. Additionally, they detected that the cross-flow volume did not decrease greatly when the perforation size was reduced from 15 to 10 mm. On the contrary, a large decrease in leakage flow volume was seen when the perforation size was reduced from 10 to 5 mm.
The main differences between our study and the Lee et al.26 studies are the perforation size in the current study is larger than that of Lee et al. In addition, a wide range of the pressure drops and flow rates is considered in this analysis. In the current study, we showed that the shear stress and other flow properties around the SP wall are not much different from those in other locations of the nasal cavity, whereas earlier works did not address this point. Generally, to compare the CFD results for a single model with other studies in the field of rhinology, one needs to be concerned with the intersubject variations in nasal anatomy and passage geometry that lead to significant variations in the nasal aerodynamic patterns.30
In previous works, they created a virtual model of SP. Also, they used constant airflow rate and velocity in their study. Because of virtual SP models, there is a striking absence of correlation between quantitative flow factors and clinical sign and symptoms. Some researchers believed that the location and size of SP is a paramount factor for developing symptoms and posterior SP are usually asymptomatic compared with large anterior SP. They recommended surgery only for symptomatic cases.31
With respect to outcome of the repair of SP, the CFD method can be used as an effective predictive technique to explore the details of nasal airflow in obstructed nasal airways. The advantage of this approach is its capability to provide detailed data that are usually difficult to obtain experimentally, owing to interventions and clinical risks for the human subjects.4,30 Because the repair of SP does not affect the total airflow rate in our patient, we suppose that the dried crusts around SP may lead to obstruction. Therefore, regular nasal care with saline irrigation was recommended and the patient were symptom free during 1-year follow-up.
The strengths of our analyses are the assumption of a wide range of the pressure drops and flow rate situations. Also, in previous works the shear stress around the SP was not compared with other parts of the nasal cavity.
A limitation of CFD application in rhinology is the fact that it is a time-consuming process. However, this shortcoming has improved recently because it is predicted that the computational model of the nasal cavity can be developed in several days in the near future. Another limitation of the present investigation is that is based on a single SP model and, therefore, the results can not be generalized. Nevertheless, we believe important strengths of this study include the emphasis on basic science implications of our findings in the clinical setting and decision making for surgery or to prevent unnecessary or damaging surgical procedures. Based on individualized nasal anatomy models, CFD is a valuable tool to predict successful specific nasal surgery for individual patients.3 We recommend additional studies focusing on the effect of different surgical strategies on the aerodynamic patterns in the field of rhinology.
CONCLUSIONS
Our findings highlight one of the potential clinical implications of the CFD technique as a powerful preoperative assessment tool. Its considerable appeal lies in its pivotal role and ability to find the effect of each anatomic point or surgical manipulation on the aerodynamic variables although they would be very fine and minute. In addition, it is a valuable tool to predict the aerodynamic consequences of specific nasal surgery at any point in individual patients. Also, CFD findings can be used in decision making for surgery or in preventing unnecessary or damaging procedures.
The important clinical lessons are the total flow rate will not be changed after repair of SP and the shear stress around the SP is comparable with other parts of the nasal cavity. Therefore, it is suggested that the patient be managed with conservative nonsurgical actions.
Footnotes
The authors have no conflicts of interest to declare pertaining to this article.
REFERENCES
- 1. Ishikawa S, Nakayama T, Watanabe M, Matsuzawa T. Visualization of flow resistance in physiological nasal respiration: Analysis of velocity and vorticities using numerical simulation. Arch Otolaryngol Head Neck Surg 132:1203–1209, 2006 [DOI] [PubMed] [Google Scholar]
- 2. Gambaruto AM, Taylor DJ, Doorly DJ. Modeling nasal airflow using a Fourier descriptor representation of geometry. Int J Numer Methods Fluids 59:1259–1283, 2009 [Google Scholar]
- 3. Nithiarasu P, Hassan O, Morgan K, et al. Steady flow through a realistic human upper airway geometry. Int J Numer Methods Fluids 57:631–651, 2008 [Google Scholar]
- 4. Peiro J, Formaggia L, Gazzola M, et al. Shape reconstruction from medical images and quality mesh generation via implicit surfaces. Int J Numer Methods Fluids 53:1339–1360, 2007 [Google Scholar]
- 5. Chen XB, Lee HP, Chong VF, Wang de Y. Assessments of nasal bone fracture effects on nasal airflow: A computational fluid dynamics study. Am J Rhinol Allergy 25:e39–e43, 2011 [DOI] [PubMed] [Google Scholar]
- 6. Ishikawa S, Nakayama T, Watanabe M, Matsuzawa T. Flow mechanisms in the human olfactory groove: numerical simulation of nasal physiological respiration during inspiration, expiration, and sniffing. Arch Otolaryngol Head Neck Surg 135:156–162, 2009 [DOI] [PubMed] [Google Scholar]
- 7. Wolf M, Naftali S, Schroter RC, Elad D. Air-conditioning characteristics of the human nose. J Laryngol Otol 118:87–92, 2004 [DOI] [PubMed] [Google Scholar]
- 8. Zamankhan P, Ahmadi G, Wang Z, et al. Airflow and deposition of nano-particles in human nasal cavity. Aerosol Sci Technol 40:463–476, 2006 [Google Scholar]
- 9. Shanley KT, Zamankhan P, Ahmadi G, et al. Numerical simulations investigating the regional and overall deposition efficiency of the human nasal cavity. Inhal Toxicol 20:1093–2100, 2008 [DOI] [PubMed] [Google Scholar]
- 10. Verbanck S, Kalsi HS, Biddiscombe MF, et al. Inspiratory and expiratory aerosol deposition in the upper airway. Inhal Toxicol 23:104–111, 2011 [DOI] [PubMed] [Google Scholar]
- 11. Xiong G, Zhan J, Zuo K, et al. Numerical flow simulation in the post-endoscopic sinus surgery nasal cavity. Med Biol Eng Comput 46:1161–1167, 2008 [DOI] [PubMed] [Google Scholar]
- 12. Xiong GX, Zhan JM, Zuo KJ, et al. Use of computational fluid dynamics to study the influence of the uncinate process on nasal airflow. J Laryngol Otol 125:30–37, 2011 [DOI] [PubMed] [Google Scholar]
- 13. Lindemann J, Brambs HJ, Keck T, et al. Numerical simulation of intranasal airflow after radical sinus surgery. Am J Otolaryngol 26:175–180, 2005 [DOI] [PubMed] [Google Scholar]
- 14. Chen XB, Lee HP, Chong VF, Wang de Y. Numerical simulation of the effects of inferior turbinate surgery on nasal airway heating capacity. Am J Rhinol Allergy 24:e118–e122, 2010 [DOI] [PubMed] [Google Scholar]
- 15. Zhao K, Pribitkin EA, Cowart BJ, et al. Numerical modeling of nasal obstruction and endoscopic surgical intervention: Outcome to airflow and olfaction. Am J Rhinol 20: 308–316, 2006 [DOI] [PubMed] [Google Scholar]
- 16. Chen XB, Lee HP, Chong VF, Wang de Y. Aerodynamic characteristics inside the rhino-sinonasal cavity after functional endoscopic sinus surgery. Am J Rhinol Allergy 25:388–392, 2011 [DOI] [PubMed] [Google Scholar]
- 17. Wexler D, Segal R, Kimbell J. Aerodynamic effects of inferior turbinate reduction: Computational fluid dynamics simulation. Arch Otolaryngol Head Neck Surg 131:1102–1107, 2005 [DOI] [PubMed] [Google Scholar]
- 18. Rhee JS, Pawar SS, Garcia GJ, Kimbell JS. Toward personalized nasal surgery using computational fluid dynamics. Arch Facial Plast Surg 13:305–310, 2011 [DOI] [PMC free article] [PubMed] [Google Scholar]
- 19. Chen XB, Lee HP, Chong VF, Wang de Y. Assessment of septal deviation effects on nasal air flow: A computational fluid dynamics model. Laryngoscope, 119:1730–1736, 2009 [DOI] [PubMed] [Google Scholar]
- 20. Ozlugedik S, Nakiboglu G, Sert C, et al. Numerical study of the aerodynamic effects of septoplasty and partial lateral turbinectomy. Laryngoscope 118:330–334, 2008 [DOI] [PubMed] [Google Scholar]
- 21. Gaball C, Lovald S, Khraishi T, et al. Engineering analysis of an unreported complication of septoplasty. Arch Facial Plast Surg 12:385–392, 2010 [DOI] [PubMed] [Google Scholar]
- 22. Moghaddas H, Abouali O, Faramarzi A, Ahmadi G. Numerical investigation of septal deviation effect on deposition of nano/microparticles in human nasal passage. Respir Physiol Neurobiol 177:9–18, 2011 [DOI] [PubMed] [Google Scholar]
- 23. Garcia GJ, Bailie N, Martins DA, Kimbell JS. Atrophic rhinitis: A CFD study of air conditioning in the nasal cavity. J Appl Physiol 103:1082–1092, 2007 [DOI] [PubMed] [Google Scholar]
- 24. Pless D, Keck T, Wiesmiller KM, et al. Numerical simulation of airflow patterns and air temperature distribution during inspiration in a nose model with septal perforation. Am J Rhinol 18:357–362, 2004 [PubMed] [Google Scholar]
- 25. Grant O, Bailie N, Watterson J, et al. Numerical model of a nasal septal perforation. Stud Health Technol Inform 107:1352–1356, 2004 [PubMed] [Google Scholar]
- 26. Lee HP, Garlapati RR, Chong VF, Wang DY. Effects of septal perforation on nasal airflow: Computer simulation study. J Laryngol Otol 124:48–54, 2010 [DOI] [PubMed] [Google Scholar]
- 27. Fluent 6.3 users guide. Fluent, Lebanon, NH, 2006 [Google Scholar]
- 28. Kelly JT, Asgharian B, Kimbell JS, et al. Particle deposition in human nasal airway replicas manufactured by different methods. Part II. Inertial regime particle. Aerosol Sci Technol 38:1063–1071, 2004 [Google Scholar]
- 29. Weinhold I, Mlynski G. Numerical simulation of airflow in the human nose. Eur Arch Otorhinolaryngol 261:452–455, 2004 [DOI] [PubMed] [Google Scholar]
- 30. Wen J, Inthavong K, Tu J, Wang S. Numerical simulations for detailed airflow dynamics in a human nasal cavity. Respir Physiol Neurobiol 161:125–135, 2008 [DOI] [PubMed] [Google Scholar]
- 31. Mansour HA. Repair of nasal septal perforation using inferior turbinate graft. J Laryngol Otol 125:474–478, 2011 [DOI] [PubMed] [Google Scholar]