

Abstract
Blood flow and blood-endothelium interactions correspond with the genesis of cardiovascular diseases. Therefore, quantitative analysis of blood flow dynamics at the microcirculation level is of special interest. Regulatory mechanisms mediated by blow flow have been studied in detail using in vitro approaches. However, these mechanisms have not been fully validated in vivo due to technical limitations that arise when quantifying microhemodynamics with the required level of detail. Intravital microscopy combined with high-speed video recordings has been use for the analysis of blood flow in small blood vessels of chronic and acute experimental tissue preparations. This tool can be used to study the interaction between the flowing blood and the vessel walls of arterioles and venules with sufficient temporal and spatial resolution. Our objective was to develop a simple and robust cross-correlation algorithm for the automatic analysis of high-speed video recordings of microcirculatory blood flow. The algorithm was validated using in vitro and in vivo systems. Results indicate that the algorithm's ability to estimate the velocity of local red blood cells (RBCs) as a function of blood vessel radius is highly accurate. They thereby suggest that the algorithm could be used to explore dynamic changes in blood flow under different experimental conditions including a wide range of flow rates and hematocrit levels. The algorithm can also be used to measure volumetric flow rates, radial velocity profiles, wall shear rate (WSR), and wall shear stress (WSS). Several applications are presently explored, including the analysis of velocity profiles in the branches of arterial bifurcations. This work demonstrates the robustness of the cross-correlation technique in various flow conditions and elucidates its potential application for in vivo determination of blood flow dynamics in the microcirculation.
Keywords: Intravital microscopy, microcirculation, hemorheology
Introduction
Maintenance of an adequate microcirculation function is a key factor for the survival of tissues during the progression of several pathological conditions including extreme anemia, hypovolemic shock and sepsis1,2. Quantitative analysis of the microcirculatory function in different animal experimental preparations allows for a deep understanding of the mechanisms involved in cardiovascular regulation and thereby the validation of therapeutic treatments3. A robust analysis of microcirculation functions requires quantification of morphological, vascular geometrical, and blood flow dynamic conditions1. Microvascular regulation is determined most prominently by changes in vessel diameter and perfusion. Changes in diameter are dynamic but slow and can be easily studied using image analysis 4. On the other hand, analysis of blood flow conditions is more challenging since normal mean blood velocities are on the order of 1 to 17 mm/s for arterioles and 0.5 to 7 mm/s for venules. This wide range and high magnitude of velocities requires more sophisticated measurement techniques. Intravital microscopy videos attained in previous studies using particle image velocimetry (PIV) have limited temporal resolution due to video camera frame rate as well as limited spatial resolution due to the low number of particles that can be injected without creating an intrinsic change in blood rheology 5. Micro-PIV has been also used to study the fluid-wall interaction in the mouse cremaster muscle venules6. However, blood flow in venules is not exposed to inertial forces, and the observation cannot be directly extrapolated to other segments of the circulation.
A large number of studies of endothelial cells (ECs) in culture have been undertaken in recent years to elucidate mechanisms of interaction between the mechanical stimuli produced by flowing blood and EC function, spanning to microvascular physiology and pathophysiology 7,8. However, the effect of mechanical signals on the vascular endothelium in vivo has only been analyzed in a few studies9. In vivo investigations are essential to translate EC cultures results to more clinically relevant scenarios. The relationship between blood flow and EC mechanotransduction, as well as its role in determining vascular resistance and protection from the development of atheromatous plaque, is of particular importance 10. Mechanical forces are transmitted from the blood flow to the endothelium in the form of wall shear rate (WSR) and wall shear stress (WSS) 11. These parameters are challenging to quantify in vivo and most microvascular hemodynamic studies assume Poiseuille flow to report pseudo-wall shear rate (8 times velocity ratio to diameter) and pseudo-wall shear stress (wall shear rate times the blood viscosity) 12. Thus, a method that allows for the estimation of real WSR and WSR based on the velocity distribution in microvessels is required in order to confirm in vitro results with ECs in vascular disease conditions.
High-speed video recording from intravital microscopy has been used as a tool to observe changes in the microcirculation with high spatial and temporal resolution13. This manuscript presents the development and validation of a methodology to quantify microhemodynamic parameters from high-speed videos (500 – 3000 fps: frames per second) recorded from intravital microscopy in experimental preparations. The technique is based on 2D image cross correlation and was implemented as a plugin algorithm for the open source software ImageJ (http://imagej.nih.gov/ij/), cross correlation techniques have been previously reported to perform this type of analysis14. The algorithm was used to calculate instant blood flow velocity and build velocity profiles in microvessels. Validation for this technique was obtained using different approaches, namely computer-generated videos showing particles moving at known velocities, an in vitro setup used to image blood samples flowing through capillary glass tubes at known flow rates, and an in vivo setup using the rat cremaster muscle preparation. As this method need not use any fluorescent probes or contrast media, its potential use extends to less invasive scenarios.
Methods
2D cross correlation algorithm
Cross correlation is a signal processing technique used to identify parts of a signal/image within others. Mathematically, the cross correlation is the maximized convolution of two signals as a function of a relative offset applied to one of them. When applied to time series (1D numerical arrays), the cross correlation coefficients are calculated as a function of an applied time shift. When used in image processing, the 2D cross correlation coefficients are calculated as a function of an (i, j) coordinate based on the current frame of reference and the coordinate where the maximum similarity is found on the proceeding frame 15. Our algorithm uses 2D cross correlation to calculate the displacements of red blood cells (RBCs) flowing inside microvessels.
The algorithm schematic workflow is shown in Figure 1A. To estimate the relative displacement and velocity, the algorithm locates a sub-image in two consecutive video frames. This process is completed for equally spaced points along the radial direction of the microvessel, frame-by-frame, to build the velocity profiles. Briefly, an image for a frame (F1) and its consecutive frame (F2) are transformed in to a numerical matrix. Then, a sub-image (IW: interrogation window, with X pixels wide and Y pixels high), is selected at the top left of F1 and the normalized cross correlation coefficients are calculated for the IW along F1 and along F2 using equation 1. The location of the IW within F1 and F2 corresponds to the position where the maximum correlation coefficients are found. Figure 1B, shows the correlation coefficients for F1 (CCF1) and for F2 (CCF2) as a function of the longitudinal displacement applied to IW (correologram). As it is shown in the correologram, all the calculated correlation coefficients are very high (>0.99), which is explained by the relatively uniform size and shape of the RBCs observed inside the vessel. The distance between the absolute maxima in the correologram is the best estimative of the displacement of the region of the blood flow represented by the IW. Thus, the displacement of the portion represented by the IW is calculated as the difference in positions for IW on F1 and F2, (dL, Figure 1B). The velocity is calculated using the displacement and the time between frames (determined by the camera frame rate). Then, a new IW is selected Y pixels down from the original in the longitudinal direction of the vessel and the 2D cross correlation process is repeated, to calculate the velocity of the new IW. This is repeated until the entire longitude of the vessel is covered and the velocity for a radial position is calculated as the average of the velocities for each IW. For the next radial point, the process is repeated selecting a new IW at the top of F1, with a radial shift of X pixels. For the next time point analysis, F2 becomes F1 and the consecutive frame becomes F2.
Figure 1.

| (1) |
Equation 1. M is the number of rows in F1. N is the number of columns in F1 and Y is the length of the IW.
Intravital Microscopy and high speed video recording
The experimental setup for high speed video acquisition consisted of an intravital microscope (Olympus-BX51WI), equipped with a 40X objective (LUMPFL-WIR, NA= 0.8; Olympus) and a matching custom long working distance condenser with NA = 0.8 (Thorlabs, Newton, NJ). Additionally, two magnifications of 2X and 1.5X were installed between the objective and the camera to provide an equivalent pixel size of 0.50 μm. Tissue was illuminated with a mercury arc lamp (100 W, Walker Instruments, Scottsdale, AZ). A 400 nm interference filter (Spectra Physics, no. 59820) was placed in the light path to maximize image contrast. Images were recorded with a high speed video camera (Fastcam 1024 PCI, Photron USA) equipped with a one megapixel chip (1000 × 1000 pixels). All videos were recorded at 2000 fps and the camera shutter speed was increased to obtain the sharpest and clearest image possible.
Micro hemodynamic parameters
To obtain velocity profiles, videos were analyzed offline using the previously described cross correlation algorithm. Blood vessel or capillary glass tube diameter was measured from the acquired images using ImageJ. Volumetric flow rate (Q) was calculated by integrating the velocity measured across the center of the vessel over the cross sectional area of the vessel/tube assuming a circular geometry.
Numerical integration was calculated using Simpson's 1/3 rule. Integration of the velocity profiles takes into account the shape of the profile. Wall shear stress (WSS) was calculated from the velocity profiles as WSS = WSR × μ, where wall shear rate (WSR) was calculated as the slope of the linear fit of 3 consecutive velocity points near each vessel/tube wall and μ is the blood viscosity at the specific shear rate. The bluntest of the velocity profiles were estimated by fitting the velocity profile with equation 2. The parameter k was used to analyze the deviation of the shape of the velocity profile from an ideal parabola (k = 2).
| (2) |
Algorithm validation
The first validation of the algorithm was completed using computer-generated videos that mimicked flowing red cells with known displacement between frames. The second validation was completed using an in vitro experimental setup of blood samples flowing inside capillary glass tubes at known flow rates. In vitro recordings from the glass tubes were also used to study the influence of image capture conditions namely interrogation window (IW) size, hematocrit level, illumination color and depth of correlation (DOC).
Computer generated videos
Computer-generated videos were used to validate the ability of the algorithm to accurately track the position and velocity of moving particles in optimal image conditions (no noise and perfectly defined shapes). The generated videos consisting of image series that showed circular shapes (25 pixels diameter) moving at constant velocity with a parabolic velocity distribution.
In vitro recordings
Capillary glass tubes were pulled (P-87 micropipette puller, Sutter Instruments; Novato, CA) to produce a capillary with an internal diameter of 80 ± 10 um and a minimal length of 10 mm. Tubes were fixed to the microscope stage and the image was focused on the widest radius. Blood was pumped at known flow rates using a 100 μl syringe (Hamilton company, Reno, NV) and a syringe pump (33 syringe pump, Harvard Apparatus; Holliston, MA) and collected on a waste container at the other end. With this configuration, the pump produced continuous flow rates for volumetric flows higher than 10 nL/s. Videos of blood flowing through the glass tubes were recorded on the setup described before.
Influence of interrogation window size
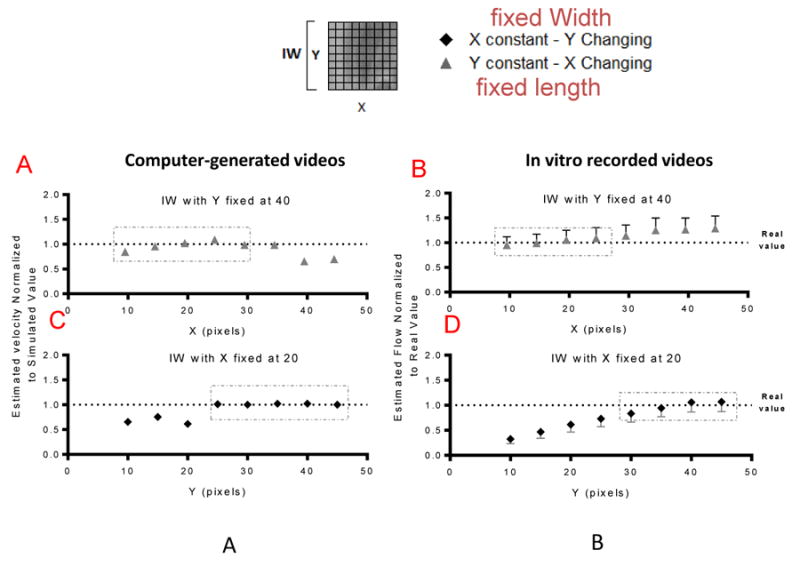
The IW effect was analyzed using simulated and in vitro recorded videos. The videos were analyzed using different IW sizes, first keeping the width constant (20 pixels) and changing the length between 10 to 45 pixels, and then keeping the length constant (40 pixels) and changing X from 10 to 45 pixels. Measured blood flow rate and mean velocity at different IW sizes were compared to nominal values.
Influence of hematocrit
The effect of hematocrit (10, 20, 30 and 40%) was studied using an in vitro setup. The desired hematocrit levels were achieved by diluting fresh blood with phosphate buffered saline.
Illumination conditions
Videos of flowing blood at 25 and 40% hematocrit were recorded using blue (400 nm), green (570 nm), red (680 nm) and white light. The signal to noise ratio (SNR) was defined as the ratio between real flow rate and the error, where error was defined as , where SD is standard deviation of the Q measurements.
Influence of camera frame rate
Our algorithm was developed to work in the analysis of videos acquired using high speed video recordings. We analyzed the influence of the camera frame rate on the algorithm's output by recording the same vessel segment at acquisition velocities, namely 1000, 500, 250, 125 and 60 fps.
Effects of depth of correlation (DOC)
The DOC was used to describe the extent to which particles out of focus could affect the result of the image processing algorithm 16. The DOC of our system was studied by recording videos at different focal planes, beginning at the center of the glass tube and moving up and down in successive 5 μm intervals.
Velocity profile comparison
Microparticle image velocimetry (Micro-PIV) was used to validate the shape of the velocity profiles. Briefly, a sample of 10 ul of Fluoresbrite YG microspheres (0.513 ± 0.01 μm, Polysciences, Warrington, Pennsylvania, cat no: 17152) was added to 1 mL of fresh blood. The blood was pumped through a capillary glass tube using a syringe pump as described before. The glass tubes were mounted on the stage of an intravital fluorescent microscope (Olympus-BX51WI, Olympus USA) equipped with an Olympus ×40 (NA = 0.8). Tubes were illuminated using an Hg arc lamp (100 W, Walker Instruments, Scottsdale, AZ) and a 440 nm Filter (Omega, Brattleboro, VT). Fluorescent images were captured using image intensified CCD camera (XR/MEGA-10Z, Stanford Photonics Inc., Palo Alto, CA) at 120 frames/s and the intensifier was synchronized with the camera acquisition and gated for 100 ms at a frequency of 1 kHz. This setup provides 6 images of a microsphere per video frame. Velocities were analyzed offline by tracking individual microspheres. The difference of velocity at each radial point was used to compare the Micro-PIV and 2D cross correlation methods.
In vivo Imaging
Cremaster preparation and hemodilution protocol
All of the experiments involving animals were performed following the Guide for the Care and Use of Laboratory Animals (US National Research Council, 2010). The University of California, San Diego Institutional Animal Care and Use Committee approved experiments. In vivo studies were performed in Sprague-Dawley rats (Harlan Laboratories, Livermore, CA) weighing between 153-208 g. The rat cremaster muscle model is widely used in microcirculation studies. Animal preparation and complete surgical details are described elsewhere 17. Briefly, rats were anesthetized with 60 mg/kg of pentobarbital sodium and additional anesthesia was administered throughout the experiment as needed. The left carotid artery was catheterized for blood withdrawals and pressure measurements; the right jugular vein was also catheterized for anesthesia administration. Rats were positioned on a plexiglas plate while the cremaster muscle was secured to a platform for visualization. During the procedure the muscle temperature was maintained using a temperature controller (Physitemp Instruments, Inc. Clifton, NJ). The exposed muscle was covered with saran wrap (Dow Corning, Indianapolis, IN). Normovolemic hemodilution to a final hematocrit of 30% was performed by withdrawing blood from the carotid artery and replacing the same volume with either an aggregating solution (3% dextran 2000 kDa, Sigma Aldrich) or a non-aggregating solution (5% human albumin, Sigma Aldrich) to analyze the influence of blood aggregates over the shape of the velocity profiles. Blood aggregation was confirmed using the photometric rheoscope Myrenne aggregometer (Myrenne Aggregometer®, Germany), as described elsewhere 18. All animals were euthanized at the end of the experiment.
Intravital recordings
The animals were allowed a 15-minute recovery period following transfer to the microscope before any measurement was obtained. Microvascular fields for measurement were selected based on visual clarity and the presence of interesting vessels (i.e straight segments or arteriolar bifurcations). The microscope was focused on the diametrical plane of the arteriole and the video was recorded. Videos of blood flow were recorded at baseline and 30 minutes after the hemodilution in the same vessels. The coefficient of variation (CV) of the velocity measurements was defined as the standard deviation divided by the average value at each radial point.
Statistical analysis
Results are presented as a mean ± standard deviation. All statistical calculations and graphics were performed with a commercially available software package (Prism 4.0, GraphPad). For all tests, P < 0.05 was accepted as statistically significant.
Results
Algorithm validation
Influence of IW over volumetric flow rate and velocity estimation
Figure 2A and 2B show the effect of changes in length of the IW for a fixed with of 40 pixel in the measured velocity for the computer-generated videos relative to the real velocity and in relative the volumetric flow rate for the in vitro videos respectively to the effective flow rate, respectively. and Figure 2C and 2D show the effect of changes in width of the IW for a fixed length of 20 pixel in the measured velocity for the computer-generated videos relative to the real velocity and in the flow for the in vitro videos respectively to the effective flow rate, respectively. According to our results, the length of the IW (Y) affects the results when it is too small, however, when the length of the IW Y after a certain value (25 pixels Figure 2A and 30 pixels Figure 2B) it didn't seem to have a profound effect on the results. The results were less sensitive to the width (X) of the IW, for values of X smaller than the moving particles the values are closely estimation. Bigger differences start to arise when the X is around 2 times the size of the moving particles. Interestingly, at this point, for the simulated images the values were underestimated whereas for the in vitro recording the values were slightly over estimated. We propose this difference to arise from the nature of the movement and the quality of the images, the simulated videos have motion only in the longitudinal direction and have no noise present, whereas the in vitro recordings might present velocitites in the radial direction and the images are more blurry and noisy. Optimal results were obtained when the IW size was close to the size of the moving particles (7.5 um for RBCs and 25 pixels for generated images, pixel size is 0.50 μm).
Figure 2.
Influence of hematocrit
Figure 3 shows effects of tube hematocrit on flow rate estimation. The tube hematocrit appears to be a critical parameter in the estimation of volumetric flow rate and velocity profiles. For low tube hematocrits (10 - 20%), flow rate was closely estimated and low variation of the data was observed, while for higher hematocrits (30 - 40%), the calculated flow rates presented more noise (higher SD), mostly due to fewer discernable shapes present as the hematocrit increases.
Figure 3.

Illumination Conditions
Flow rates measurements and SNR for different illumination color for hematocrits of 25 and 40% are shown in Figure 4. For the presented hematocrits, blue and red light showed the best results overall in terms of estimation of the real flow value and signal to noise ratio. Interestingly, for every illumination color the flow rate was generally underestimated, except for blue color, in which case the flow rate was slightly overestimated. Depending on the experimental set up it would be very easy to record videos under different illumination conditions. However, we recommend to use a single illumination color, preferably blue, to keep reliability of the data obtained in vivo.
Figure 4.

Influence of camera frame rate
The velocity profiles for a vessel segment recorded at different frame rates are shown in Figure 5 A-E. Figure 5F shows the change in the minimum resolvable displacement as a function of the camera frame rate, assuming a mean velocity inside the vessel of 7 mm/s. The rise in the minimum resolvable displacement with the decrease in the camera frame rate increases the variability of the determined velocity profiles.
Figure 5.

DOC
The DOC parameter sheds light on the effect that out of focus particles have on the estimated blood velocity. Effects of DOC in the estimated flow rate with changes in the microscope focal plane are shown in Figure 6 for blood at 25% hct. In this case blue light reduced the DOC effect on velocity and flow determination. Videos recorded with red light were more sensitive to DOC compared to blue light.
Figure 6.

Shape of the velocity profiles
Sample velocity profiles built using the Micro-PIV and 2D cross correlation are shown in Figure 7A. Velocity profiles comparison was completed for 9 videos at 25% hematocrit with 3 flow rates (2.5, 3 and 3.5 ul/min) with three videos per flow rate. The differences in the normalized velocity measured using both methods (Vpiv-Valgorithm) at different points along the diameter of the vessel for the 9 videos analyzed are presented in Figure 7B. The mean differences in the parameter k were 0.12, 0.152 and 0.21 for the 2.5, 3 and 3.5 ul/min flow rates, respectively. Small changes in k value indicate that the shapes of the profiles using both methods are similar. The differences between Micro-PIV and 2D cross correlation increased with flow rate, mostly due to the limitations of the Micro-PIV method.
Figure 7.

In vivo measurements
Three animals were used for in vivo algorithm validation. Three to five straight arteriolar segments and two to four bifurcations were recorded and analyzed per animal.
Velocity profiles
Velocity profiles obtained from in vivo videos show a parabolic shape. Figure 8 shows velocity profiles for straight arteriolar segments and the coefficient of variation of the velocity measurements with and without blood aggregation. The highest variability was determined to be near the vessel walls. Fast blood flow (Q = 22 nL/s) corresponds to systole and slow blood flow (Q =12 nL/s) to diastole. Aggregates in the blood yield a blunted velocity profile, which increased the value of k19. The algorithm was able to detect the effects of blood aggregation.
Figure 8.

Velocity distribution in bifurcations
Velocity profiles in the branches of an arterial bifurcation are shown in Figure 9A. The profiles show a shift in the maximum velocity from the center on the vessel to one of the vessel walls. This change in the shape of the velocity profiles is caused by the disturbance in the flow continuity at the bifurcation point, which causes alterations in wall shear rate and wall shear stress distributions. The sum of the flow rate at the two branches of the bifurcation should be equal to the flow rate in the feeding arteriole (Q1=Q2+Q3). The algorithm was able to compute this relationship with only 14 ±3 % error.
Figure 9.

Microhemodynamic changes over time
Temporal changes of velocity and blood flow are shown in Figure 9B. This example presents the changes on maximum velocity over time for an arteriole with 90 μm in diameter. Temporal resolution allows for estimation of velocity fluctuations due to the pulsatile nature of blood flow in the arterioles. Variations on the calculated WSS over time in the same arteriole are shown in Figure 9C; this result shows the possibility to use our algorithm to estimate changes in fluid-wall interactions with high temporal resolution.
Discussion
This study presents an image-processing algorithm to estimate blood flow velocity in microvessels using high-speed video recordings from intravital microscopy. It also illustrates the limitations and factors affecting the velocity estimation. The method is based on the determination of the displacement features and patterns between consecutive images in a video. Maximal velocity determination is limited by image pixel size and frame rate. The algorithm requires good video image quality, limiting its application to venules and arterioles with well-defined shapes and borders. Previous studies have reported similar methodologies to estimate blood flow velocity distribution in microchannels; however most of the existing literature is not applicable to in vivo microvascular measurements. Recently, Tsukada et al 20 presented a cross correlation based method for microvessels, but their work has limited spatial and temporal resolution compared to our setup and algorithm. Thus, our method is more appropriate for in vivo microhemodynamic analysis. Previously published techniques, such as laser scanning microscopy 21, interrogate deeper microvessels in the tissue and require fluorescent dyes to track the individually labeled RBCs. Laser scanning microscopy lacks of temporal and spatial resolution needed to analyze velocity profile, estimate shear rates and blood flow patterns in microvessels with sufficient temporal resolution.
Hematocrit influences the velocity calculations, as high hematocrit levels limit the ability of the method to distinguish edges and moving shapes. This decreases the cross correlation's effectiveness in identifying moving patterns. Results were more accurate for tube hematocrit contents <30%. It is important to take into account the widely known difference between systemic and tube hematocrit 22. A reduction in tube diameter causes a reduction in the tube hematocrit, which resembles a hemodiluted state. Hence, a value of 30% tube hematocrit in microvessels of less than 80 μm diameter would correspond to normal systemic hematocrits (40- 45%).
Illumination color influence
Illumination effects can be explained by the ability of hemoglobin in the RBCs to absorb light and the smallest feature that can be imaged by the system. RBCs have a peak light absorption around 400-440 nm (blue light), so shapes present in videos under blue illumination are more clearly defined. This clarity leads to better cross correlation coefficient calculations, a phenomenon that is beneficial up to certain hematocrit level. For high hematocrit levels illuminated with blue light, almost all light is absorbed, leaving only poorly defined shapes to be observed. Spatial resolution of our system as a function of wavelength could be a factor affecting the results Using geometrical optics,23 the the spatial resolution of the system as a function of the illumination color wavelength can be calculated as as R= (0.51*λ)/NA, where R is the resolution, λ is the light wavelength and NA is the objective's numerical aperture. Resolution was calculated to be 0.29, 0.31 and 0.41 μm for blue, green and red light, respectively, for our setup. The accuracy of the fit in the case of the 25% tube hematocrit experiments was directly related with the spatial resolution, meaning that the light that provides better spatial resolution (blue) produced better results in the estimation of the flow rate and the light that provides the lowest spatial resolution (red) caused an underestimation of the flow rate.
In vivo results and physiological implications
Velocity profiles were attained for straight arteriolar segments and diverging bifurcations. The results supported the validity of the proposed method to detect changes in the velocity profiles due to red cell aggregation and changes in blood rheology. The data obtained with our algorithm is consistent with previous reported effects red cell aggregation19. Our method can be potentially used to analyze microcirculation under physiological and pathophysiological conditions affecting blood flow or hemorheology. Temporal resolution of the velocity estimation by our algorithm allows for the calculation of temporal variation of the interactions between fluid flow and the vascular endothelium. These measurements could also serve as a tool to estimate changes in the blood flow regimes during different pathological conditions or external stimuli. For example, it has been observed that the transfusion of stored red blood cells causes several changes in the blood flow dynamics in the microcirculation, such as the width of the cell-free or cell-depleted layer near the blood vessel wall and its temporal variations, altered volumetric flow rate, blunted velocity profiles, and disturbed wall shear rate24,25
The analysis of velocity profiles in arteriolar bifurcations and their relationship with wall shear rate and shear stress has great implications for the understanding of cardiovascular physiology. The progression of pathophysiological conditions, such as arteriosclerosis, has been related to disruption of mechanotransduction in locations such as bifurcations 26-28. Changes in wall shear rate and shear stress could serve as a tool to understand the genesis of such conditions and evaluate therapies for them. Our methodology makes possible a quantification of hemodynamics from microcirculation video recordings, even in clinical scenarios, as it does not require fluorescent dyes or contrast media. The visualization of tissue via the recording of high-speed video images has been shown successful in tissues such as the conjunctive and tongue 29.With further exploration, the analysis of the microcirculatory function with the presented level of detail in the intensive care unit could ultimately change the way that diseases are diagnosed and treated 30.
Error analysis and limitations of the method
The experimental setup and video quality are the principal source of error affecting our algorithm. The major intrinsic experimental setup-related errors are the illumination conditions, notably the hematocrit and optical aberrations of the setup. These optical aberrations arise from the different index of reflections among water (n=1.33), glass (n=1.473), and tissue. According to Snell's law, the visualized area does not correspond exactly to flat focal plane, as the incident light changes its direction when passing from two media with different diffraction indices. This phenomenon for a similar experimental setup has been previously modeled and analyzed, suggesting that the use of an immersion oil objective matching the glass refraction index can reduce optical aberrations 31. To measure flow in vivo, a correction factor can be established for the specific setup 31. A source of error in the calibration of the algorithm is the compliance of the tubes connecting the syringe pump and the glass capillaries. The tube compliance and pump screw mechanism produced a slight pseudo-pulsatile flow at flow rates higher than 20 nL/s. The limitations in magnification and frame rate are mainly determined by the amount of light required and the size of the observed field. Excessive illumination increases the temperature of the tissue and produces pathological alteration. Decreasing the magnification to study whole vascular networks will limit the analysis of single vessels down to the capillary level (6 um in diameter); although, average velocity can still be measured in capillaries. The volumetric flow rates were calculated integrating the measured velocity over the cross sectional area of the blood vessel. This provides a more realistic estimation of volumetric flow rates that using the mean average velocity, since it takes into account the shape of the velocity profile and the circular section of the blood vessel. However, blood vessel does not always have circular cross sectional area; in many cases the cross section is elliptical, which can introduce an error in the calculation of blood flow.
Conclusions
Our 2D cross correlation-based algorithm allows the quantification microhemodynamic parameters. Our algorithm in combination with our high-speed video microscopy setup has great potential to analyze changes in blood flow with high spatial and temporal resolution. In vitro validation of the method showed that volumetric flow rate and velocity profiles could be estimated with high accuracy for tube hematocrits lower than 30%. The results showed dependence with the video capture conditions. In particular, the illumination color proved to be an important factor in the accuracy of the results. Different refraction indices of the objective immersion fluid and glass tubes might be a cause for flow velocity underestimation. In an in vivo setup, refraction index mismatch are less relevant and a correction factor can be implemented to overcome this limitation. Measurements performed using simulated videos showed that the cross correlation algorithm predicts the displacement of frame-by-frame images with 100% accuracy at the proper IW size. The optimal IW size was found to be related to the size of the shapes moving in the simulated video and that of RBCs for the in vivo analysis. Thus, a preprocessing of the images can be used to define the optimal IW for each specific set of videos to analyze. In vivo measurements using our algorithm showed good correlation with previous observations of blood flow in microcirculation. The algorithm served not only to calculate flow velocity and velocity profiles but also to calculate wall shear rate and shear stress. The validation presented in this paper serves as a starting point for the analysis of microvascular blood flow dynamics during any experimental condition in vivo. Further development of the algorithm should involve reducing its sensitivity to video capture conditions.
Acknowledgments
This investigation was supported by the following grants: NIH R01 HL52684, R01 HL064395 and R01 HL062318 and ARMY: W81XWH-11-2-0012. The author thanks Froilan P. Barra and Cynthia Walser for the surgical preparation of the animals.
References
- 1.De Backer D, et al. How to evaluate the microcirculation: report of a round table conference. Critical Care. 2007;11:R101. doi: 10.1186/cc6118. [DOI] [PMC free article] [PubMed] [Google Scholar]
- 2.Intaglietta M, Cabrales P, Tsai AG. Microvascular perspective of oxygen-carrying and-noncarrying blood substitutes. Annu Rev Biomed Eng. 2006;8:289–321. doi: 10.1146/annurev.bioeng.8.061505.095713. [DOI] [PubMed] [Google Scholar]
- 3.Segal SS. Regulation of blood flow in the microcirculation. Microcirculation. 2005;12:33–45. doi: 10.1080/10739680590895028. [DOI] [PubMed] [Google Scholar]
- 4.Colantuoni A, Bertuglia S, Intaglietta M. Quantitation of rhythmic diameter changes in arterial microcirculation. American Journal of Physiology-Heart and Circulatory Physiology. 1984;246:H508–H517. doi: 10.1152/ajpheart.1984.246.4.H508. [DOI] [PubMed] [Google Scholar]
- 5.Nakano A, Sugii Y, Minamiyama M, Niimi H. Measurement of red cell velocity in microvessels using particle image velocimetry (PIV) Clinical hemorheology and microcirculation. 2003;29:445–455. [PubMed] [Google Scholar]
- 6.Smith ML, Long DS, Damiano ER, Ley K. Near-wall micro-PIV reveals a hydrodynamically relevant endothelial surface layer in venules in vivo. Biophysical journal. 2003;85:637–645. doi: 10.1016/s0006-3495(03)74507-x. [DOI] [PMC free article] [PubMed] [Google Scholar]
- 7.Chiu JJ, Chien S. Effects of disturbed flow on vascular endothelium: pathophysiological basis and clinical perspectives. Physiological reviews. 2011;91:327–387. doi: 10.1152/physrev.00047.2009. [DOI] [PMC free article] [PubMed] [Google Scholar]
- 8.Johnson BD, Mather KJ, Wallace JP. Mechanotransduction of shear in the endothelium: basic studies and clinical implications. Vascular Medicine. 2011;16:365–377. doi: 10.1177/1358863X11422109. [DOI] [PubMed] [Google Scholar]
- 9.Reneman RS, Arts T, Hoeks AP. Wall shear stress–an important determinant of endothelial cell function and structure–in the arterial system in vivo. Journal of vascular research. 2006;43:251–269. doi: 10.1159/000091648. [DOI] [PubMed] [Google Scholar]
- 10.Gimbrone MA, García-Cardeña G. Vascular endothelium, hemodynamics, and the pathobiology of atherosclerosis. Cardiovascular Pathology. 2012 doi: 10.1016/j.carpath.2012.06.006. [DOI] [PMC free article] [PubMed] [Google Scholar]
- 11.Hahn C, Schwartz MA. Mechanotransduction in vascular physiology and atherogenesis. Nature Reviews Molecular Cell Biology. 2009;10:53–62. doi: 10.1038/nrm2596. [DOI] [PMC free article] [PubMed] [Google Scholar]
- 12.Huang TC, Lin WC, Wu CC, Zhang G, Lin KP. Experimental estimation of blood flow velocity through simulation of intravital microscopic imaging in micro-vessels by different image processing methods. Microvascular research. 2010;80:477. doi: 10.1016/j.mvr.2010.07.007. [DOI] [PubMed] [Google Scholar]
- 13.Hightower CM, Yalcin O, Vazquez BY, Johnson PC, Intaglietta M. Effect of plasma expander viscosity on the cell free layer. Biorheology. 2011;48:115–125. doi: 10.3233/BIR-2011-0586. [DOI] [PubMed] [Google Scholar]
- 14.Pries A. A versatile video image analysis system for microcirculatory research. International journal of microcirculation, clinical and experimental/sponsored by the European Society for Microcirculation. 1988;7:327–345. [PubMed] [Google Scholar]
- 15.Shapiro RHL, Haralick R. Computer and robot vision. Reading: Addison-Wesley. 1992 [Google Scholar]
- 16.Chayer B, de Guise JA, Cloutier G. IEEE.Biomedical Imaging: From Nano to Macro, 2008. ISBI 2008. 5th IEEE International Symposium on; pp. 1359–1362. [Google Scholar]
- 17.Bagher P, Segal SS. The mouse cremaster muscle preparation for intravital imaging of the microcirculation. Journal of visualized experiments: JoVE. 2011 doi: 10.3791/2874. [DOI] [PMC free article] [PubMed] [Google Scholar]
- 18.Elmer J, Cabrales P, Wang Q, Zhang N, Palmer AF. Synthesis and biophysical properties of polymerized human serum albumin. Biotechnology progress. 2011;27:290–296. doi: 10.1002/btpr.531. [DOI] [PubMed] [Google Scholar]
- 19.Bishop JJ, Nance PR, Popel AS, Intaglietta M, Johnson PC. Effect of erythrocyte aggregation on velocity profiles in venules. American Journal of Physiology-Heart and Circulatory Physiology. 2001;280:H222–H236. doi: 10.1152/ajpheart.2001.280.1.H222. [DOI] [PubMed] [Google Scholar]
- 20.Tsukada K, Minamitani H, Sekizuka E, Oshio C. Image correlation method for measuring blood flow velocity in microcirculation: correlation window'simulation and in vivo image analysis. Physiological measurement. 2000;21:459. doi: 10.1088/0967-3334/21/4/303. [DOI] [PubMed] [Google Scholar]
- 21.Kamoun WS, et al. Simultaneous measurement of RBC velocity, flux, hematocrit and shear rate in vascular networks. Nature methods. 2010;7:655–660. doi: 10.1038/nmeth.1475. [DOI] [PMC free article] [PubMed] [Google Scholar]
- 22.Barbee JH, Cokelet GR. The Fahraeus effect. Microvascular research. 1971;3:6–16. doi: 10.1016/0026-2862(71)90002-1. [DOI] [PubMed] [Google Scholar]
- 23.Lima R, Wada S, Tsubota Ki, Yamaguchi T. Confocal micro-PIV measurements of three-dimensional profiles of cell suspension flow in a square microchannel. Measurement Science and Technology. 2006;17:797. [Google Scholar]
- 24.Yalcin O, Ortiz D, Tsai AG, Johnson PC, Cabrales P. Microhemodynamic aberrations created by transfusion of stored blood. Transfusion. 2013 doi: 10.1111/trf.12361. [DOI] [PMC free article] [PubMed] [Google Scholar]
- 25.Tsai AG, Cabrales P, Intaglietta M. Microvascular perfusion upon exchange transfusion with stored red blood cells in normovolemic anemic conditions. Transfusion. 2004;44:1626–1634. doi: 10.1111/j.0041-1132.2004.04128.x. [DOI] [PubMed] [Google Scholar]
- 26.Ku DN, Giddens DP, Zarins CK, Glagov S. Pulsatile flow and atherosclerosis in the human carotid bifurcation. Positive correlation between plaque location and low oscillating shear stress. Arteriosclerosis, thrombosis, and vascular biology. 1985;5:293–302. doi: 10.1161/01.atv.5.3.293. [DOI] [PubMed] [Google Scholar]
- 27.Zarins CK, et al. Carotid bifurcation atherosclerosis. Quantitative correlation of plaque localization with flow velocity profiles and wall shear stress. Circulation Research. 1983;53:502–514. doi: 10.1161/01.res.53.4.502. [DOI] [PubMed] [Google Scholar]
- 28.Malek AM, Alper SL, Izumo S. Hemodynamic shear stress and its role in atherosclerosis. JAMA: the journal of the American Medical Association. 1999;282:2035–2042. doi: 10.1001/jama.282.21.2035. [DOI] [PubMed] [Google Scholar]
- 29.Bauer A, Kofler S, Thiel M, Eifert S, Christ F. Monitoring of the sublingual microcirculation in cardiac surgery using orthogonal polarization spectral imaging: preliminary results. Anesthesiology. 2007;107:939–945. doi: 10.1097/01.anes.0000291442.69337.c9. [DOI] [PubMed] [Google Scholar]
- 30.Ince C. The microcirculation is the motor of sepsis. Critical Care. 2005;9:S13. doi: 10.1186/cc3753. [DOI] [PMC free article] [PubMed] [Google Scholar]
- 31.Kuang C, Zhao W, Yang F, Wang G. Measuring flow velocity distribution in microchannels using molecular tracers. Microfluidics and nanofluidics. 2009;7:509–517. [Google Scholar]