Summary
Successful mammalian cloning employing somatic cell nuclear transfer (SCNT) into unfertilized, metaphase II-arrested (MII) oocytes attests to the cytoplasmic presence of reprogramming factors capable of inducing pluripotency in somatic cell nuclei1-3. However, these poorly defined maternal factors presumably decline sharply after fertilization since cytoplasm of pronuclear stage zygotes is reportedly inactive4, 5. Recent evidence suggests that zygotic cytoplasm, if maintained at metaphase (M-phase) can also support derivation of embryonic stem cells (ESCs) following SCNT6-8, albeit at low efficiency. This led to the conclusion that critical oocyte reprogramming factors present in M-phase but not in interphase cytoplasm are “trapped” inside the nucleus during interphase and effectively removed during enucleation9.
Here, we investigated the presence of reprogramming activity in the interphase cytoplasm of 2-cell mouse embryos (I2C). First, the presence of candidate reprogramming factors was documented in both intact and enucleated M-phase and interphase zygotes and 2-cell embryos. Consequently, enucleation did not provide a likely explanation for the inability of interphase cytoplasm to induce reprogramming. Then, when we carefully synchronized the cell cycle stage between the transplanted nucleus (ESC, fetal fibroblast or terminally differentiated cumulus cell) and the recipient I2C cytoplasm, the reconstructed SCNT embryos developed into blastocysts and ESCs capable of contributing to traditional germline and tetraploid chimeras. In addition, direct transfer of cloned embryos, reconstructed with ESC nuclei, into recipients resulted in live offspring. Thus, the cytoplasm of I2C supports efficient reprogramming with cell cycle synchronization between the donor nucleus and recipient cytoplasm as the most critical parameter determining success. The ability to utilize interphase cytoplasm in SCNT could impact efforts to generate autologous human ESCs for regenerative applications since donated or discarded embryos are more accessible than unfertilized, MII oocytes.
We studied mRNA expression levels and cellular localization of several maternal and embryonic factors in unfertilized oocytes and preimplantation stage embryos9-13, namely, Hsf1, Brg1, Bmi1, Pou5f1, Sall4, Esrrb, Apobec1, Aid and Tet1. We initially normalized Gapdh expression and confirmed that mRNA levels were statistically similar in intact and enucleated embryos and protein was evenly distributed in nuclei and cytoplasm14 (Extended Data Fig. 1a, b, c). No significant differences in expression levels of these genes existed between intact and enucleated interphase zygotes and I2C embryos (Extended Data Fig. 1d). Bmi1, Hsf1 and Brg1 proteins were also equally distributed throughout the cells and, therefore, enucleation does not seem to deplete these factors in the cytoplasm (Extended Data Fig. 2a, b).
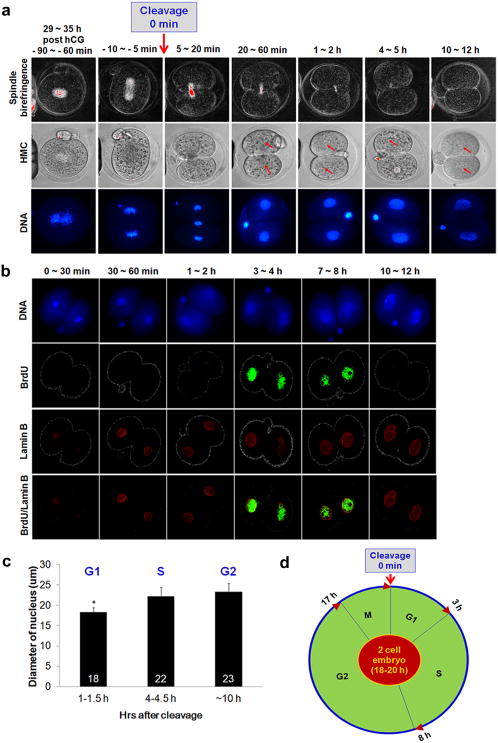
Success in mammalian SCNT has been attributed to the use of G0/G1 arrested donor nuclei with mature, unfertilized oocytes naturally arrested at MII as the recipient cytoplasm1,15. The slight cell cycle mismatch in this case could presumably be corrected shortly after SCNT by nuclear envelope breakdown followed by premature chromosome condensation induced by M-phase specific factors present in the cytoplast16. Thus, both the donor nucleus and recipient cytoplasm resume coordinated embryonic cell divisions after artificial activation of SCNT embryos. In clarifying the importance of cell cycle matching to reprogramming success, we established a timing of cleavage initiation, from which the cell cycle of the recipient I2C cytoplasm could be assessed, individually. Then, we carefully timed the onset and progression of the mitotic cell cycle during the transition from zygote to the 2-cell stage embryo. Most zygotes entered first mitosis between 29 and 35 hrs post-hCG administration and formed centrally localized, metaphase spindles detectable with polarizing microscopy. Zygotes progressed quickly through anaphase and telophase culminating in cell division and formation of the 2-cell embryo. Approximately 30 min after the onset of cleavage, 2-cell embryos formed nuclei that were visible microscopically, corroborated by nuclear envelope detection using lamin B immunocytochemistry. Nuclei became more prominent by 60 min after cleavage and increased in size during the next 10 hours (Fig. 1a, b, c). Incorporation of 5-bromo-2′-deoxyuridine (BrdU), an indicator of S-phase, was first detected approximately 3-4 hrs after cleavage onset and was evident in embryos up to 7-8 hours after cleavage. Embryos labeled after 8 hrs post cleavage did not incorporate BrdU suggesting their transition into the G2 phase (Fig. 1b). The majority of mouse 2-cell embryos completed the full cell cycle and entered into the next M-phase approximately 18-20 hrs after first cleavage. Thus, we determined a complete cell cycle of a mouse 2-cell embryo starting with the initial cleavage (0 hrs) and onset of the G1 phase. The G1 phase concluded and DNA synthesis and the S phase were initiated approximately 3 hrs from the end of the previous M-phase. The S phase ended by 8 hrs and blastomeres entered the G2 phase lasting a minimum of 9 hrs (Fig. 1d). We next determined the cell cycle characteristics of two nuclear donor cell types: fetal fibroblasts (FFs) and ESCs, and sorted populations for G0/G1, G2/M and S phase cells (Extended Data Fig. 3).
Figure 1. Cell cycle progression in 2-cell mouse embryos.
a, Spindle and nuclear changes as a function of time after cleavage. The zygotic embryo began cleavage after going through a short telophase. We defined this event as 0 hrs in the cell cycle. The spindle disappeared gradually followed by nucleus formation and visible increase in size. DNA images were produced from fixed and stained with DAPI embryos, while spindle birefringence and HMC images were taken from live embryos. HMC = Hoffman modulation contrast. b, S phase determination in 2-cell embryos using BrdU incorporation and Lamin B staining for identification of nuclear membrane. c, Measurements of nuclear size as an indication of cell cycle progression (n=5, biological replicates, * p < 0.05. Average diameter ± s.d.). d, The dull cell cycle timing in the 2-cell mouse embryo.
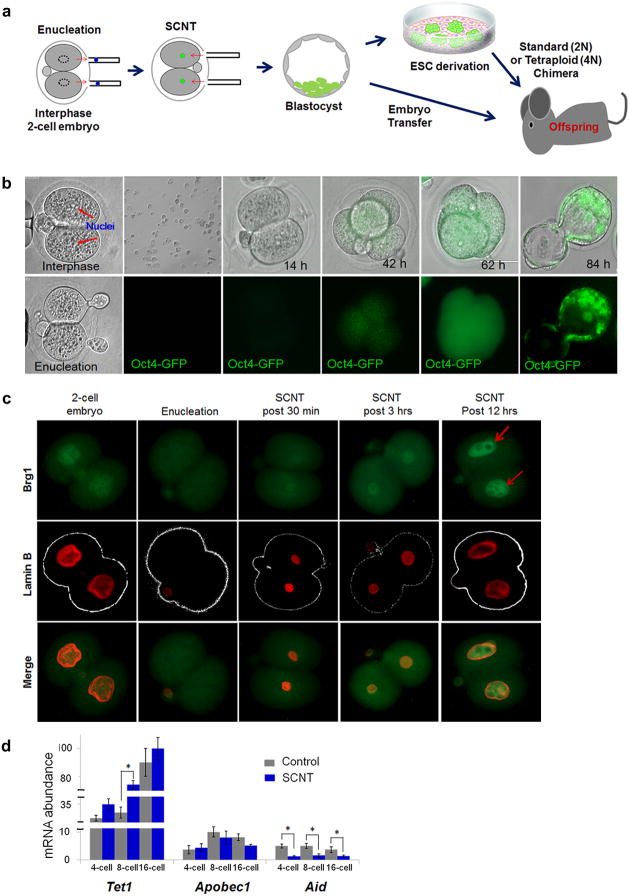
We then examined SCNT into enucleated I2Cs (Fig. 2a). When G0/G1 phase FFs were introduced into early G1 (0.5-1hrs) enucleated blastomeres, 38% of reconstructed SCNT embryos progressed to blastocysts. This rate was comparable to conventional SCNT of G0/G1 FFs into enucleated MII oocytes (40%), although significantly reduced over fertilized controls (94%; Table 1). When G0/G1 FFs were fused into intermediate (1-2 hrs) or late (2-3 hrs) G1 enucleated blastomeres, blastocyst development significantly declined (Table 1) and transfer of G0/G1 FFs into S phase I2C cytoplasm (4-6 hrs) or M-phase zygotes (0 hrs) resulted in developmental arrest. When actively proliferating FFs in S phase were introduced into S phase blastomeres, 24% of the resultant SCNT embryos reached the blastocyst stage. We also used ESCs and cumulus cells for nuclear transfer and observed significant blastocyst development when our matching criteria were satisfied (Table 1). To examine a possible role for sperm activated cytoplasm in interphase SCNT success, we generated enucleated parthenogenetic I2Cs and carried out SCNT with FFs, observing blastocyst development comparable to SCNT into fertilized counterparts or into conventional MII oocytes (Table 1). Thus, both artificial and sperm activated cytoplasm of I2C support reprogramming. Arrest of cell cycle mismatched SCNT embryos could be secondary to nuclear arrest or apoptosis at the G1/S or S/G2 cell cycle checkpoints17 (Extended Data Fig. 4).
Figure 2. Development of mouse embryos generated by interphase SCNT.
a, Experimental design. Interphase SCNT conducted with 2-cell embryos followed by ntESC derivation or production of chimeric or cloned offspring. b, Oct4/GFP re-expression after interphase SCNT using transgenic fetal fibroblasts c, Brg1 and Lamin B protein expression in SCNT embryos. d, Expression of Tet1, Apobec1 and Aid in control and SCNT embryos (n=3, technical replicates, *p < 0.05, average ± s.d.).
Table 1. In vitro development of embryos after nuclear transfer into enucleated interphase 2-cell blastomeres.
| Recipient cytoplasm type | Recipient cytoplasm cell cycle (hrs after cleavage) | Nuclear donor cell cycle | Donor cell type | N | Cleaved embryos (%) | Blastocysts (%) |
|---|---|---|---|---|---|---|
| In vivo fertilized 2-cell embryos | M-phase | G0/G1 | FFs | 55 | 2 (4) | 0 |
| Early G1 (0.5-1) | G0/G1 | FFs | 227 | 110 (48) | 86 (38) | |
| Intermediate G1 (1-2) | G0/G1 | FFs | 56 | 12 (21) | 8 (14) | |
| Late (2-3) | G0/G1 | FFs | 37 | 5 (14) | 4 (11) | |
| S (4-6) | S | FFs | 72 | 27 (38) | 17 (24) | |
| S (4-6) | G0/G1 | FFs | 34 | 0 | 0 | |
| Early G1 (0.5-1) | G1 | ESCs | 161 | 63 (39) | 53 (33) | |
| Early G1 (0.5-1) | S | ESCs | 43 | 0 | 0 | |
| S (4-6) | S | ESCs | 744 | 335 (45) | 293 (39) | |
| S (4-6) | G1 | ESCs | 34 | 3 (9) | 2 (6) | |
| Early G1 (0.5-1) | G0/G1 | CCs | 257 | 58 (23) | 39 (15) | |
| Intact controls | N/A | N/A | 135 | 133 (99) | 127 (94)* | |
| Parthenogenetically activated 2-cell embryos | Early G1 (0.5-1) | G0/G1 | FFs | 32 | 15 (47) | 11 (34) |
| Intact parthenote controls | N/A | N/A | 86 | 84 (98) | 78 (91)* | |
| MII oocytes | MII | G0/G1 | FFs | 289 | 161 (56) | 116 (40) |
| MII | G1 | ESCs | 113 | 46 (41) | 25 (22) | |
| MII | G0/G1 | CCs | 136 | 95 (70) | 23 (17) | |
| MII | S | ESCs | 70 | 8 (11) | 2 (3) |
Control versus experimental treatment within each group
p < 0.05.
FFs - fetal fibroblasts, ESCs - embryonic stem cells, CCs - cumulus cells.
We utilized FFs carrying the GFP transgene under the control of Oct4 promoter18 and beta-galactosidase19 to confirm the origin of the nucleus in cloned embryos. GFP signal was not detectable after fusion with I2C cytoplasm (Fig. 2b). Re-expression of the GFP transgene was observed in late 4-cell embryos that continued into the compact morula. As expected, GFP expression was confined to the inner cell mass having disappeared in the trophectoderm (Fig. 2b). Nuclear donor FFs weakly expressed Brg1 (Extended Data Fig. 2b, c) and a similar signal was found in nuclei of 2-cell SCNT embryos shortly after introduction (Fig. 2c). However, Brg1 protein became increasingly detectable in the nuclei of SCNT embryos, 3 and 12 hrs post transfer, and in the 4- and 8-cell stage (Fig. 2c and Extended Data Fig. 2d).While Hsf1 was not detected in FFs, the protein was expressed in SCNT embryos (Extended Data Fig. 2b, c, d). To examine expression of candidate reprogramming factors in SCNT embryos generated with I2C cytoplasm, we also measured mRNA levels for Apobec1, Aid and Tet1. Expression patterns and levels of Apobec1 and Tet1 were comparable to fertilized controls (p < 0.05), with the exception of the 8-cell stage, where Tet1 was up-regulated in SCNT embryos. Aid transcript levels were significantly lower in SCNT embryos compared to controls (Fig. 2d).
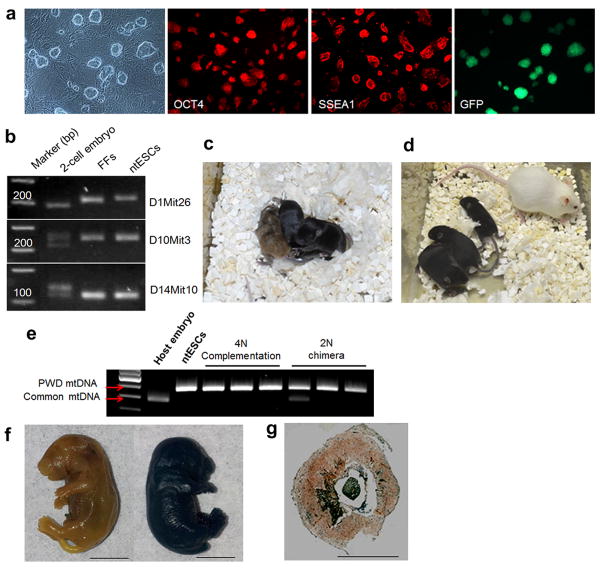
The developmental potential of embryos produced by SCNT with FFs into enucleated I2Cs was evaluated further by plating blastocysts (n=26) onto feeder layers. All adhered, eight formed typical ICM outgrowths and, after subsequent passaging, seven stable ntESC lines (27%), with typical colony morphology and expression of Oct4 and SSEA-1 were established (Fig. 3a and Extended Data Table 1). Similarly, 3 ntESC lines were generated from 14 blastocysts (21%) following interphase SCNT with cumulus cells (Extended Data Table 1). With FFs carrying Oct4-GFP as nuclear donor cells, the resulting ntESCs re-expressed GFP at high levels (Fig. 3a). We confirmed normal karyotype and gender in all ntESC lines (Extended Data Table 1) and corroborated their nuclear DNA origin from somatic cells and mitochondrial DNA inheritance from I2C cytoplasm (Fig. 3b and Extended Data Fig. 5a, b and Extended Data Table 1). The ability to form chimeric offspring was evaluated by random selection of female ntESCs derived from FFs (ntES2) and injection into diploid (2N) 8-cell embryos. After transfer into recipients, 14 pups were born, 10 of which were chimeric based on a coat color contribution of ntESCs on an albino background of host ICR embryos (Extended Data Table 2). The chimera rate varied from 5% to more than 90% as determined by visual evaluation. Pups produced by breeding chimeric females with control males displayed germline transmission of the ntESC genotype (Extended Data Fig. 5c).
Figure 3. Characterization of ntESCs and live offspring born after interphase SCNT.
a, Morphology of ntESCs and expression of the pluripotency markers Oct4 and SSEA1 by immunostaining. Far right; re-expression of GFP in ntESCs derived from fetal fibroblasts carrying Oct4/GFP. b, Genotyping of ntESCs using chromosomal markers D1Mit26, D10Mit3 and D14Mit10. c, 2N chimeric pups generated by injection of ntESCs from cumulus cells (black) into ICR host embryos (albino). Note that two of the three pups contained exclusively ntESC phenotype. d, 4N complementation pups produced after injection of ntESCs (black) into tetraploid host embryo (agouti). e, Genotyping of chimeric offspring generated with ntESCs derived from cumulus cells by mtDNA profiling. All tetraploid and two of the three 2N chimeras contained ntESC mtDNA only. f, X-gal staining of control (non-stained, left) and cloned pup carrying LacZ gene (blue stained, right). g, X-gal detection of placental tissue section in cloned pups. Bar = 0.5 cm.
We also tested ntESCs for the ability to generate all-ESC offspring by tetraploid (4N) complementation20. After transfer of 165 tetraploid embryos injected with ntES2 cells, 5 live pups were recovered, of which 4 survived to adulthood and exhibited exclusively the ntESC coat color phenotype (Extended Data Fig. 5d, Table 2). We corroborated the all-ntESC origin of these mice by microsatellite and mtDNA genotyping (Extended Data Fig. 5a, b, e). Quantitative mtDNA analysis was characterized by the absence of any detectable contribution from host 4N embryos (Extended Data Fig. 5b). Additionally, two ntESC lines derived from adult cumulus cells contributed to chimeras using both 2N and 4N complementation assays (Fig. 3c, d and Extended Data Tables 1, 2). These stringent pluripotency tests confirm that ntESCs derived by SCNT into enucleated I2C blastomeres are the equivalent of embryo-derived ESCs.
Embryos produced by nuclear transfer into I2C cytoplasm were evaluated for totipotency by direct transfer into uteri of pseudopregnant females. When 115 SCNT blastocysts generated with FFs were transferred into 10 recipients, four became pregnant and showed implantation sites, but none contained viable fetuses (Extended Data Table 3). An explanation for failed pregnancy may be the absence of a histone deacetylase inhibitor which is essential to efficient live offspring production in conventional SCNT with MII oocytes21. However, when 89 nuclear transfer blastocysts generated with ESC nuclei carrying a LacZ transgene were transferred, four live pups were recovered by caesarean section (Extended Data Fig. 6a, Table 3). Their body and placental weights varied significantly (Extended Data Fig. 6b). Whole body X-gal staining confirmed the nuclear transfer origin of the offspring (Fig. 3f) and placenta (Fig. 3g). In addition, cloned offspring and their placentas carried LacZ and GFP transgenes (Extended Data Fig. 6c).
Interphase nuclear transfer into fertilized embryos has resulted in live offspring when pronuclei were exchanged between two zygotes4 and when 4 or 8-cell blastomere nuclei were transferred into enucleated 2-cell embryos22. However, nuclear transfer of more advanced ICM cells, ESCs or somatic cells into interphase cytoplasm resulted in early developmental arrest, likely reflecting mismatched cell cycles5,7,22,23. Nuclear transfer of 4-16-cell blastomeres into enucleated MII oocytes has also resulted in live offspring in several species including nonhuman primates24-27. This approach required pre-activation of the recipient cytoplast prior to nuclear transfer resulting in exit from the M-phase and progression to the interphase24,28. Since most randomly chosen nuclear donor blastomeres were also in interphase, synchronization between the nucleus and cytoplast was likely achieved.
The present findings, suggest that the interphase cytoplasm has reprogramming capacity and that precise cell cycle synchrony between donor and recipient can lead to development of functional ESCs or live offspring. This supposition would argue against the premise that SCNT failures involving interphase cytoplasm are secondary to the absence of critical maternal factors removed during enucleation. In view of the present results in the mouse and the unsuccessful attempt to conduct SCNT into human M-phase zygotes29, SCNT into human 2-cell embryos with proper cell cycle matching should be reconsidered.
Methods
Preparation of nuclear donor cells
The carcass of a fourteen day fetus was collected and treated with 0.1% collagenase for 30 min. The digested tissue was cultured with 10% FBS and 100 ug/ml penicillin/ streptomycin in DMEM. Early passages (2-4) FFs were used for SCNT. For G0/G1 phase, cells were seeded in 4-well plates, and cultured for 1 week with 0.5% FBS medium. For S phase, G0/G1 arrested FFs were seeded at low density in ESC growth medium (see below), and cultured for 20 hours. The cumulus-oocyte complexes were collected from superovulated females 18-20 hrs after hCG injection (see below) and briefly exposed to a medium containing 0.1% hyaluronidase for disaggregation. Dispersed cumulus cells were rinsed and kept in KSOM medium (Millipore) before use.
ESCs and FFs were fixed overnight in 70% ethanol, washed in DPBS and stained with 10 μg/ml propidium iodide (Sigma) in DPBS for 1 hr on ice for flow cytometric analysis (BD Biosciences, LSRII flow cytometer). FFs were either arrested at G0/G1 by culture to confluency under low serum conditions or forced to proliferate and enter S phase after re-plating G0/G1 arrested cells at low density in medium containing serum. In confluent FFs, nearly 79% of the cells were at G0/G1, 3% were at S and 18% were at G2/M phase. However, after sorting by size (small ≤12 μm, large ≥16 μm), small sized FFs were enriched for G0/G1 cells (91%). In proliferating FFs, the proportion of S phase cells was significantly increased (70%). We also confirmed S phase by 30 μM BrdU (BD PharmingenTM) incorporation for 30 min BrdU after 3.7% formaldehyde fixation. There was no significant correlation between cell size and cell cycle phase distribution in proliferating FFs. In actively proliferating ESCs, 27% were at G0/G1, 47% at S and 26% at the G2/M phase. When ESCs were sorted based on size, approximately 70% of small cells (≤9 μm) were G0/G1. In contrast, most medium sized cells (10-15μm) were in S phase (BrdU+) while a significant percentage of large cells (≥16 μm) were in the G2/M phase. Based on these observations, most small sized ESCs and confluent FFs were in the G0/G1 phase, while proliferating FFs or medium sized ESCs were predominantly at the S phase.
Cell cycle determination in recipient embryos
Pronuclear stage zygotes were collected from superovulated, mated females and continuously examined before and after the first cleavage division by Hoffman modulation contrast and polarized microscopy. Selected embryos were also fixed and labeled with antibodies against Lamin B and DAPI to follow nuclear membrane and chromatin dynamics, respectively. To define the onset of the S phase, we sampled every hour after the onset of cleavage into the 2-cell stage with 5-bromo-2′-deoxyuridine (BrdU) that incorporates into newly synthesized DNA during replication. The embryos were incubated in100 μM BrdU for 20 min with the remaining steps carried out according to the manufacturer's instructions before embryo observation by fluorescence microscopy (×400).
Interphase 2-cell SCNT
Nuclear transfer of FFs, ESCs or cumulus cell into interphase, enucleated 2-cell blastomeres was undertaken with defined matches between the cell cycle of the recipient cytoplasm and the transplanted nucleus. In vivo fertilized, pronuclear stage zygotes were recovered and continuously monitored for the onset of cleavage. Two-cell blastomeres enucleated within 0.5-3 hrs after the onset of cleavage were considered G1 cytoplasts while enucleations conducted 4-6 hrs after the first mitosis were defined as S phase. Both blastomeres were enucleated under Hoffman contrast microscopy, and an intact nuclear donor cell was introduced into each enucleated blastomere using the fusogenic activity of HVJ-E (Fig. 2b and SI video).
Derivation and culture of ESCs
The zona pellucida was removed with acidic Tyrode's solution (Sigma-Aldrich) and denuded blastocysts were placed onto mitomycin C (Sigma) treated mouse embryonic fibroblast (mEF) feeder layers in ESC derivation medium: KO DMEM (Invitrogen) containing 15% KOSR (Invitrogen), 5% FBS (HyClone), mitogen-activated protein kinase inhibitor (PD98059; Cell Signalling) and 1,000 units/ml LIF (Sigma). After ICM outgrowth, the cultures were dispersed into single cells using trypsin and seeded on fresh mEFs in complete ESC medium: KO DMEM, 1 mM L-glutamine, 100 units/ml penicillin/100 μg/ml streptomycin, 100 μM β-mercaptoethanol (Sigma), 100 μM nonessential amino acids (Invitrogen), 1,000 units/ml LIF, 10% FBS and 10% KOSR.
Chimera Assay and embryo transfer
Approximately 10 ESCs were injected into 4-8 cell embryos recovered from B6D2F1 females mated with C3H males for 4N embryo complementation or from ICR for 2N chimeras. Injected embryos were cultured one day in KSOM. SCNT or chimeric blastocysts were transferred into the uteri of pseudo-pregnant (E2.5) ICR females. Caesarian section was performed on gestational days 18.5 through 20.5.
Genotyping analyses
Genotyping primers, D1Mit26, D10Mit3 and D14Mit10 were obtained from MGI (mouse Genome Informatics, www.informatics.jax.org). GFP, LacZ, and mitochondrial analysis primers are described in Extended Data table 9. DNA was extracted from tail tips using Arcturus Microgenomics reagent kit (Applied Biosystems) or from cultured cells using a DNA kit (Gentra SYSTEMS). PCR products were separated by 3% agarose gels and visualized by ethidium bromide staining.
PCR products were sequenced and the informative single nucleotide polymorphic (SNP) sites were identified using Sequencher v. 4.7 software (GeneCodes). Allele Refractory Mutation System quantitative PCR (ARMS-qPCR) assays were performed to measure mtDNA heteroplasmy levels in chimeric offspring as previously described30. Primers and TaqMan MGB probes were designed to detect unique mtDNA regions between wild type and PWD/ph mtDNA. CO3 (common mtDNA region)-TET (yellow) and ND5 (wild specific mtDNA region)-FAM (blue) were mixed and measured with Rotor-Gene Multiplex PCR Kit (Qiagen). PCR reactions (15μl) containing 1× PCR Master Mix, 100-250 nM each primer, 150 nM each TaqMan probe and either 0.5 and 4 ng of total genomic DNA were performed according to the manufacturer's instructions using a ABI 7900HT fast real-time PCR system (Applied Biosystems).
X-gal staining
Fetuses and placenta (E18.5) were removed by caesarian section and fixed overnight in 3.7% formaldehyde at 4°C, washed three times in PBS, cleared in 70% ethanol followed by incubation in 30% sucrose at 4°C overnight, embedding (Tissue-Tek OCT compound; Sakura Finetechnical) and freezing on dry ice. Sagittal sections (10 μm) were cut at -18°C with a cryostat (Leica Instrument). The specimen was stained overnight at 37°C in X-gal (1mg/ml), potassium ferricyanide (5 mM), potassium ferrocyanide (5 mM), MgCl2 (2 mM) in PBS.
Analysis of gene expression
Total RNA was isolated and pooled from 10 embryos for each experiment (MII oocytes [18 h], interphase [one cell, 24-26 h], M-phase [one cell, 28-30 h], 2 cell [31-33 h], 2 cell cytoplast [nuclei removed, 31-33 h], 4 cell [50-52 h], 8 cell [66-68 h], 16 cell [74-76 h], and blastocyst [98-100 h]) with an Arcturus pico pure RNA isolation kit (Life technologies). RNA was immediately treated with DNase I (Invitrogen) and reversed into cDNA using the SuperScript III first-strand synthesis system (Invitrogen) according to the manufacturer's instructions. RT-PCR was performed using an ABI 7900HT Real time PCR system and the SYBR Green PCR mix (Applied Biosystems). The samples were heated to 95 °C for 10 min and run for 40 cycles of: 94 °C for 15 s, 58°C for 20 s, 72°C for 30 s. Gene expression was normalized to Gapdh.
Immunostaining
Embryos were labeled with antibodies for Brg1 (SC-10768), Lamin B (SC-6217), Bmi1 (SC-30943) and Hsf1 (SC-9144). ESCs were stained with antibodies for Oct4 (SC-30943) and SSEA-1(SC-21702). Secondary antibodies were coupled with FITC or Cy3 and DAPI was used for counterstaining nuclei. All antibodies were purchased from Santa Cruz.
Western blot
Embryos were collected and washed three times in TBS and transferred into 7 μl of RIPA extraction buffer supplemented with protease inhibitors. Protein samples were diluted with 2.5 μl sample buffer and 1 μl reducing agent, incubated 10 min at 70°C, and size separated using 4-12% Bis-Tris Mini Gel (novex, Life technologies). Proteins were blotted into polyvinylidene fluoride (PVDF) membranes (Hybond-P, GE Healthcare). Nonspecific binding was blocked by blocking solution (Invitrogen) at room temperature for 1 h. Membranes were probed 1h at room temperature with primary antibody (1:200 rabbit anti-Brg1; SC-10768, 1:200 rabbit anti-Hsf1; SC-9144, 1:5000 rabbit anti-Gapdh; G9545, Sigma). Primary antibodies were detected with a HRP-conjugated secondary antibody (1:10,000 goat anti-rabbit) applied for 1 h at room temperature and developed with Femto Maximum Chemiluminescent Substrates (SuperSignal 34095; Thermo Scientific).
Statistical analysis
All data are presented as average ± s.d. One-way ANOVA was used to compare differences among groups followed by post comparison between groups by Bonferroni using IBM SPSS statistics 20 software.
Primer information
|
| ||
| Gene | Primer (5′-3′) | Remarks |
|
| ||
| Beta-actin | F-AGCCATGTACGTAGCCATCC | |
| R-CTCTCAGCTGTGGTGGTGAA | ||
| Gapdh | F-CCACCCAGAAGACTGTGGAT | |
| R-CACATTGGGGGTAGGAACAC | ||
| Brg1 | F-CTGCGTAAGATCTGCAACCA | |
| R-TTGGCAAAAGAGGAGCACTT | ||
| Bmi1 | F-TGTCCAGGTTCACAAAACCA | |
| R-TGCAACTTCTCCTCGGTCTT | ||
| Hsf1 | F-CCAGCAGCAAAAAGTTGTCA | |
| R-GTAGGCTGGAGATGGAGCTG | ||
| Aid (Aicda) | F-GGTACCTGGGAGTCGTTTGA | Bhutani et al., 2010 |
| R-GGTGAATGCCACTTTCCCTA | ||
| Apobec1 | F-AAGGATACCACCCCATCTCC | |
| R-CCCTACCCATGAATGACACC | ||
| Tet1 | F-GAGCCTGTTCCTCGATGTGG | Ito et al, 2010 |
| R-CAAACCCACCTGAGGCTGTT | ||
| Pou5f1 | F- GACTCCACCTCACACGGTTC | May et al., 2009 |
| R- CAGACCACCATCTGTCGCT | ||
| Sall4 | F- CGACCACCCAAGTATTGCCAG | Wang et al., 2001 |
| R- AGGTGCAACAAGTCAGAGGAA | ||
| Esrrb | F- TGGACTCGCCGCCTATGTTCG | Mitsunaga et al., 2004 |
| R- ACTTGCGCCTCCGTTTGGTGA | ||
| ROSA26-LacZ | F- CTTGTGATCCGCCTCGGAGTATT | Matthew et al, 2004 |
| R- CGCGCCGCTGTAAAGTGTTACGT | ||
| GFP | F- TGCAGTGCTTCAGCCGCTAC | |
| R- TCGCCCTCGAACTTCACCTC | ||
| mtCO3 | F-TCTAGCCTC GTA CCA ACA CAT GAT | ARMS qPCR |
| R-TGAAACACCTGATGCTAGAAGTACTGA | ||
| mtPWD/ph-ND2 | F-ACTGCACATAGGACTTATTCTTGTC | ARMS qPCR |
| R-TTGAGTAGCGGGTAGATTAGG | ||
| mtWild-ND5 | F-CCTACTAATTACACTAATCGCCACT | ARMS qPCR |
| R-GAGGTCTGGGTCATTTTCGTTA | ||
| mtCommon-ND5 | F-TGCAACACCAACGCCTGAGCC | |
| R-TTGTGTGAAGAGTTGAGGTGG | ||
| mtPWD/ph-ND5 | F-CTAATCACACTAATTGCCACC | |
| R-GTAGTAAGTGGCGTAATGTGG | ||
| mtWild-ND5 | F-TTCCACCAACCAACATTCCAA | |
| R-ATAATAAGTGGCGTAATGTGG | ||
|
| ||
Extended Data
Extended Data Figure 1. Maternal and embryonic gene expression patterns.
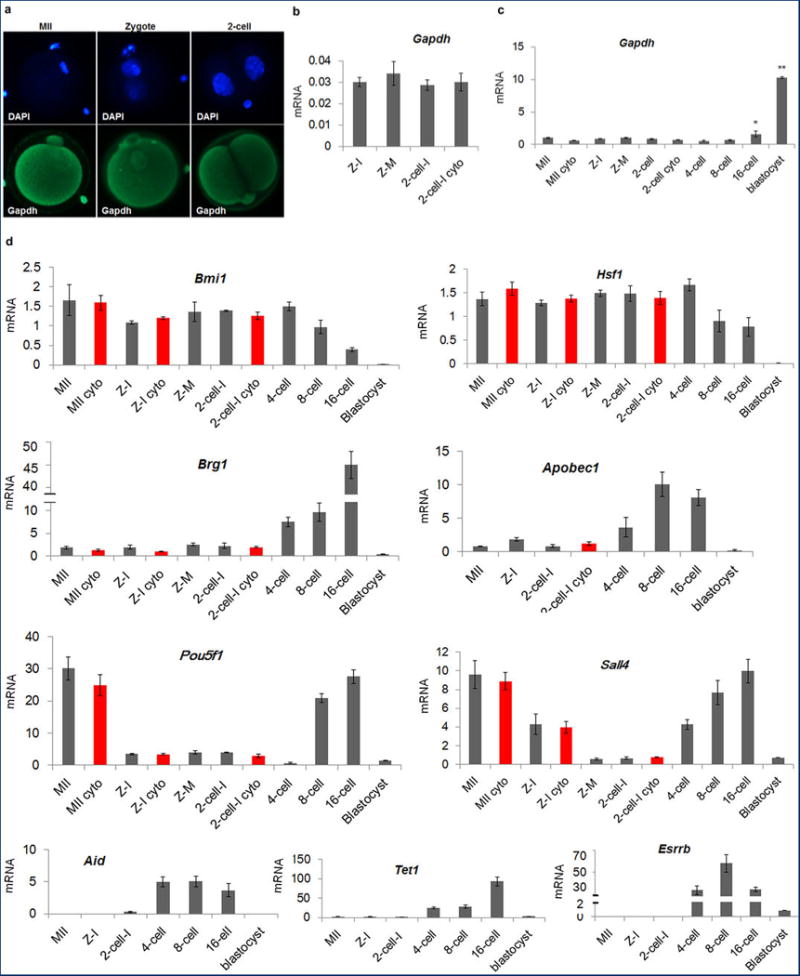
a, Immunocytochemical detection of Gapdh signal demonstrated even distribution in nuclei and cytoplasm in MII oocytes and interphase zygotes and 2-cell embryos. b, Expression of Gapdh normalized to β-actin. No significant differences were seen between intact and enucleated 2-cell embryos (4 replicates each containing pooled RNA from 5 embryos, p > 0.05). c, Gapdh expression was relatively low and constant with no significant differences seen until the 8-cell stage. Expression was increased in 16-cell embryos and blastocysts (3 replicates each containing pooled RNA from 10 embryos, *p < 0.05). d, Gene expression of the transcriptional regulators Bmi1, Hsf1, Brg1, Sall4 and Esrrb, transcription factor Pou5f1, and epigenetic factors Apobec1, Aid and Tet1 during mouse preimplantation embryo development. The level of expression for Brg1, Apobec1, Pou5f1, Sall4, Aid, Tet1 and Esrrb underwent dramatic increases at or after the 4-cell stage. The red bars indicate enucleated oocytes, zygotes or 2-cell embryos. No significant differences were observed between intact and enucleated counterparts (n=3 biological replicates, p < 0.05). Gene expression was normalized to Gapdh. Error bars indicate average ± s.d., MII = Metaphase II arrested oocyte, Z =Zygote, I = Interphase, M = mitotic, Cyto = Cytoplast.
Extended Data Figure 2. Protein expression of candidate reprogramming factors.
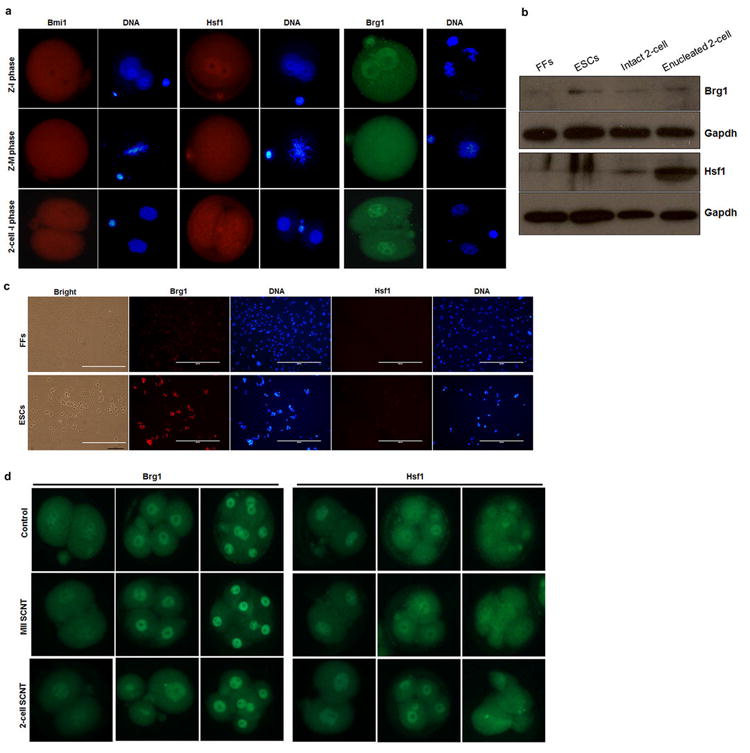
a, Immunocytochemical detection of Bmi1, Hsf1 and Brg1 in zygotic interphase, M-phase and 2-cell interphase embryos. The expression pattern of these proteins was similar to that observed for mRNA expression (Extended Data Fig. 1d). 2-cell-I phase embryos were fixed 4 hours after cleavage. b, Western blot detection of Brg1 and Hsf1 in nuclear donor cells, intact and enucleated 2-cell embryos (n=40). c, Immunocytochemical detection of Brg1 and Hsf1 in nuclear donor FFs and ESCs. D, Immunocytochemical detection of Brg1 and Hsf1 in SCNT embryos. Z = zygote, M = mitosis, MII-metaphase II acolyte, I = interphone, FFs = fetal fibroblasts, ESCs = embryonic stem cells.
Extended Data Figure 3. Cell cycle determination in nuclear donor cells.
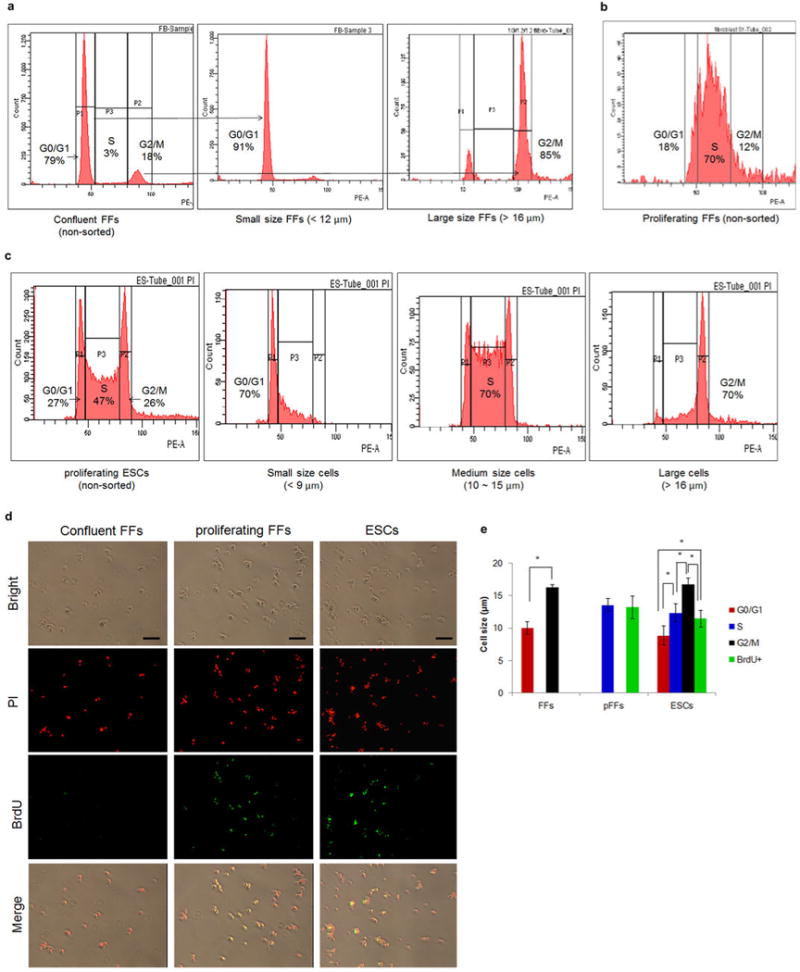
a, Confluent fetal fibroblast (FF) populations subjected to flow cytometric processing. After sorting by size and density, 91% of small sized cells were in the G0/G1 phase of the cell cycle. b, Proliferating FF populations were mostly at S phase. c, ESC populations by flow cytometry. The size was correlated with the cell cycle, 70% of the small, medium and large size cell were at G0/G1, S and G2/M, respectively. d, FITC conjugated-BrdU was used to define S phase FFs and ESCs. e, Correlation of cell size and cell cycle in FFs and ESCs. Cell size was measured photographically after 3.7% formaldehyde fixation. S phase cells were separated by BrdU integration (green). The assignments of cell size provided in panels a, b and c were defined from the results in panel E (* p < 0.05), pFFs = proliferating fetal fibroblasts.
Extended Data Figure 4. Nuclear staining of cell cycle matched and mismatched SCNT embryos.
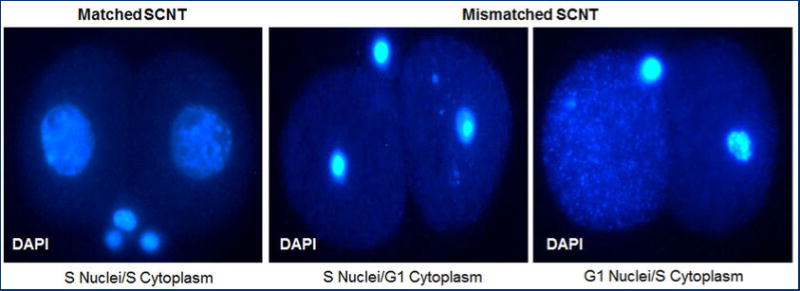
Left panel - expanded nuclei of developmentally competent 2-cell SCNT embryos generated by transfer of S-phase FF nuclei into enucleated S-phase 2-cell embryo. Middle and right panels – Condensed or dispersed nuclei of arrested SCNT embryos generated after cell cycle mismatch between donor nucleus and recipient cytoplasm. Embryos were arrested and apoptotic by the G1/S or S/G2 cell cycle checkpoints, respectively. SCNT embryos were fixed 15 hrs after cleavage.
Extended Data Figure 5. Genotyping of chimeric mice.
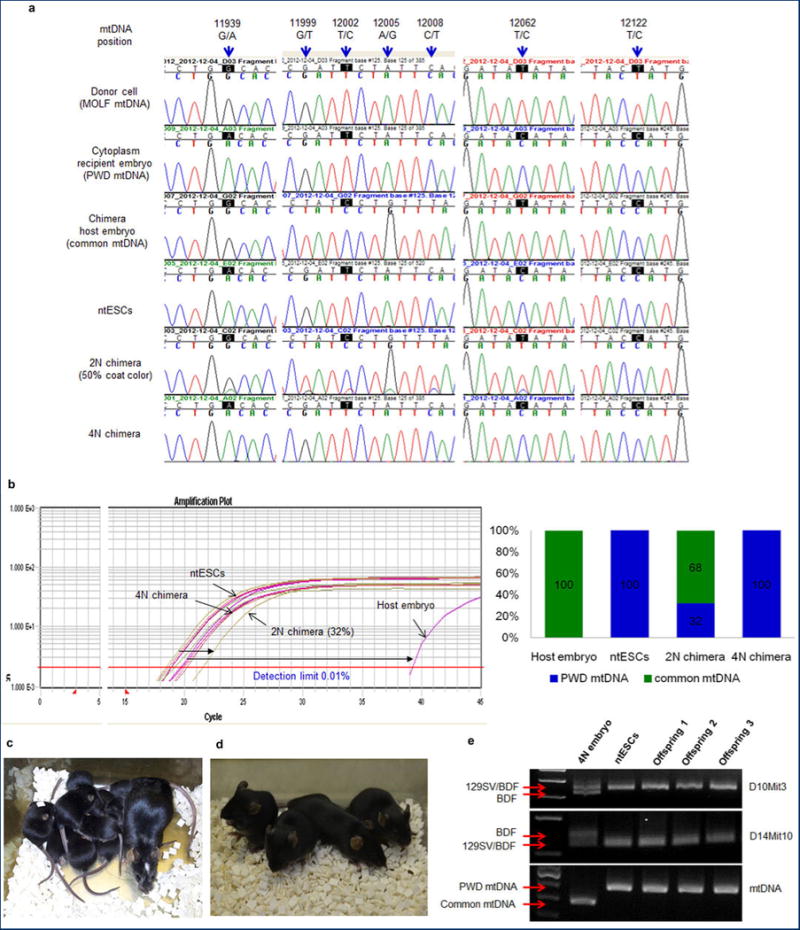
a, Chromatogram of mtDNA depicting sequence differences at base pairs (bp) 11939, 12062 and 12122 and demonstrating that mtDNA in ntESCs was derived from recipient embryo cytoplasm. Sequence differences between chimera host embryos and ntESCs at 11939, 12199, 12002, 12005, 12008 and 12062 bp allowed quantification of chimerism. The mtDNA from 2N chimeric mouse appeared as a double peak. The 4N chimera showed only ntESC mtDNA (GeneBank AY172335.1). b, Allele Refractory Mutation System quantitative PCR (ARMS-qPCR) assay in 2N and 4N chimeras. Similar colors indicate similar origin. Distances between color plots represent the contribution of chimeric host embryos. Amplification plot (left) and bar graph (right). Detection limit of this assay is 0.01%. c, High ntESC contribution chimeric female and her pups demonstrating germline transmission. White spot on the head of the dam originated from the ICR host embryo. d, Tetraploid (4N) embryo complementation pups born after ntESC (black) injection into host 8-cell stage 4N embryos. e, Genotyping of 4N complementation pups.
Extended Data Figure 6. Cloned offspring and genotyping.
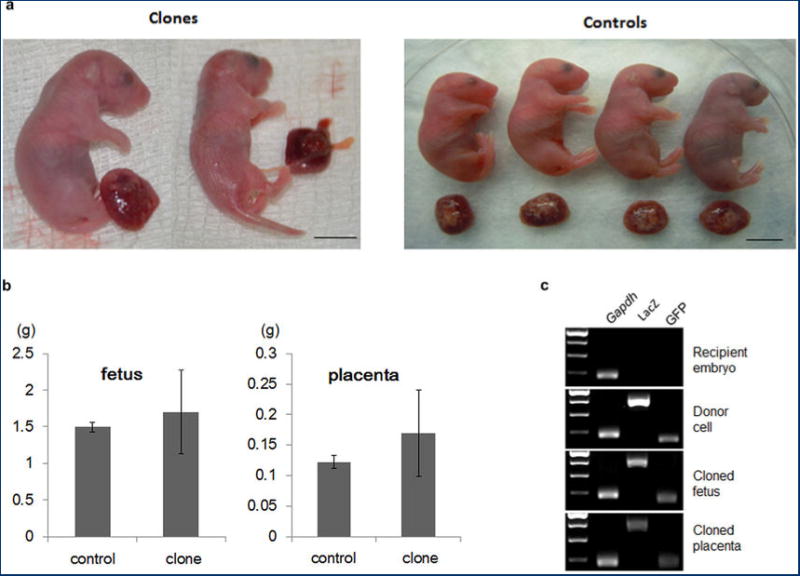
a, Body and placenta of cloned and control pups delivered by caesarian section at 20 days. Clones and placentas were larger or smaller than controls. b, Genotyping of nuclear donor cells and cloned pups carrying ROSA26+/-OG2+/-. c, Fetal and placental weights (g) of cloned and control pups.
Extended Data Table 1. Origin of ntESC lines generated by SCNT into enucleated interphase 2-cell embryos and their ability to contribute to chimeras.
| ntESCs | Gender | Nuclear donor cells | Genotype of donor cells | mtDNA of donor cells | 2-Cell embryo mtDNA | 2N chimera | 4N chimera |
|---|---|---|---|---|---|---|---|
| ntES1 | M | FFs | B6D2F1 | common | PWD | n/t | n/t |
| ntES2 | F | FFs | 129S1/SvlmJ | MOLF | PWD | yes | yes |
| ntES3 | M | FFs | B6D2F1 | common | PWD | yes | n/t |
| ntES4 | M | FFs | B6D2F1 | common | PWD | n/t | n/t |
| ntES5 | M | FFs | B6D2F1 | common | common | n/t | n/t |
| ntES6 | F | FFs | Oct4-GFP | common | common | n/t | n/t |
| ntES7 | F | FFs | Oct4-GFP | common | PWD | n/t | n/t |
| ntES8 | F | CCs | B6D2F1 | PWD | PWD | yes | yes |
| ntES9 | F | CCs | B6D2F1 | PWD | PWD | n/t | yes |
| ntES10 | F | CCs | B6D2F1 | PWD | PWD | n/t | n/t |
n/t - non tested, FFs - fetal fibroblasts, CCs - cumulus cells.
Extended Data Table 2. Ability of ntESCs to contribute to chimeras after injection into diploid (2N) or tetraploid (4N) host embryos.
| Cell line | Host embryo type |
N | N recipients (pregnant) |
N Pups born /recipients |
N chimeras |
>90% chimerism |
Survived >90% chimerism |
|---|---|---|---|---|---|---|---|
| ntES2 | 2N | 217 | 12 (4) | 14/4 | 10 | 5 | 3 |
| ntES2 | 4N | 165 | 14 (6) | 5/3 | 5 | 5 | 4 |
| ntES3 | 2N | 250 | 13 (8) | 12/4 | 12 | 3 | 1 |
| ntES8 | 2N | 90 | 6(3) | 9/3 | 9 | 8 | 7 |
| ntES8 | 4N | 180 | 15(6) | 7/3 | 7 | 7 | 6 |
| ntES9 | 2N | 137 | 9(5) | 5/3 | 5 | 5 | 4 |
| Control ESCs | 4N | 313 | 22(11) | 19/6 | 19 | 19 | 4 |
Extended Data Table 3. In vivo development of embryos derived by nuclear transfer into enucleated interphase 2-cell embryosor MII oocytes.
| Nuclear donor cells | Recipient cytoplasm | N embryos transferred/recipients | N pregnant recipients | Live pups born (%) |
|---|---|---|---|---|
| FFs | Interphase 2-cell embryo | 115/10 | 4 | 0 |
| MII oocyte | 170/10 | 4 | 1 (0.6%) | |
|
|
||||
| ESCs | Interphase 2-cell embryo | 89/8 | 3 | 4 (4.5%) |
FFs - fetal fibroblasts, ESCs - embryonic stem cells
Supplementary Material
Acknowledgments
The authors would like to acknowledge the Small Lab Animal Unit at Oregon National Primate Research Center for providing expertise and services that contributed to this project. We are indebted to Erin Wolff, Atsushi Sugawara, Cathy Ramsey, Hyo-Sang Lee, Joy Woodward, Dario Melquizo Sanchisiz, Crystal Van Dyken and Barbra Manson for their technical support. The study was supported by grants from the National Institutes of Health R01HD063276, R01HD057121, R01HD059946, R01EY021214, P51OD011092 and funds from the Leducq Fondation and the Collins Medical Trust.
Footnotes
Author contributions: S.M. and E.K conceived and planned the study, E.K. carried out SCNT experiments, G.M. conducted terraploid chimera experiments, H.M., Y.I., R.T.H., M.T. and M.S. assisted with colony management, oocyte and embryo collections, embryo transfers, ESC isolation and culture and expression profiling. E.K., D.W., H.S. and S.M. analyzed data and wrote the manuscript.
Author information: Reprints and permissions information is available at www.nature.com/reprints.
The authors declare no competing financial interests. Readers are welcome to comment on the online version of the paper.
References
- 1.Wilmut I, Schnieke AE, McWhir J, Kind AJ, Campbell KH. Viable offspring derived from fetal and adult mammalian cells. Nature. 1997;385:810–813. doi: 10.1038/385810a0. [DOI] [PubMed] [Google Scholar]
- 2.Gurdon JB, Wilmut I. Nuclear transfer to eggs and oocytes. Cold Spring Harb Perspect Biol. 2011 Jun 3;3(6) doi: 10.1101/cshperspect.a002659. [DOI] [PMC free article] [PubMed] [Google Scholar]
- 3.Tachibana M, et al. Human embryonic stem cells derived by somatic cell nuclear transfer. Cell. 2013;153:1228–1238. doi: 10.1016/j.cell.2013.05.006. [DOI] [PMC free article] [PubMed] [Google Scholar]
- 4.McGrath J, Solter D. Inability of mouse blastomere nuclei transferred to enucleated zygotes to support development in vitro. Science. 1984;226:1317–1319. doi: 10.1126/science.6542249. [DOI] [PubMed] [Google Scholar]
- 5.Wakayama T, Tateno H, Mombaerts P, Yanagimachi R. Nuclear transfer into mouse zygotes. Nat Genet. 2000;24:108–109. doi: 10.1038/72749. [DOI] [PubMed] [Google Scholar]
- 6.Egli D, Sandler VM, Shinohara ML, Cantor H, Eggan K. Reprogramming after chromosome transfer into mouse blastomeres. Curr Biol. 2009;19:1403–1409. doi: 10.1016/j.cub.2009.06.065. [DOI] [PMC free article] [PubMed] [Google Scholar]
- 7.Egli D, Rosains J, Birkhoff G, Eggan K. Developmental reprogramming after chromosome transfer into mitotic mouse zygotes. Nature. 2007;447:679–685. doi: 10.1038/nature05879. [DOI] [PubMed] [Google Scholar]
- 8.Riaz A, et al. Mouse cloning and somatic cell reprogramming using electrofused blastomeres. Cell Res. 2011;21:770–778. doi: 10.1038/cr.2010.180. [DOI] [PMC free article] [PubMed] [Google Scholar]
- 9.Egli D, Birkhoff G, Eggan K. Mediators of reprogramming: transcription factors and transitions through mitosis. Nat Rev Mol Cell Biol. 2008;9:505–516. doi: 10.1038/nrm2439. [DOI] [PMC free article] [PubMed] [Google Scholar]
- 10.Nichols J, et al. Formation of pluripotent stem cells in the mammalian embryo depends on the POU transcription factor Oct4. Cell. 1998;95:379–391. doi: 10.1016/s0092-8674(00)81769-9. [DOI] [PubMed] [Google Scholar]
- 11.Zhang J, et al. Sall4 modulates embryonic stem cell pluripotency and early embryonic development by the transcriptional regulation of Pou5f1. Nat Cell Biol. 2006;8:1114–1123. doi: 10.1038/ncb1481. [DOI] [PubMed] [Google Scholar]
- 12.Festuccia N, et al. Esrrb is a direct Nanog target gene that can substitute for Nanog function in pluripotent cells. Cell Stem Cell. 2012;11:477–490. doi: 10.1016/j.stem.2012.08.002. [DOI] [PMC free article] [PubMed] [Google Scholar]
- 13.Jullien J, Pasque V, Halley-Stott RP, Miyamoto K, Gurdon JB. Mechanisms of nuclear reprogramming by eggs and oocytes: a deterministic process? Nat Rev Mol Cell Biol. 2011;12:453–459. doi: 10.1038/nrm3140. [DOI] [PMC free article] [PubMed] [Google Scholar]
- 14.Zheng L, Roeder RG, Luo Y. S phase activation of the histone H2B promoter by OCA-S, a coactivator complex that contains GAPDH as a key component. Cell. 2003;114:255–266. doi: 10.1016/s0092-8674(03)00552-x. [DOI] [PubMed] [Google Scholar]
- 15.Wakayama T, Rodriguez I, Perry AC, Yanagimachi R, Mombaerts P. Mice cloned from embryonic stem cells. Proc Natl Acad Sci U S A. 1999;96:14984–14989. doi: 10.1073/pnas.96.26.14984. [DOI] [PMC free article] [PubMed] [Google Scholar]
- 16.Mitalipov SM, et al. Reprogramming following somatic cell nuclear transfer in primates is dependent upon nuclear remodeling. Hum Reprod. 2007;22:2232–2242. doi: 10.1093/humrep/dem136. [DOI] [PubMed] [Google Scholar]
- 17.Jaroudi S, SenGupta S. DNA repair in mammalian embryos. Mutat Res. 2007;635:53–77. doi: 10.1016/j.mrrev.2006.09.002. [DOI] [PubMed] [Google Scholar]
- 18.Scholer HR, Dressler GR, Balling R, Rohdewohld H, Gruss P. Oct-4: a germline-specific transcription factor mapping to the mouse t-complex. EMBO J. 1990;9:2185–2195. doi: 10.1002/j.1460-2075.1990.tb07388.x. [DOI] [PMC free article] [PubMed] [Google Scholar]
- 19.Zambrowicz BP, et al. Disruption of overlapping transcripts in the ROSA beta geo 26 gene trap strain leads to widespread expression of beta-galactosidase in mouse embryos and hematopoietic cells. Proc Natl Acad Sci U S A. 1997;94:3789–3794. doi: 10.1073/pnas.94.8.3789. [DOI] [PMC free article] [PubMed] [Google Scholar]
- 20.Wu G, et al. Generation of healthy mice from gene-corrected disease-specific induced pluripotent stem cells. PLoS Biol. 2011;9:e1001099. doi: 10.1371/journal.pbio.1001099. [DOI] [PMC free article] [PubMed] [Google Scholar]
- 21.Kishigami S, et al. Significant improvement of mouse cloning technique by treatment with trichostatin A after somatic nuclear transfer. Biochem Biophys Res Commun. 2006;340:183–189. doi: 10.1016/j.bbrc.2005.11.164. [DOI] [PubMed] [Google Scholar]
- 22.Tsunoda Y, et al. Full-term development of mouse blastomere nuclei transplanted into enucleated two-cell embryos. J Exp Zool. 1987;242:147–151. doi: 10.1002/jez.1402420205. [DOI] [PubMed] [Google Scholar]
- 23.Eckardt S, Leu NA, Kurosaka S, McLaughlin KJ. Differential reprogramming of somatic cell nuclei after transfer into mouse cleavage stage blastomeres. Reproduction. 2005;129:547–556. doi: 10.1530/rep.1.00673. [DOI] [PubMed] [Google Scholar]
- 24.Mitalipov SM, Yeoman RR, Nusser KD, Wolf DP. Rhesus monkey embryos produced by nuclear transfer from embryonic blastomeres or somatic cells. Biol Reprod. 2002;66:1367–1373. doi: 10.1095/biolreprod66.5.1367. [DOI] [PubMed] [Google Scholar]
- 25.Stice SL, Robl JM. Nuclear reprogramming in nuclear transplant rabbit embryos. Biol Reprod. 1988;39:657–664. doi: 10.1095/biolreprod39.3.657. [DOI] [PubMed] [Google Scholar]
- 26.Willadsen SM. Nuclear transplantation in sheep embryos. Nature. 1986;320:63–65. doi: 10.1038/320063a0. [DOI] [PubMed] [Google Scholar]
- 27.Cheong HT, Takahashi Y, Kanagawa H. Birth of mice after transplantation of early cell-cycle-stage embryonic nuclei into enucleated oocytes. Biol Reprod. 1993;48:958–963. doi: 10.1095/biolreprod48.5.958. [DOI] [PubMed] [Google Scholar]
- 28.Stice SL, Keefer CL, Matthews L. Bovine nuclear transfer embryos: oocyte activation prior to blastomere fusion. Mol Reprod Dev. 1994;38:61–68. doi: 10.1002/mrd.1080380111. [DOI] [PubMed] [Google Scholar]
- 29.Egli D, et al. Reprogramming within hours following nuclear transfer into mouse but not human zygotes. Nat Commun. 2011;2:488. doi: 10.1038/ncomms1503. [DOI] [PMC free article] [PubMed] [Google Scholar]
- 30.Lee HS, et al. Rapid mitochondrial DNA segregation in primate preimplantation embryos precedes somatic and germline bottleneck. Cell Rep. 2012;1:506–515. doi: 10.1016/j.celrep.2012.03.011. [DOI] [PMC free article] [PubMed] [Google Scholar]
Associated Data
This section collects any data citations, data availability statements, or supplementary materials included in this article.


